
Incident response & management integrated with observability, all in Grafana Cloud
The actually useful Grafana Cloud Free plan
- 50GB traces
- 10k metrics
- 14-day retention
- 3 active users
- 50GB logs of telemetry
Respond to issues quickly and confidently
Tailor workflows so you have all the information and the right stakeholders you need to address issues and guarantee 24/7 coverage with Grafana OnCall.
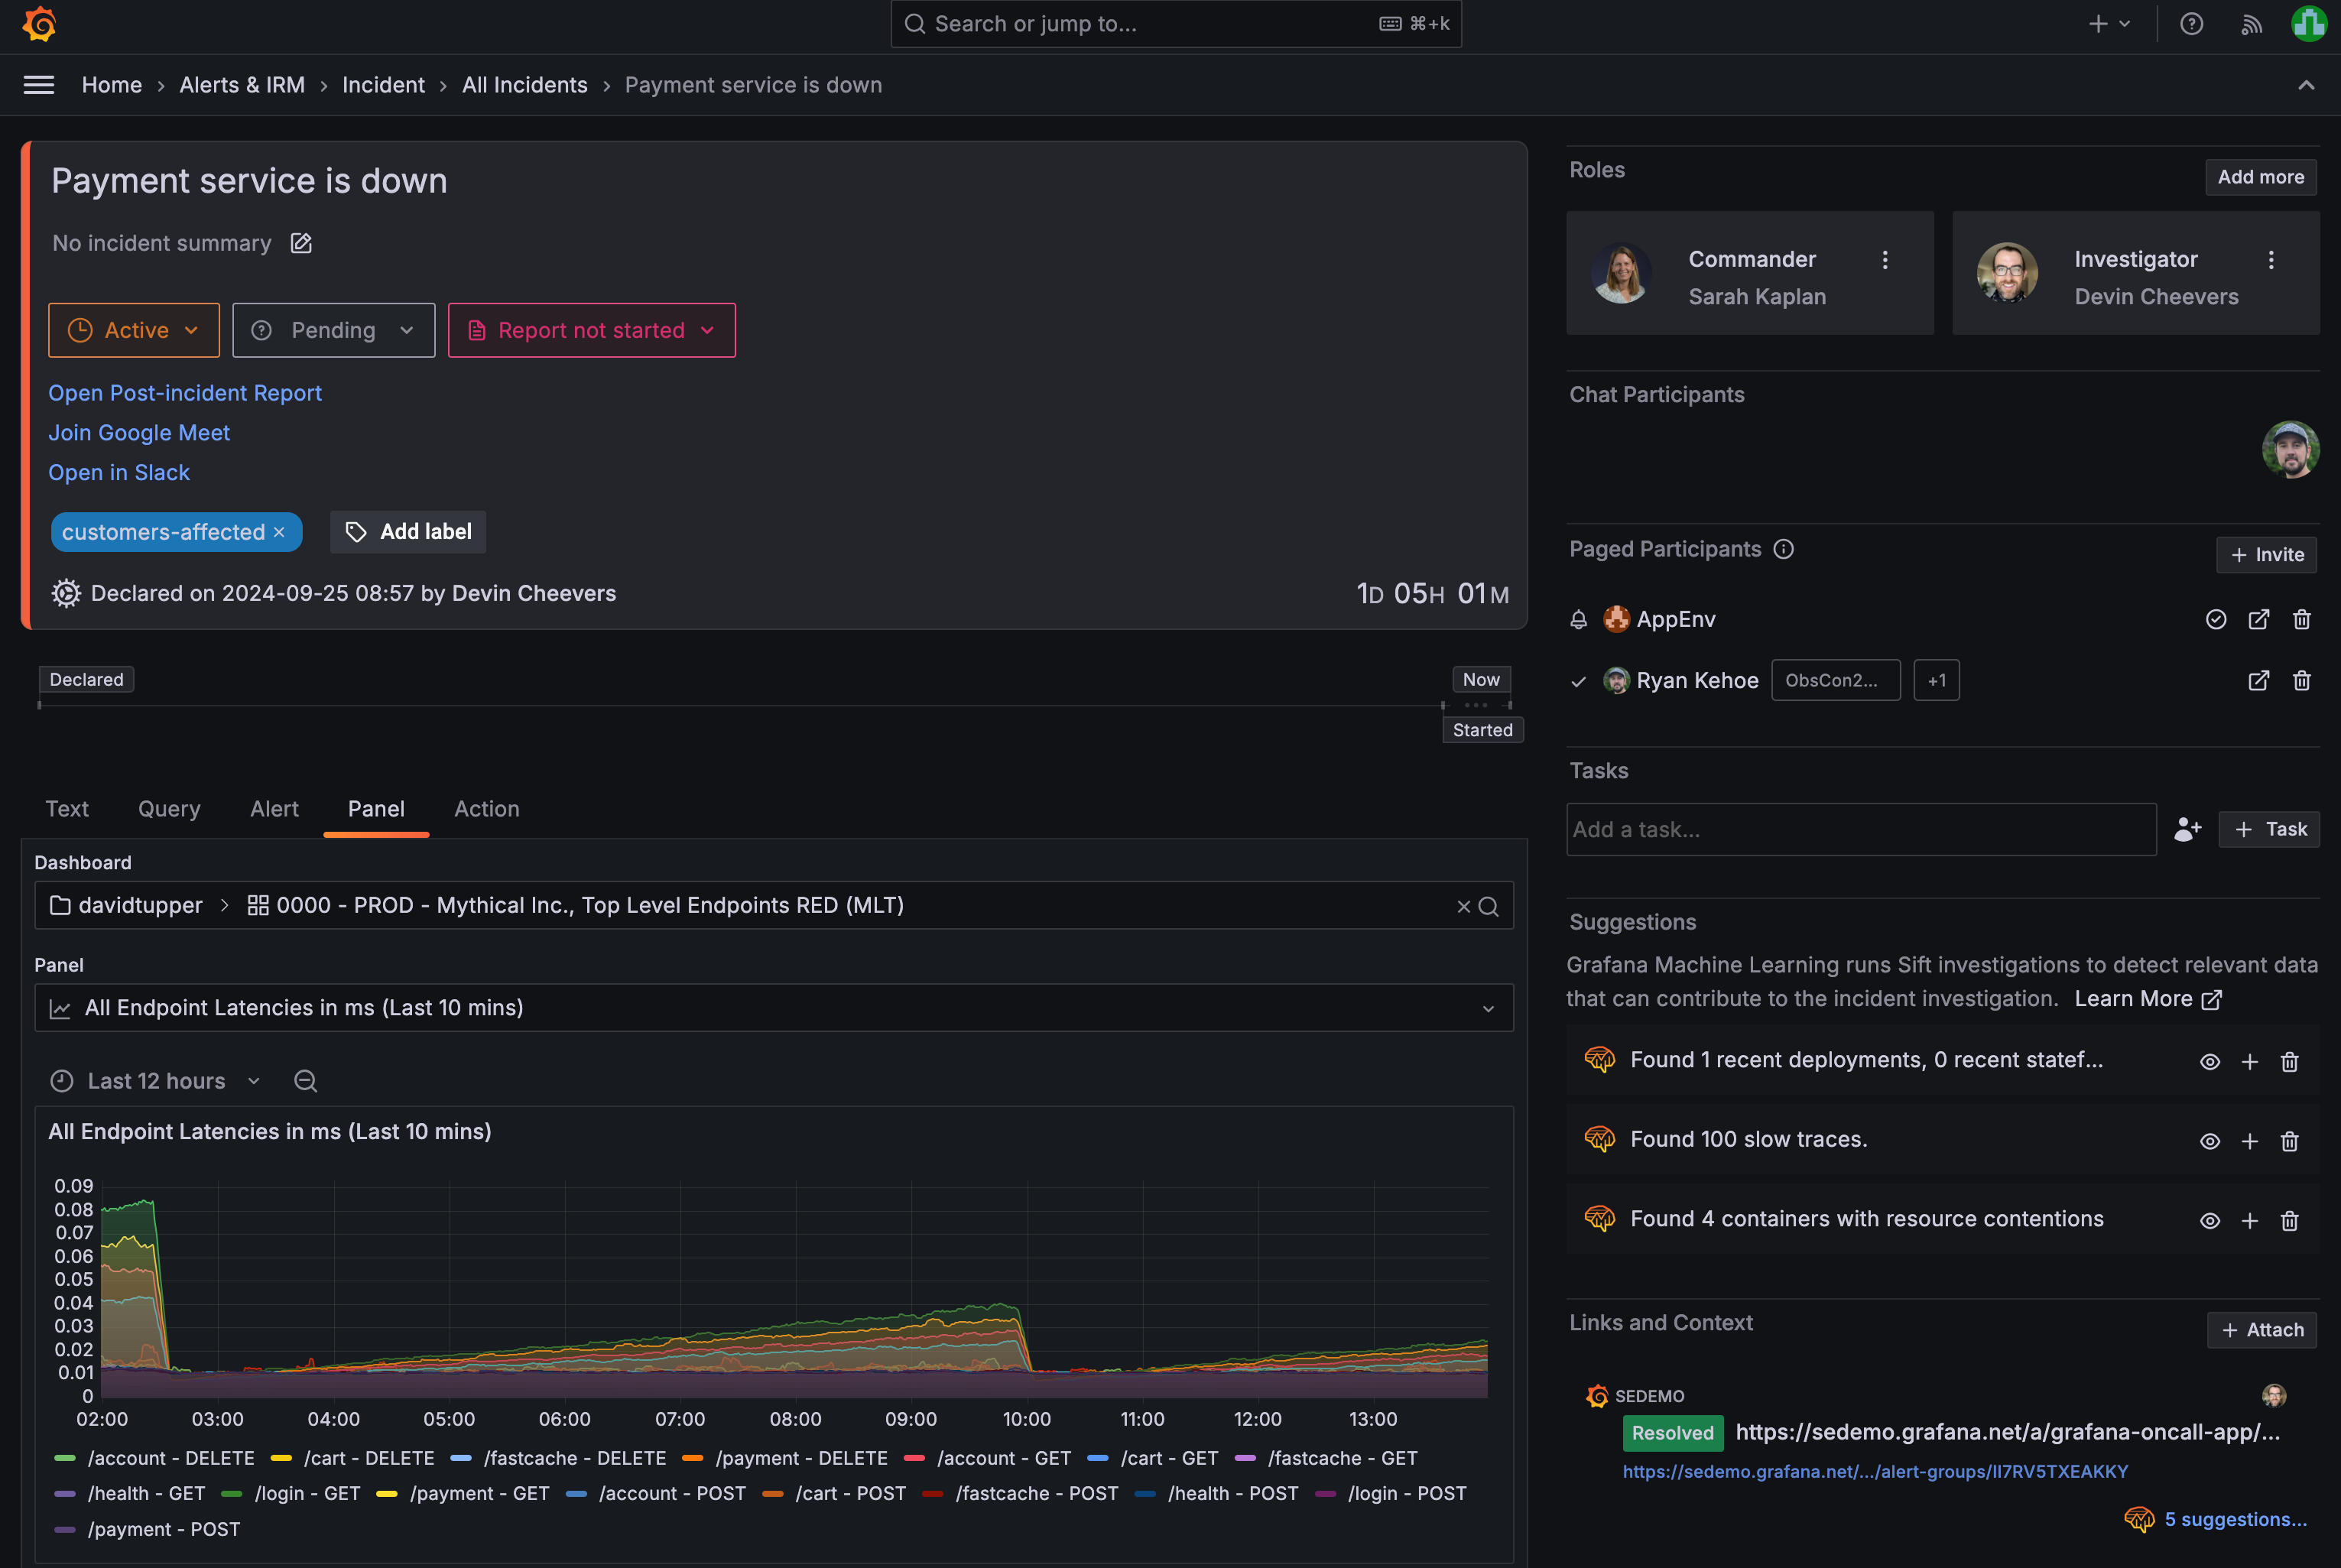
Eliminate confusion before, during, and after incidents
Automate tedious tasks, centralize communication, and get a complete post-incident review record with Grafana Incident.
Only pay for active users
Your bill only gets bigger when engineers actually use Grafana OnCall and/or Grafana Incident.
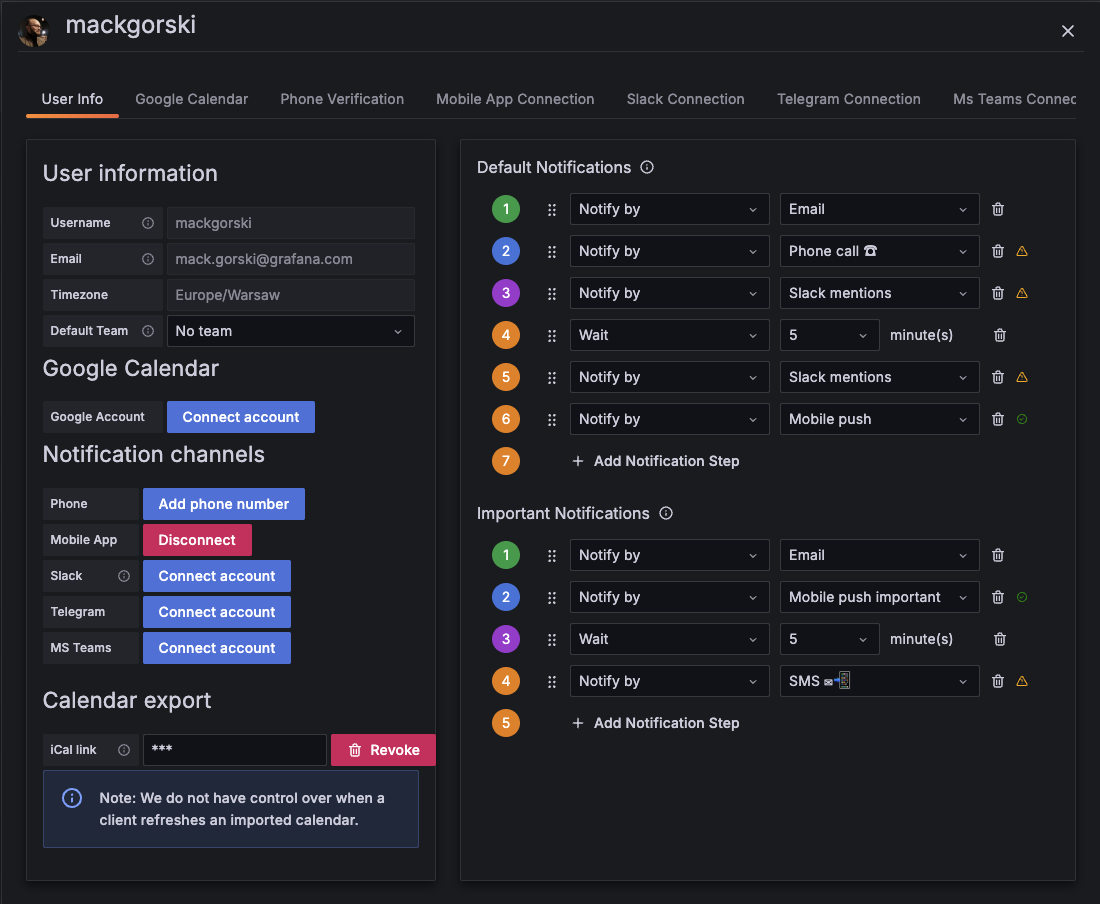
Notify the right people, at the right time
Improve communication and tailor alert notifications so critical information reaches the right team members.
- Deliver customized notifications via Slack, Microsoft Teams, Telegram, SMS, phone calls, email, and more.
- Receive push notifications personalized for your role and responsibilities.
- Use automation to remove blockers and improve response times with templates and multi-step escalation chains.
- Acknowledge, resolve, or escalate incidents from your preferred communication channel.
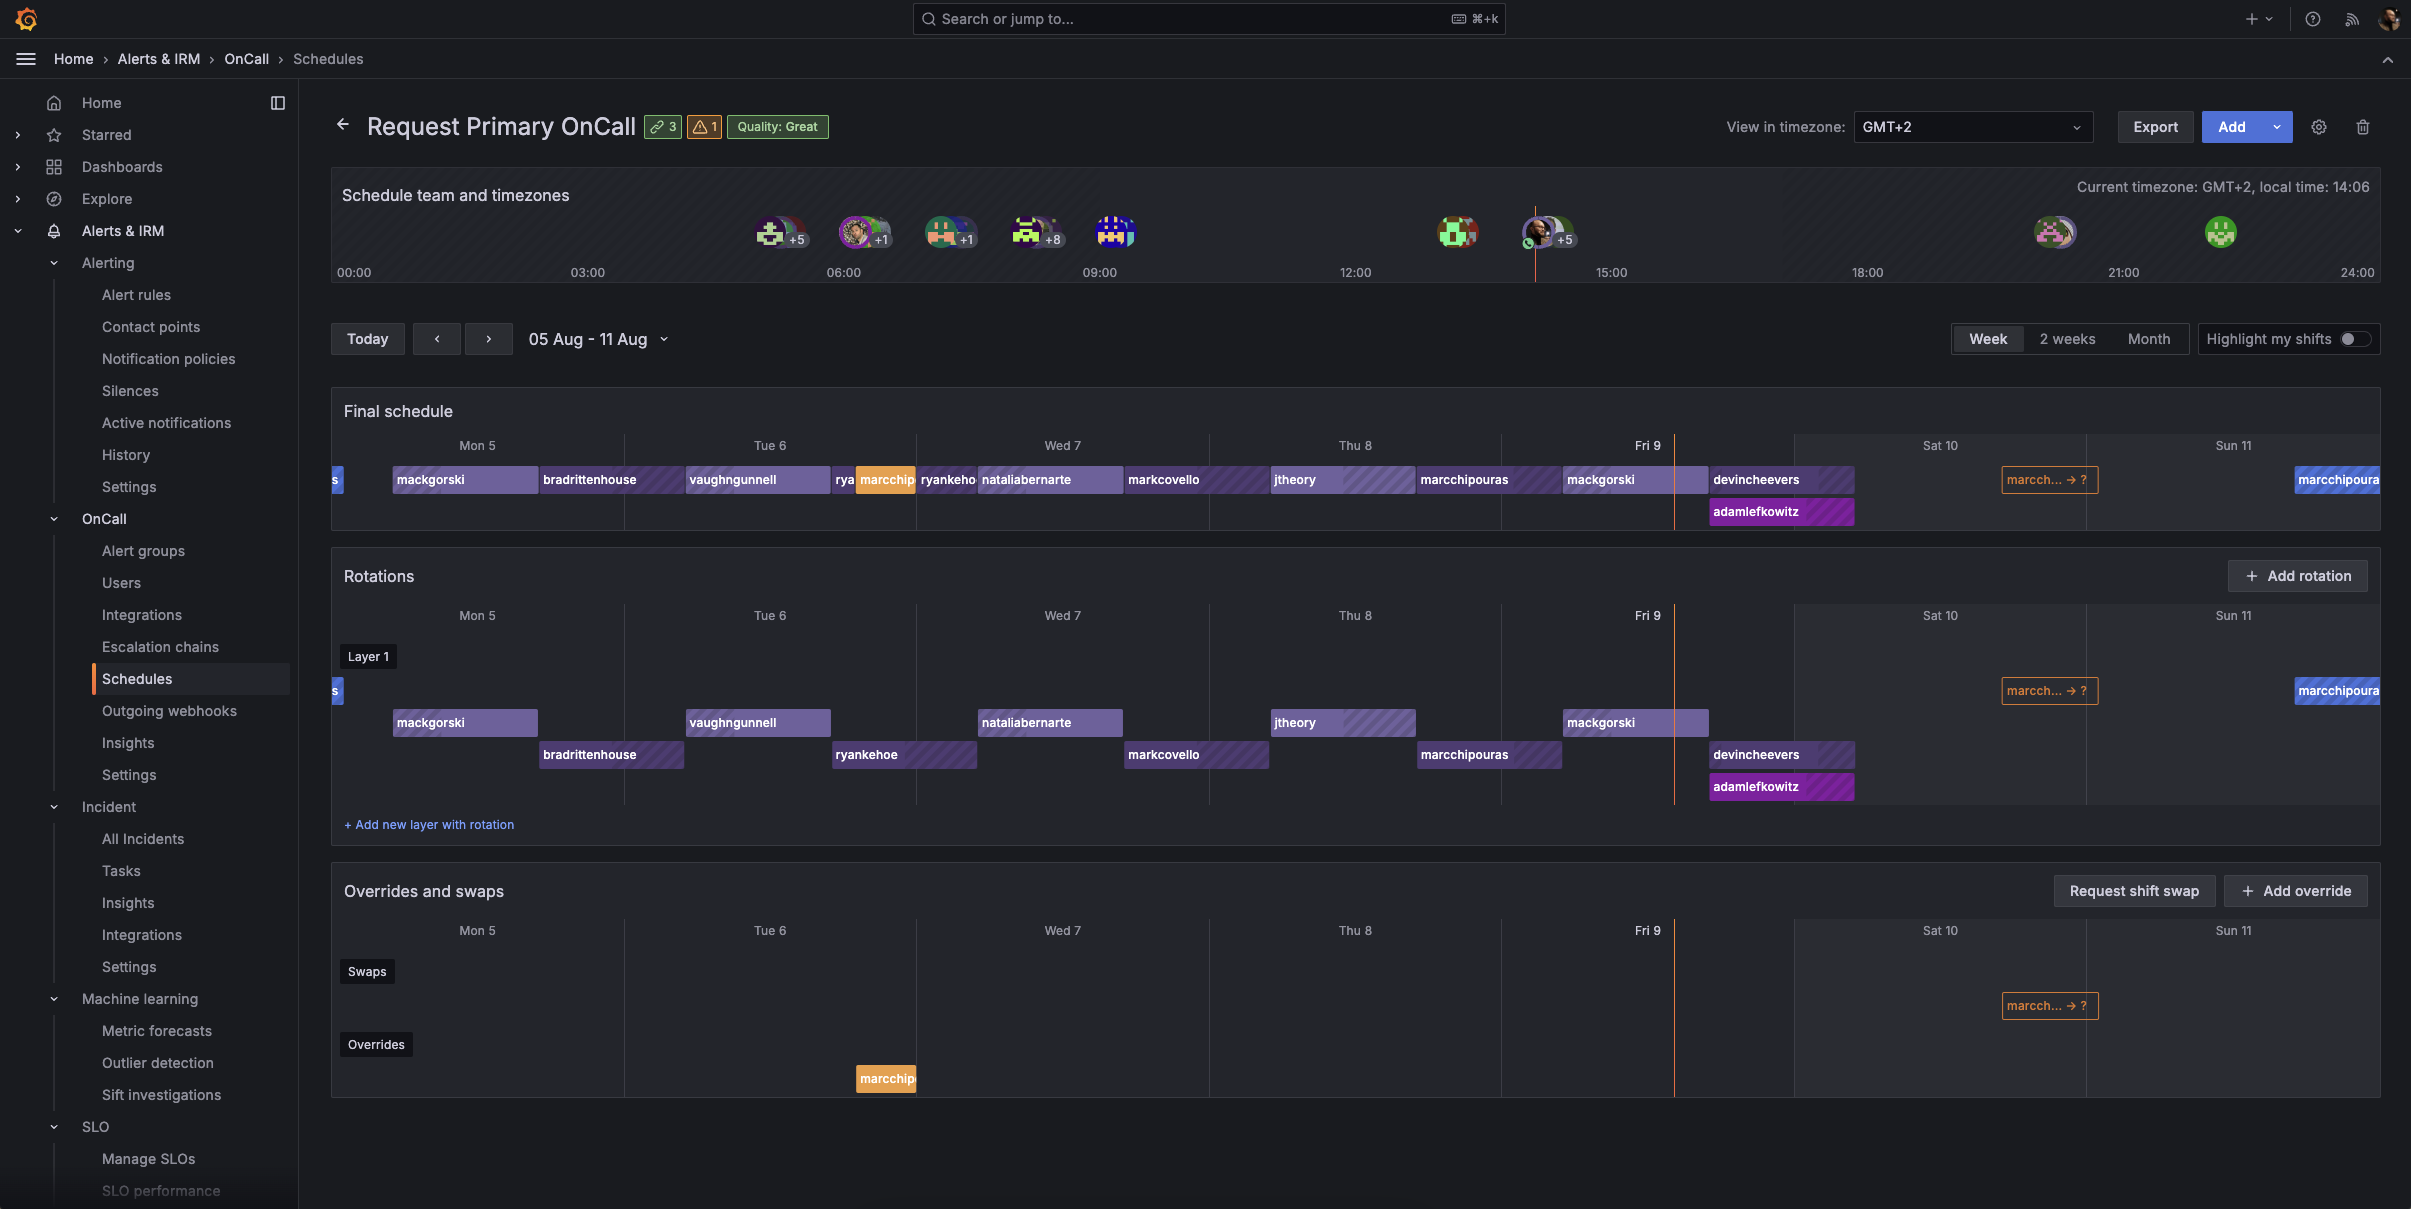
On call, on your terms
Ensure round-the-clock incident response with tools built for distributed teams, by engineers who understand the pressures of on-call shifts.
- Manage schedules via the Grafana UI, Terraform, or iCal; automate shift swaps and out of office events with the Google Calendar integration; and easily factor in time zones, schedule rotations, and more.
- Override “do not disturb” settings for critical emergencies, maintaining operational readiness.
- Easily review rotation details, upcoming shifts, and swap requests from your browser or on the go with the mobile app.
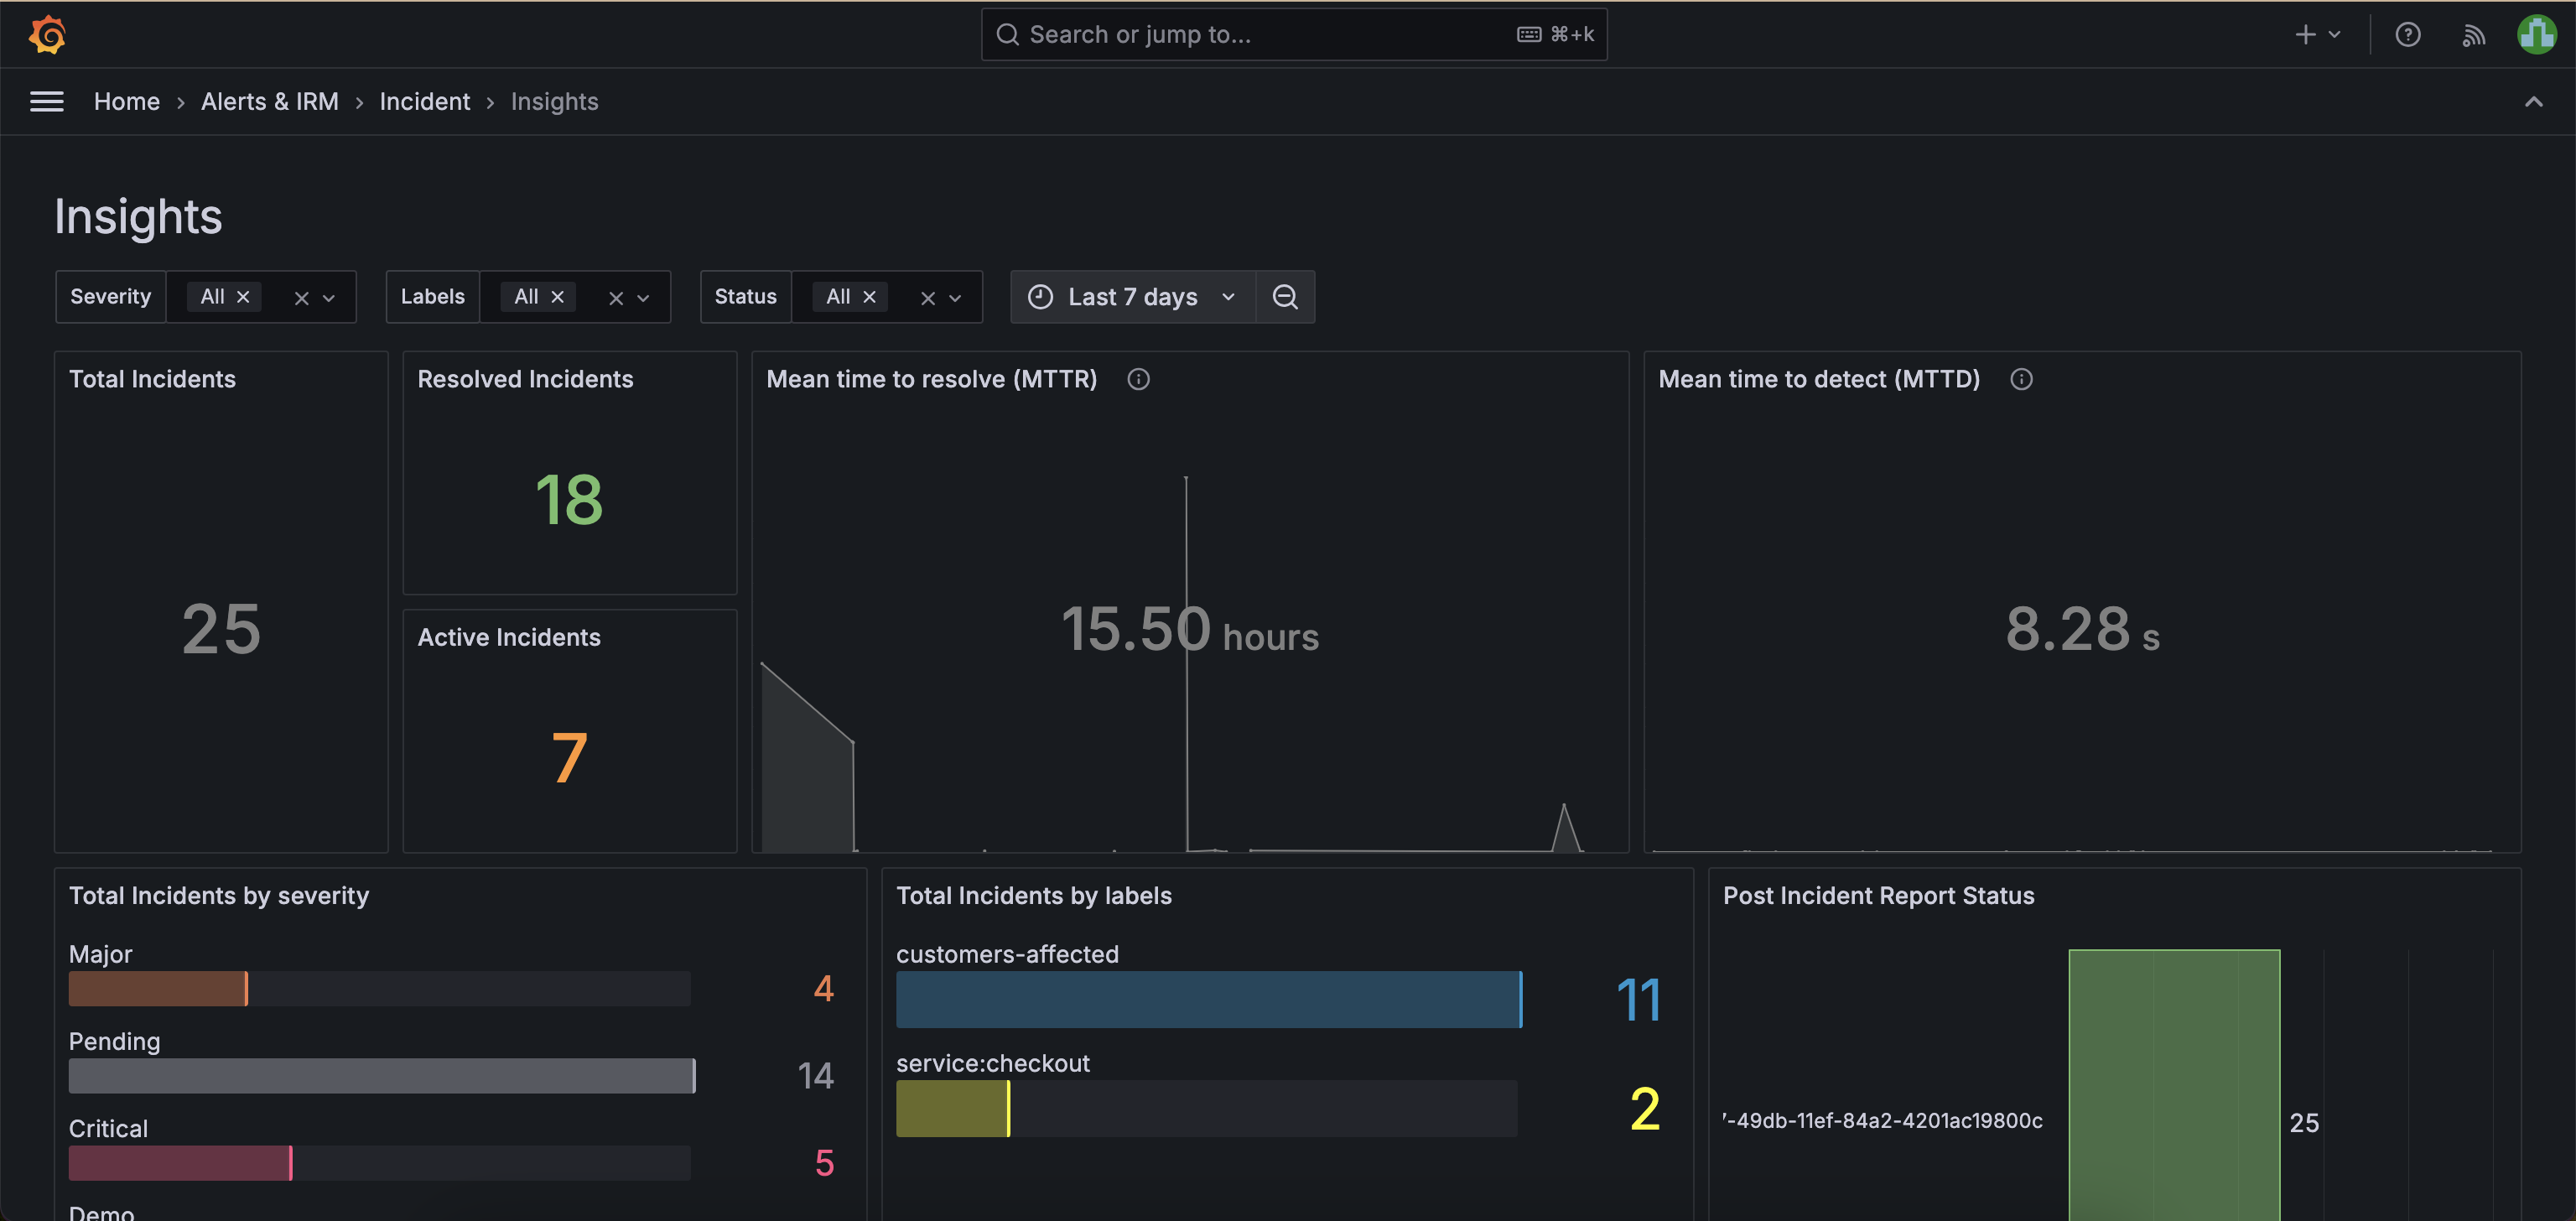
Make data-driven decisions now and in the future
For each event, work with a single source of truth that provides complete incident summaries and helps you make informed choices.
- Get comprehensive timelines to track key actions, decisions, and updates throughout the incident lifecycle.
- Automatically convert timelines into a structured post-incident review document and maintain a centralized, authoritative record of each incident.
- Learn from past incidents by identifying and analyzing bottlenecks and areas for improvement.
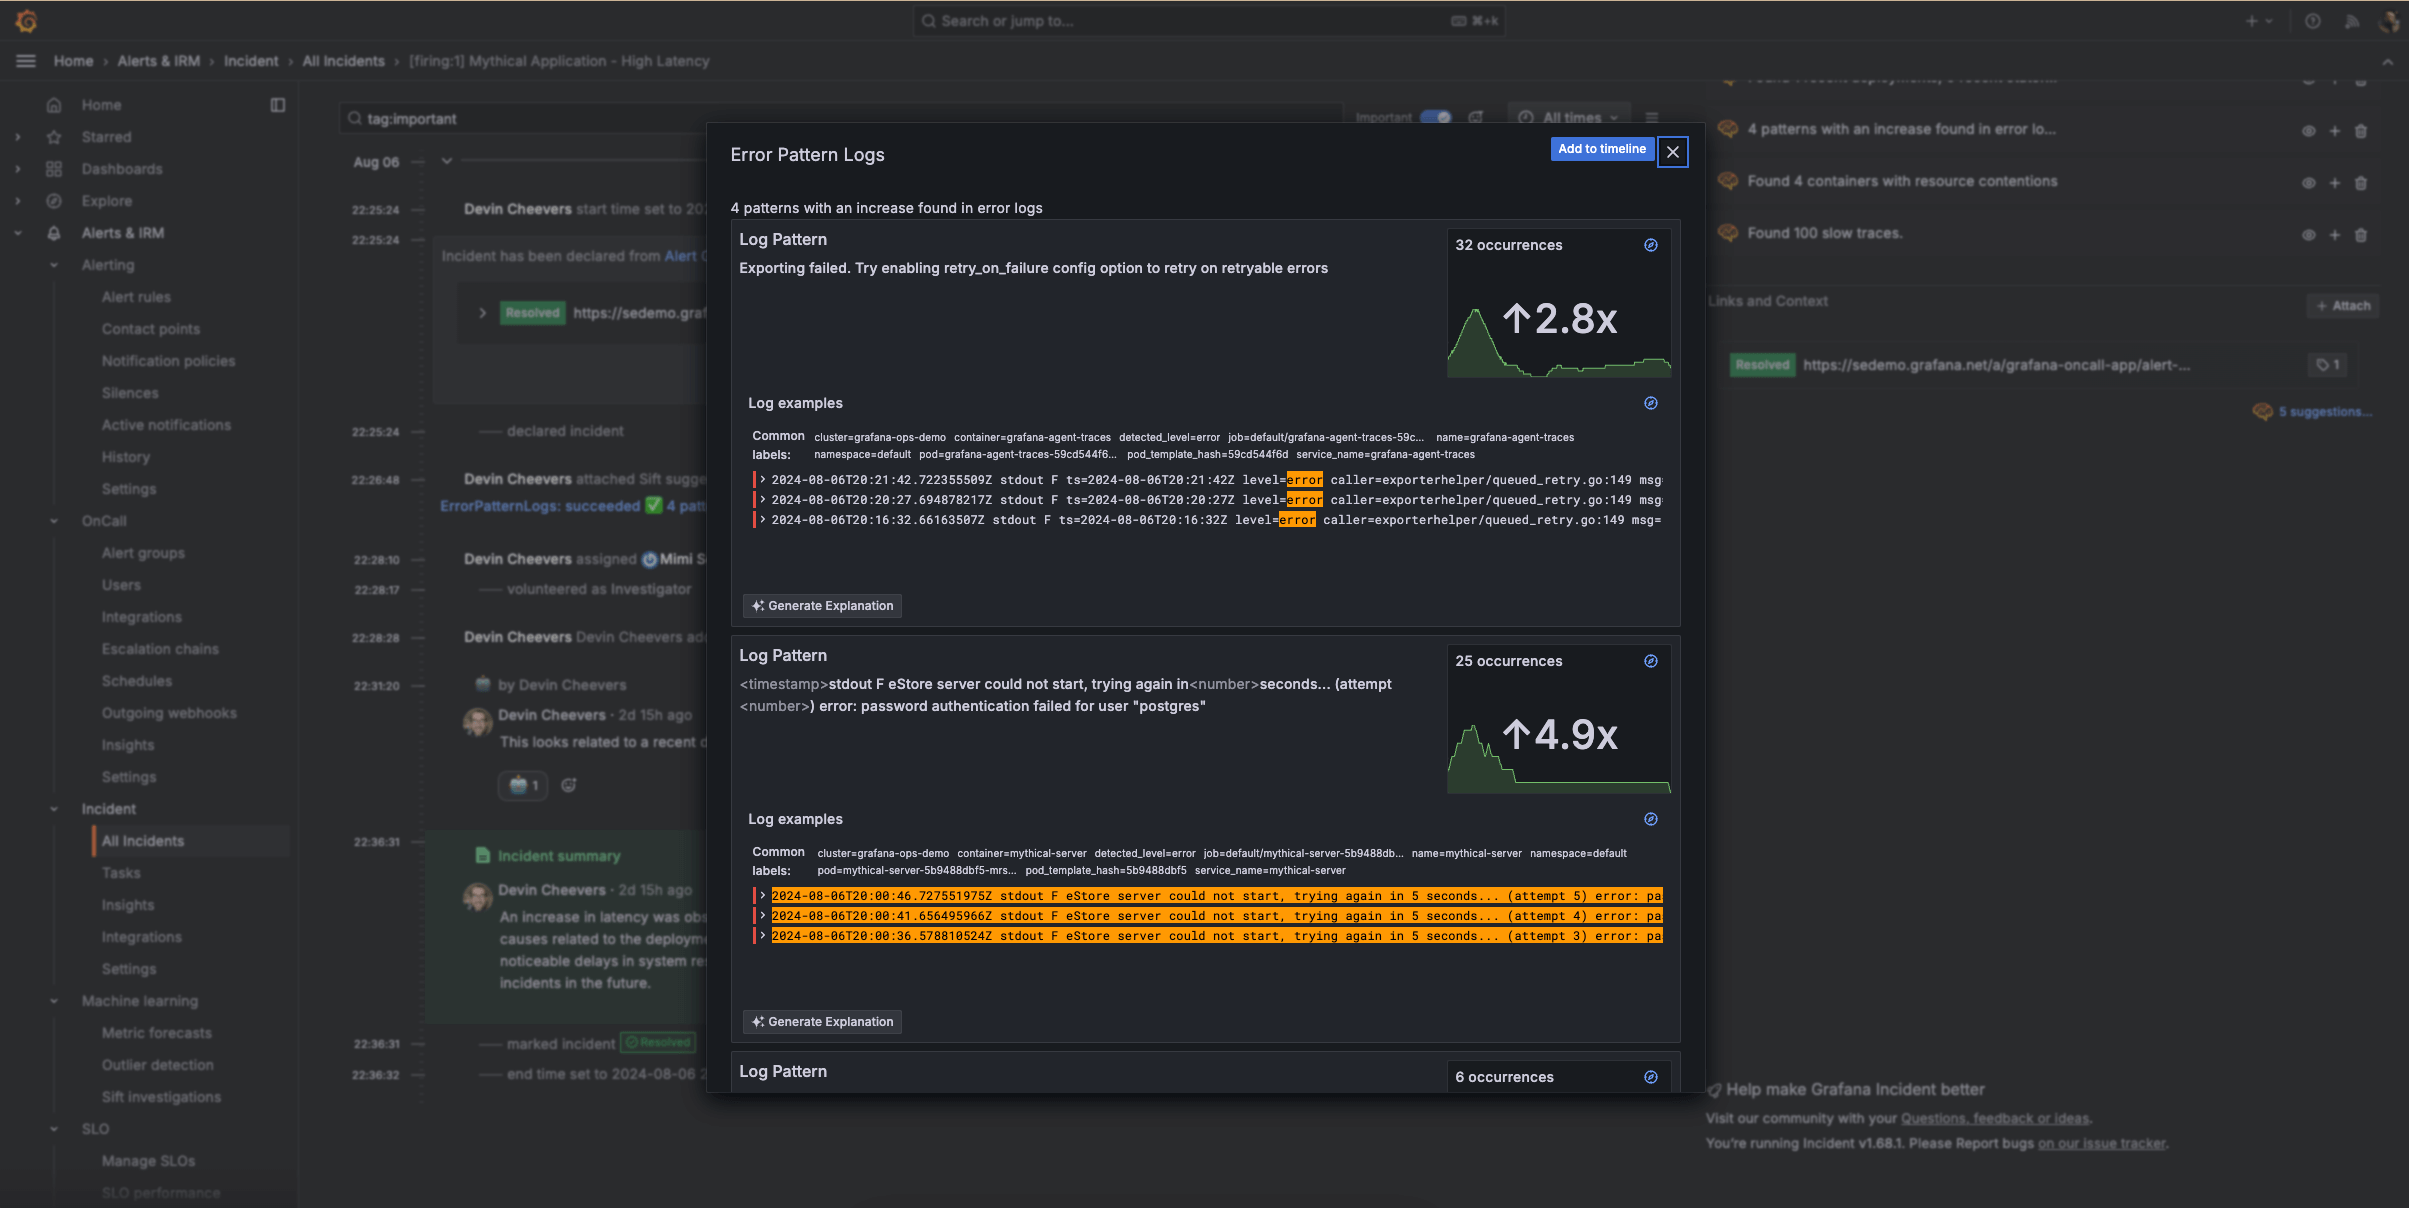
Detect anomalies using machine learning
With Sift, our diagnostic assistant, you can run automated system checks that surface problems quickly and efficiently so you can resolve issues faster.
- Get a holistic view of system health so you can automatically identify anomalies and complex issues before they become major incidents.
- Get incident response up and running faster with automated Sift checks.
- Develop personalized responses over time based on feedback and outcomes.
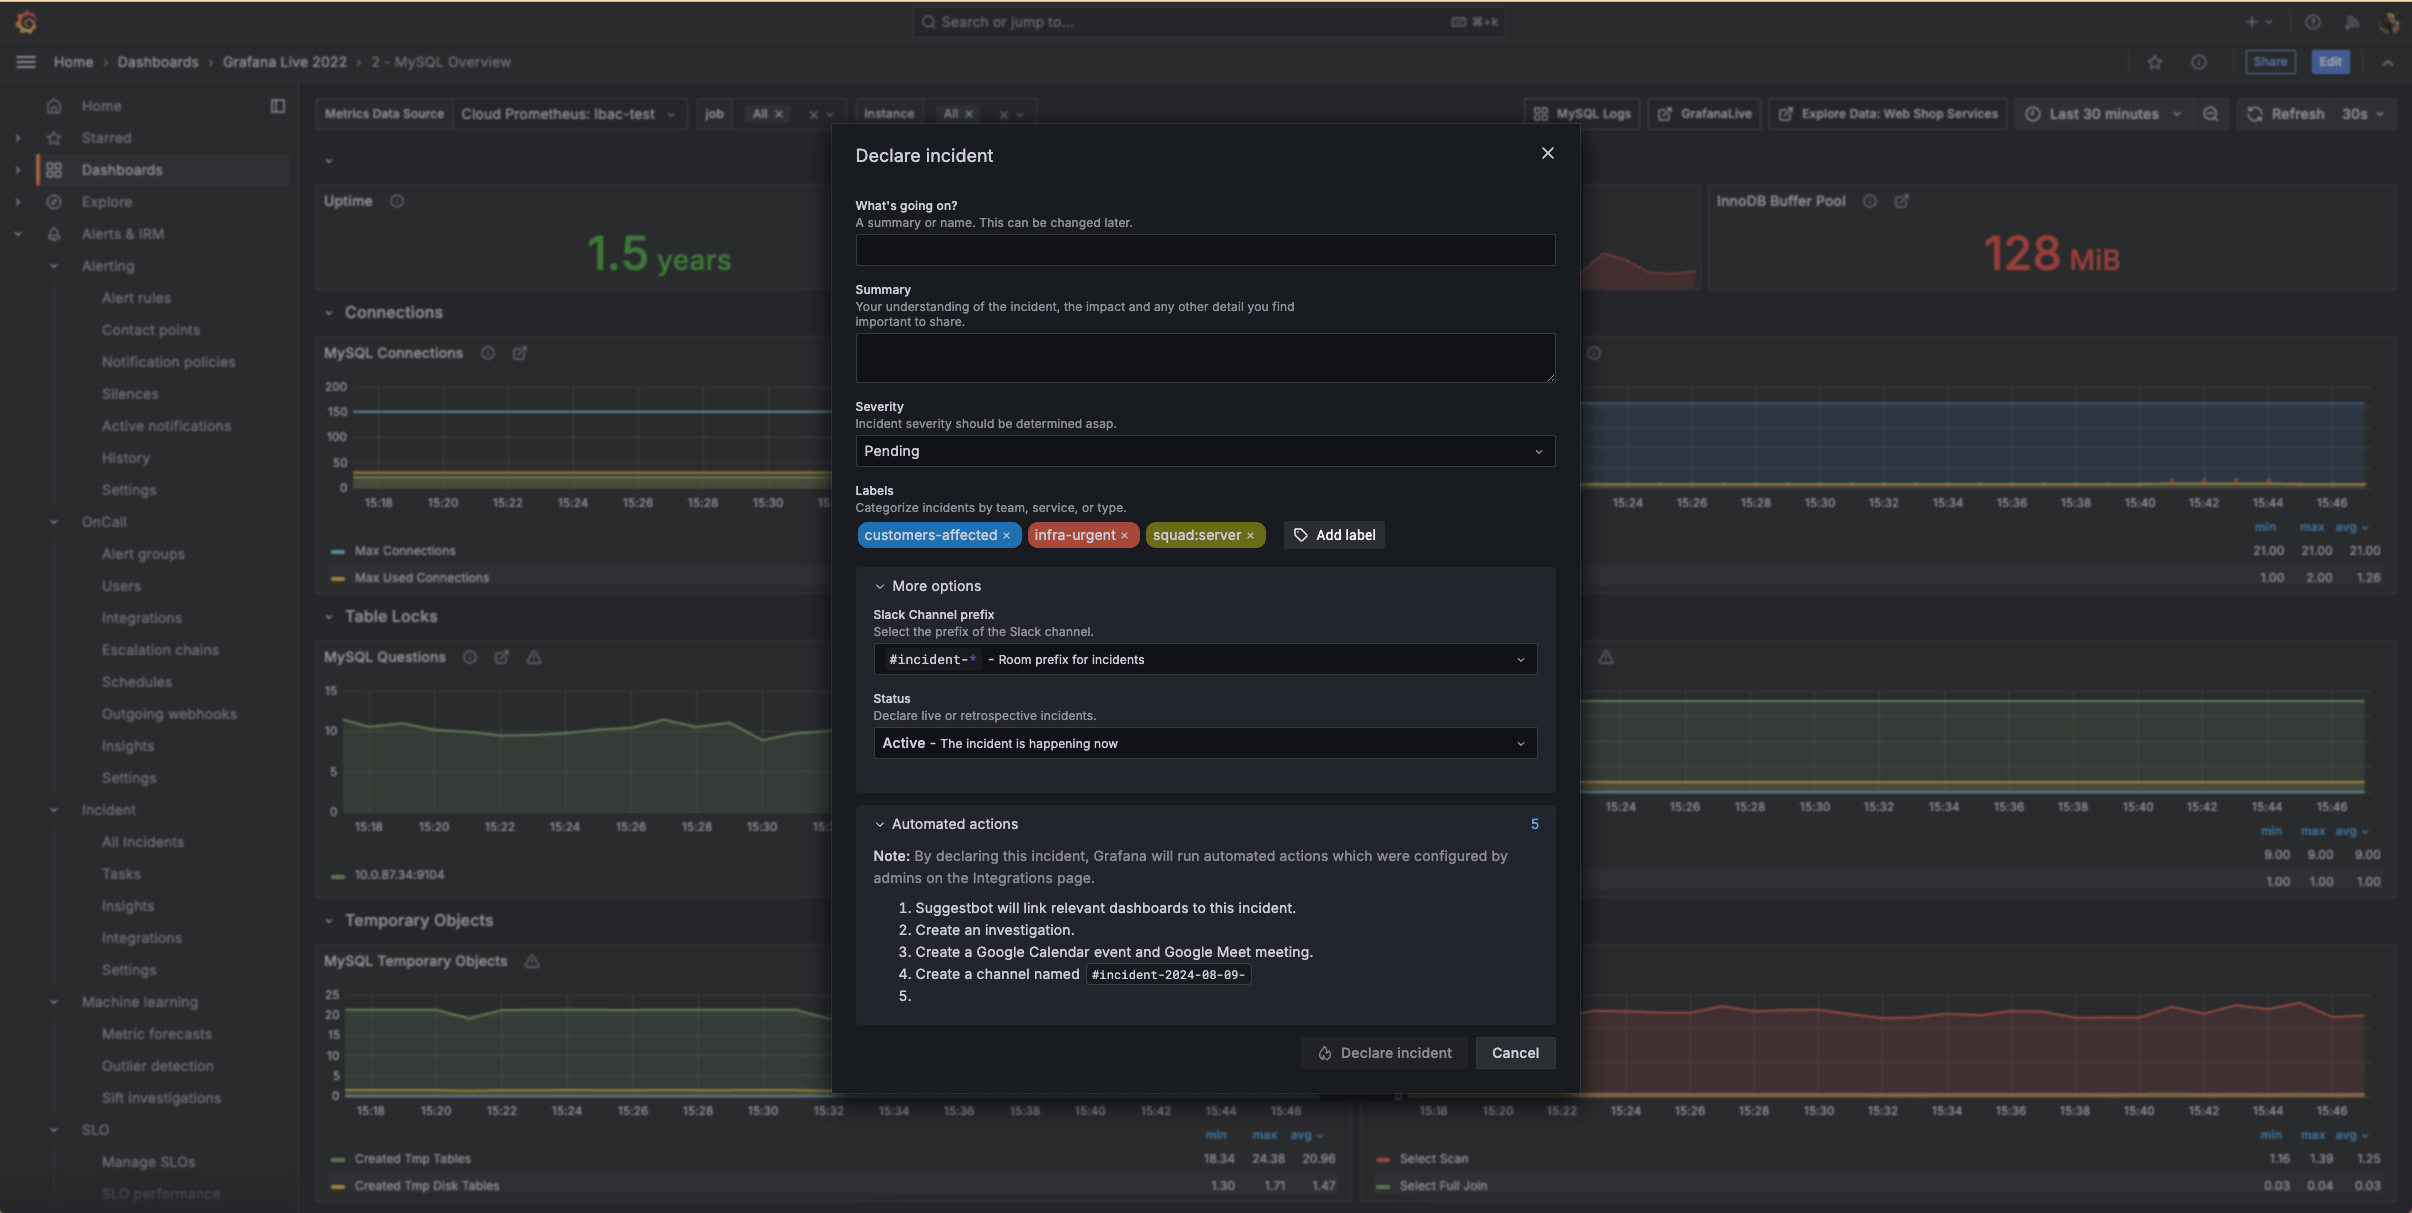
Observability meets IRM
Transition from reactive to proactive incident response in your Grafana Cloud observability stack the moment there is a concerning issue.
- Initiate incidents directly from any Grafana visualization when you spot anomalies or concerning trends.
- Gather data on incident frequency and types to optimize your observability and response strategies.
- Integrate with your favorite ITSM tools to customize your incident response and management workflows, including Jira, ServiceNow, Github, and more.
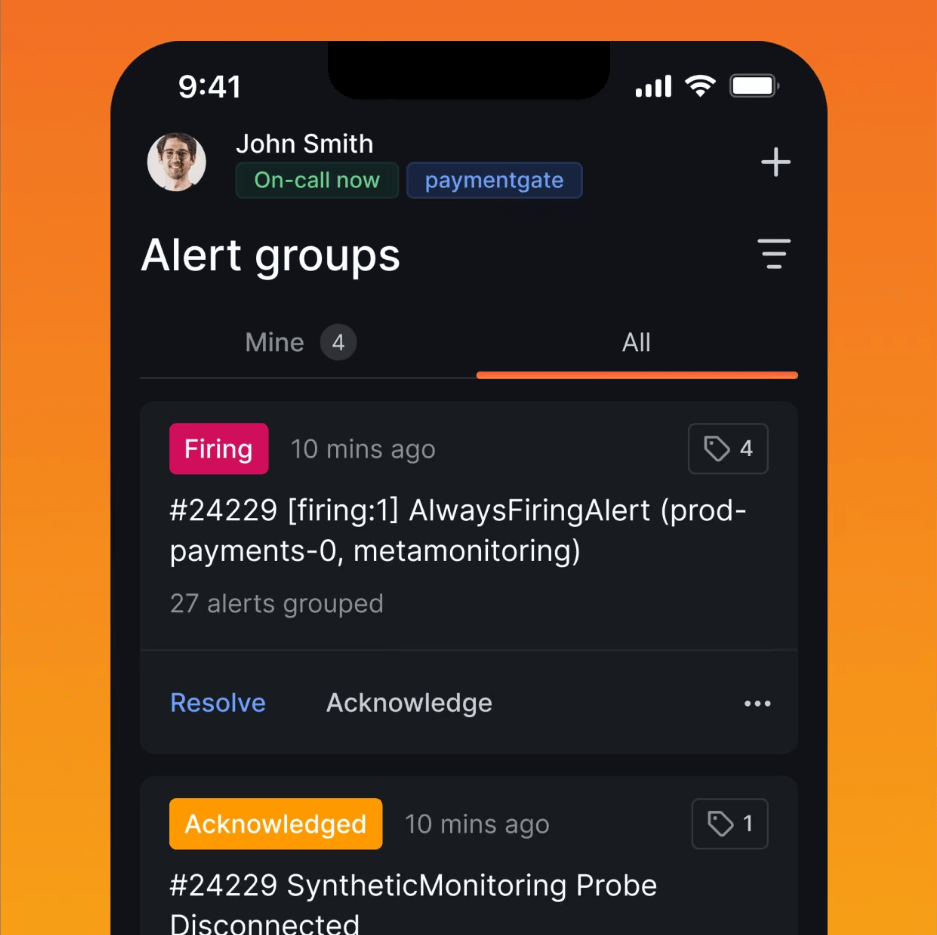
Incident response and management on the go
With the IRM mobile app, you can handle critical situations from anywhere.
Personalized notifications:
- Receive push notifications tailored to your personal preferences.
- Override “do not disturb” settings for critical emergencies.
On-call schedules at your fingertips:
- Review on-call rotation details anytime, anywhere.
- Quickly check upcoming shifts and team availability.
- Easily request shift swaps with your team.
Incident details on demand:
- Acknowledge, respond to, or escalate incidents directly from your mobile device.
- Access comprehensive incident information to make informed decisions.
Get started with incident response and management in Grafana Cloud
2
Connect tools (recommended)
Set up integrations to your favorite apps, such as Slack, where you can add the Grafana Incident chatbot to the relevant channel.
3
Configure notifications
Decide how each user will receive notifications and create escalations.
4
Set up on-call schedules and start declaring incidents
Establish on-call schedules within the UI and declare your first drill incident.
Get Grafana IRM in Grafana Cloud
Cloud FreeNo payment. Ever.
Cloud ProPay as you go
Cloud AdvancedPremium bundle
Helpful resources
Easily connect to more Grafana Cloud tools
Grafana Alerting
Unify alert management across your entire stack with powerful, flexible rules and notifications.
Grafana SLO
Define service level objectives and create error-budget alerts to catch issues before your customers do.