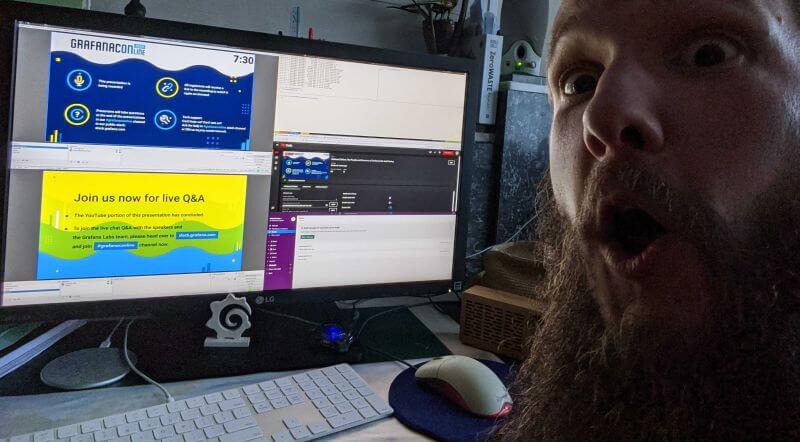
GrafanaCONline recap: Grafana 7.0, Prometheus deep dives, Loki future, electric cars, wine waste, and more
GrafanaCONline wrapped up last Friday, and we were thrilled to have so many of you join the sessions over the past three weeks. Thank you for tuning in, asking questions, chatting on Slack, and generally making our reimagined conference a success.
A big thank you, too, to all the speakers and the Grafanistas behind the scenes who made the magic happen:

If you didn’t get a chance to watch Friday’s sessions (or want to watch them again), here’s what you missed on day 11 of the conference:
Community and documentation
Grafana Labs Senior Technical Writer Diana Payton talked about the need for one source of truth – documentation. Competing sources cause confusion and are extra effort. But the great thing about open source is that our docs are your docs, so if something is wrong or missing, you can file an issue. If you see something that can be improved, you can file a PR and help fix it. The team appreciates any help you are willing to give, and future users with the same question will be grateful.

Watch the full session here.
The business and people of Grafana Labs and closing
Grafana Labs co-founder and CEO Raj Dutt and VP, People Ops Alice Farrell closed GrafanaCONline with their session on the business and people of Grafana Labs. Staying true to the company’s commitment to transparency, Raj shared adoption and revenue numbers, while Alice talked about the culture at the remote-first Grafana Labs.

Watch the full session here.
Conference highlights
If you missed anything or want to watch again, remember all the sessions are available on demand. Here are the highlights:
Opening keynote: Co-founders Raj Dutt and Torkel Ödegaard and VP, Product Tom Wilkie kick off GrafanaCONline.
worldPing: Co-founder and CTO Anthony Woods discusses the future of worldPing.
Fillet your herrings using Grafana: an open source implementation for Industry 4.0: René de Theije talks about using Grafana to monitor real time production results for one of the largest fishery companies in the Netherlands.
Prometheus: What the future holds: Prometheus maintainer Goutham Veeramachaneni discusses what’s ahead for the project.
Strava: the Venn diagram of observability: Strava’s David Worth talks about what observability really means in the era of services architecture, reliability engineering, and container orchestration.
Grafana 7.0: Torkel Ödegaard demos the new release.
Industrial process monitoring: oil and gas industry: Jeremy Blevens and Damien Clark on how Whiting Oil and Gas has changed the way its field assets are managed through Grafana dashboards and alerting.
Nissan Leaf -> Cloud all the things: Senior Software Engineer Ed Welch shows how he used Grafana, Cortex, Loki, and other open source technologies on a $35 Raspberry Pi to improve his driving behavior and driving routes to get the most range out of his all-electric Nissan Leaf.
Slicing Kubernetes: Raspberry Pis, monitoring and chaos: Jonan Scheffler shows how to create a Raspberry Pi-based desktop Kubernetes cluster.
Tanka: Declarative Dashboards for declarative clusters: Malcolm Holmes introduces Tanka, a powerful tool for managing Kubernetes resources using the Jsonnet language.
What’s the bee-weather & how to correct particulate-matter readings (in Grafana, of course): Data artist Matthias Mehldau covers using variables to combine weather records and forecasts to measure a beehive.
Loki future: Maintainers Ed Welch and Cyril Tovena discuss what’s next for the Loki project.
Powerful graph representations in Grafana: Prometheus maintainer Julien Pivotto shares how to visualize different kinds of situations and make them easy to read by using advanced features of Grafana.
Grafana plugins: Grafana Labs Software Engineer Dominik Prokop explains the new packages for plugin developers that were introduced in Grafana 7.0.
Chrome browsing data to Grafana – as you browse: Matti Paksula, CTO at supervisor.com, demonstrates how to get the Chrome browsing data visualized in Grafana in near real time (1s delay) without opening the Devtools at all.
Prometheus rate queries in Grafana: Prometheus maintainer Björn “Beorn” Rabenstein tells you everything you need to know to improve your rate visualizations.
How to get an organization to adopt a central telemetry solution: Bloomberg’s Stig Sorensen reveals how they convinced the 6,000+ engineers at Bloomberg to adopt a centralized telemetry solution built in-house using open source software.
What’s new on Grafana Cloud Graphite and Metrictank: Dieter Plaetinck, Principal Software Engineer at Grafana Labs, covers the major new features on GrafanaCloud Graphite (and Metrictank).
Reducing wine waste with Grafana and machine learning: ML6’s Rebecca Brooke and Jeffrey Hagen describe how they used Grafana and machine learning to reduce wine waste and deliver a 200% ROI for Accolade Wines.
Tell us what you think
We hope you’ve enjoyed our first-ever GrafanaCONline. Please fill out our attendee survey; we would appreciate your feedback!


