Get started with Grafana Alerting - Part 4
Get started with Grafana Alerting - Part 4
The Get started with Grafana Alerting tutorial Part 4 is a continuation of Get started with Grafana Alerting tutorial Part 3.
In this tutorial, you will learn:
- The two types of templates in Grafana Alerting: labels and annotations and notification templates.
- How to configure alert rules with summary and description annotations.
- How to create a notification template that integrates with alert rule annotations.
- How to use a built-in notification template to group and format multiple alert instances.
- How to preview alert notifications by leveraging alert instances in the notification template payload.
Before you begin
There are different ways you can follow along with this tutorial.
Note: Some of the templating features in Grafana Alerting discussed in this tutorial are currently available in Grafana Cloud but have not yet been released to the Open Source (OSS) version.
Grafana Cloud
- As a Grafana Cloud user, you don’t have to install anything. Create your free account.
Continue to how templating works.
Interactive learning environment
- Alternatively, you can try out this example in our interactive learning environment: Get started with Grafana Alerting - Part 4. It’s a fully configured environment with all the dependencies already installed.
Grafana OSS
If you opt to run a Grafana stack locally, ensure you have the following applications installed:
Docker Compose (included in Docker for Desktop for macOS and Windows)
Set up the Grafana stack (OSS users)
To demonstrate the observation of data using the Grafana stack, download and run the following files.
Clone the tutorial environment repository.
git clone https://github.com/grafana/tutorial-environment.gitChange to the directory where you cloned the repository:
cd tutorial-environmentRun the Grafana stack:
docker compose up -dThe first time you run
docker compose up -d, Docker downloads all the necessary resources for the tutorial. This might take a few minutes, depending on your internet connection.Note
If you already have Grafana, Loki, or Prometheus running on your system, you might see errors, because the Docker image is trying to use ports that your local installations are already using. If this is the case, stop the services, then run the command again.
How templating works
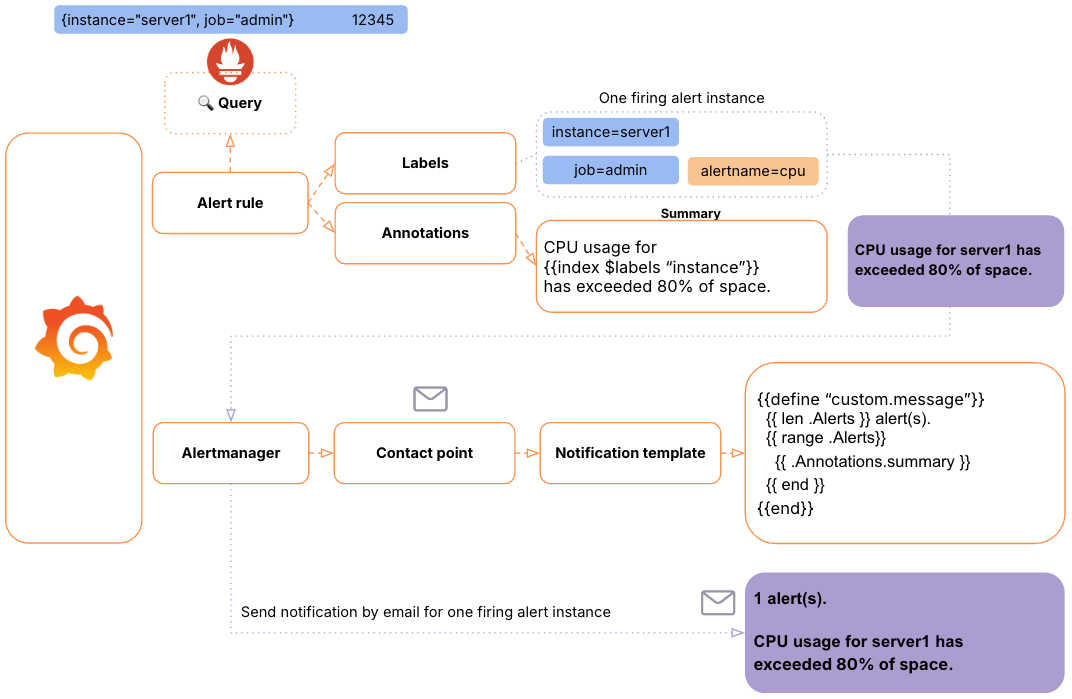
In Grafana, you can use templates to dynamically pull in specific data about the alert rule. This results in more flexible and informative alert notification messages. You can template either alert rule labels and annotations, or notification templates. Both use the Go template language.
Templating alert rule labels and annotations
Labels and annotations are key fields where templates are applied. One of the main advantages of using templating in annotations is the ability to incorporate dynamic data from queries, allowing alerts to reflect real-time information relevant to the triggered condition. By using templating in annotations, you can customize the content of each alert instance, such as including instance names and metric values, so the notification becomes more informative.
Notification templates
The real power of templating lies in how it helps you format notifications with dynamic alert data. Notification templates let you pull in details from annotations to create clear and consistent messages. They also make it simple to reuse the same format across different contact points, saving time and effort.
Notification templates allow you to customize how information is presented in each notification. For example, you can use templates to organize and format details about firing or resolved alerts, making it easier for recipients to understand the status of each alert at a glance—all within a single notification.
This particular notification template pulls in summary and description annotations for each alert instance and organizes them into separate sections, such as “firing” and “resolved.” This way, instead of getting a long list of individual alert notifications, users can receive one well-structured message with all the relevant details grouped together.
This approach is helpful when you want to reduce notification noise, especially in situations where multiple instances of an alert are firing at the same time (e.g., high CPU usage across several instances). You can leverage templates to create a unified, easy-to-read notification that includes all the pertinent details.
Step 1: Template labels and annotations
Now that we’ve introduced how templating works, let’s move on to the next step. We guide you through creating an alert rule with a summary and description annotation. In doing so, we incorporate CPU usage and instance names, which we later use in our notification template.
Create an alert rule
Sign in to Grafana:
- Grafana Cloud users: Log in via Grafana Cloud.
- OSS users: Go to http://localhost:3000.
Create an alert rule that includes a summary and description annotation:
- Navigate to Alerts & IRM > Alerting > Alert rules.
- Click + New alert rule.
- Enter an alert rule name. Name it
High CPU usage
Define query an alert condition section:
Select TestData data source from the drop-down menu.
TestData is included in the demo environment. If you’re working in Grafana Cloud or your own local Grafana instance, you can add the data source through the Connections menu.
From Scenario select CSV Content.
Copy in the following CSV data:
region,cpu-usage,service,instance
us-west,88,web-server-1,server-01
us-west,81,web-server-1,server-02
us-east,79,web-server-2,server-03
us-east,52,web-server-2,server-04
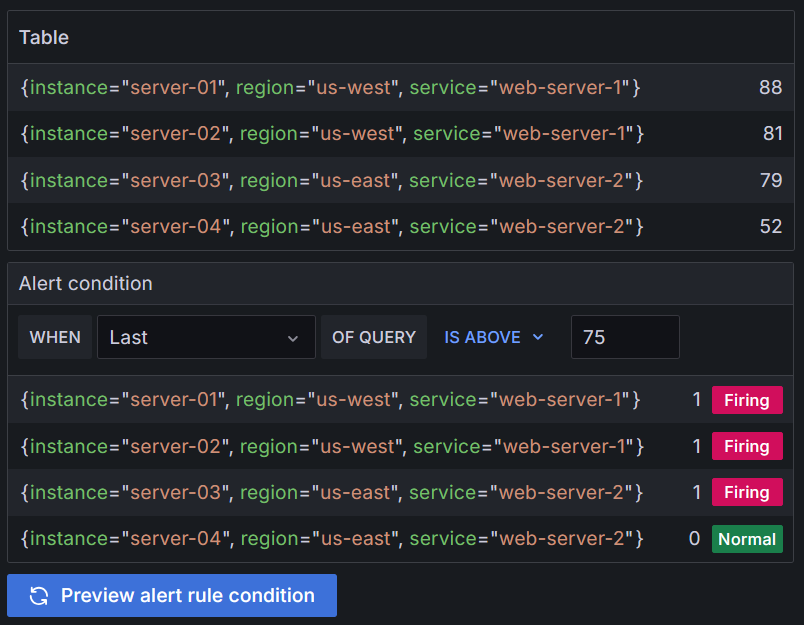
This dataset simulates a data source returning multiple time series, with each time series generating a separate alert instance.
Alert condition section:
- Keep Last as the value for the reducer function (
WHEN), and75as the threshold value, representing CPU usage above 75% .This is the value above which the alert rule should trigger. - Click Preview alert rule condition to run the queries.
It should return 3 series in Firing state, and 1 in Normal state.
![Preview of a query returning alert instances Preview of a query returning alert instances]()
Preview of a query returning alert instances - Keep Last as the value for the reducer function (
Add folders and labels section:
In Folder, click + New folder and enter a name. For example:
System metrics. This folder contains our alert rules.Note: while it’s possible to template labels here, in this tutorial, we focus on templating the summary and annotations fields instead.
Set evaluation behaviour section:
- In the Evaluation group and interval, repeat the above step to create a new evaluation group. Name it
High usage. - Choose an Evaluation interval (how often the alert will be evaluated). Choose
1m. - Set the pending period to 0s (zero seconds), so the alert rule fires the moment the condition is met (this minimizes the waiting time for the demonstration.).
- In the Evaluation group and interval, repeat the above step to create a new evaluation group. Name it
Configure notifications section:
Select who should receive a notification when an alert rule fires.
- Select a Contact point. If you don’t have any contact points, click View or create contact points.
Configure notification message section:
In this step, you’ll configure the summary and description annotations to make your alert notifications informative and easy to understand. These annotations use templates to dynamically include key information about the alert.
Summary annotation: Enter the following code as the value for the annotation.:
{{- "\n" -}}
Instance: {{ index $labels "instance" }}
{{- "\t" -}} Usage: {{ index $values "A"}}%{{- "\n" -}}
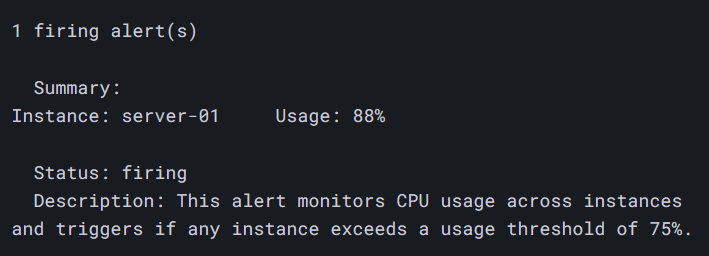
This template automatically adds the instance name (from the $labels data) and its current CPU usage (from $values[“A”]) into the alert summary.
\t: Adds a tab space between the instance name and the value. And,\n: Inserts a new line after the value.Output example:
server-01 88This output helps you quickly see which instance is affected and its usage level.
Optional: Add a description to help the on-call engineer to better understand what the alert rule is about. Eg. This alert monitors CPU usage across instances and triggers if any instance exceeds a usage threshold of 75%.
Click Save rule and exit.
Now that we’ve configured an alert rule with dynamic templates for the summary annotation, the next step is to customize the alert notifications themselves. While the default notification message includes the summary annotation and works well, it can often be too verbose.
To make our alert notifications more concise and tailored to our needs, we’ll create a custom notification template that references the summary annotation we just set up. Notification templates are especially useful because they can be reused across multiple contact points, ensuring consistent alert messages.
Step 2: Template notifications
In this step, we use a built-in notification template to format alert notifications in a clear and organized way. Notification templates allow us to customize the structure of alert messages, making them easier to read and more relevant.
Without a notification template, the alert messages would include the default Grafana formatting (default.message, see image above).
Adding a notification template:
- Navigate to Alerts & IRM > Alerting > Contact points.
- Select the Notification Templates tab.
- Click + Add notification template group.
- Enter a name. E.g
instance-cpu-summary. - From the Add example dropdown menu, choose
Print firing and resolved alerts.
This template prints out alert instances into two sections: firing alerts and resolved alerts, and includes only the key details for each. In addition, it adds our summary and description annotations.
{{- /* Example displaying firing and resolved alerts separately in the notification. */ -}}
{{- /* Edit the template name and template content as needed. */ -}}
{{ define "custom.firing_and_resolved_alerts" -}}
{{ len .Alerts.Resolved }} resolved alert(s)
{{ range .Alerts.Resolved -}}
  {{ template "alert.summary_and_description" . -}}
{{ end }}
{{ len .Alerts.Firing }} firing alert(s)
{{ range .Alerts.Firing -}}
  {{ template "alert.summary_and_description" . -}}
{{ end -}}
{{ end -}}
{{ define "alert.summary_and_description" }}
  Summary: {{.Annotations.summary}}
  Status: {{ .Status }}
  Description: {{.Annotations.description}}
{{ end -}}
Note
Your notification template name (
{{define "<NAME>"}}) must be unique. You cannot have two templates with the same name in the same notification template group or in different notification template groups.
Here’s a breakdown of the template:
{{ define "custom.firing_and_resolved_alerts" -}}section: Displays the number of resolved alerts and their summaries, using thealert.summary_and_descriptiontemplate to include the summary, status, and description for each alert..Alerts.Firingsection: Similarly lists the number of firing alert instances and their details.alert.summary_and_description: This sub-template pulls the summary annotation you configured earlier.
In the Preview area, you can see a sample of how the notification would look. Since we’ve already created our alert rule, you can take it a step further by previewing how an actual alert instance from your rule would appear in the notification.
Click Edit payload.
Click Use existing alert instance.
You should see our alert rule listed on the left.
Click the alert rule.
Select an instance.
Click Add alert data to payload.
The alert instance is added to the bottom of the preview.
![Preview of an alert instance in a notification template Preview of an alert instance in a notification template]()
Preview of an alert instance in a notification template Click Save.
With the notification template ready, the next step is to apply it to your contact point to see it in action.
Apply the template to your contact point
- Apply the template to your contact point.
- Navigate to Alerts & IRM > Alerting > Contact points.
- Edit your contact point.
- Optional [email] settings section:
- Click Edit Message.
- Under Select notification template, search
custom.firing_and_resolved_alerts. - Click Save.
- Save your contact point.
Receiving notifications
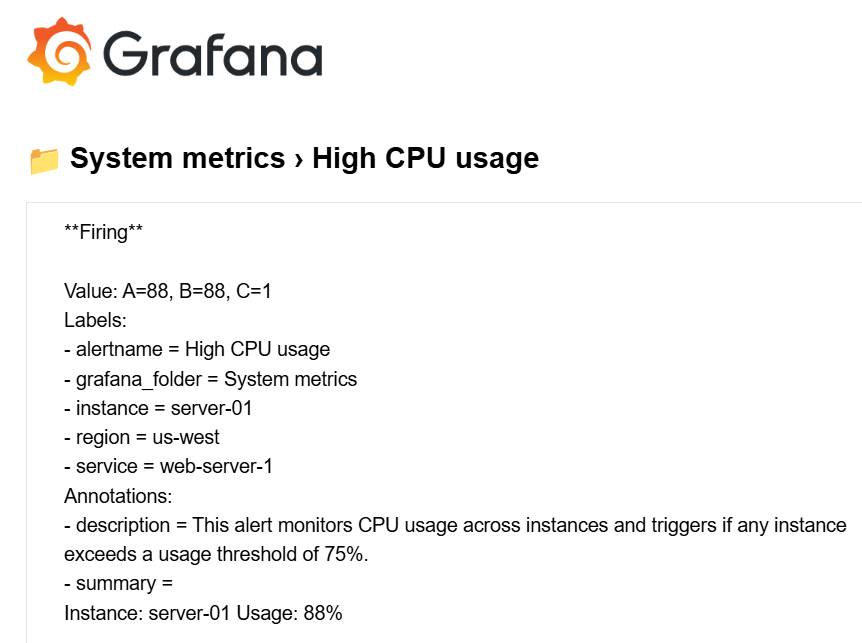
Now that the template has been applied to the contact point, you should receive notifications in the specified contact point.
Note: you might need to pause the alert rule evaluation and resume it to trigger the notification.
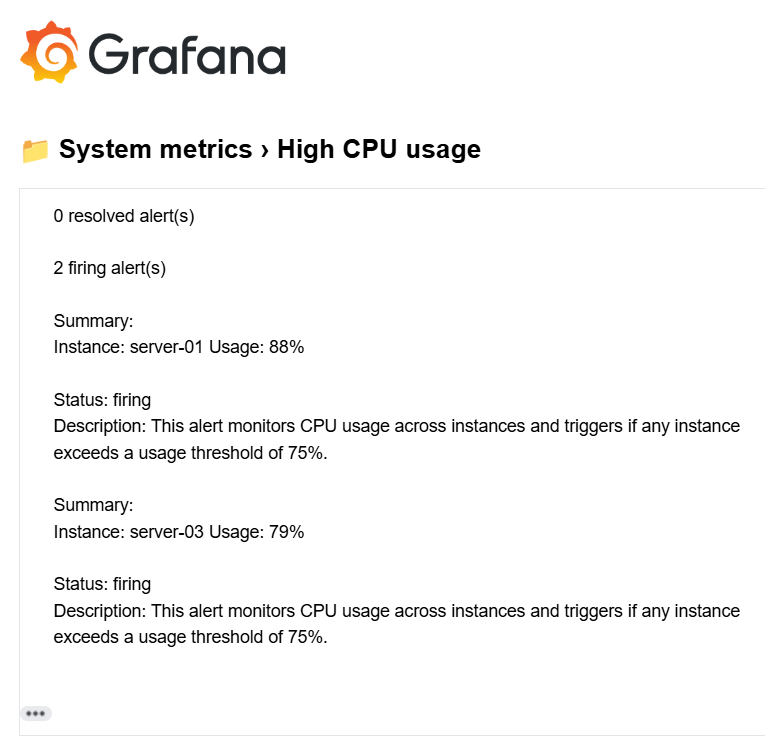
In the screen capture, you can see how the notification template groups the alert instances into two sections: firing alerts and resolved alerts. Each section includes only the key details for each alert, ensuring the message remains concise and focused. Additionally, the summary and description annotations we created earlier are included, providing affected instance and CPU usage.
Conclusion
In this tutorial, we learned how to use templating in Grafana Alerting to create dynamic and actionable alert notifications. We explored how to configure alert rules with annotations, design custom notification templates, and apply them to contact points to enhance the clarity and efficiency of alert messages. By organizing alert instances into concise notifications, you can reduce noise and ensure on-call engineers quickly understand and address critical issues.
To deepen your understanding of Grafana’s templating, explore the following resources:
Overview of the functions and operators used in templates:
Notification template reference: Lists the data available for use in notification templates and explores specific functions.
Alert rule template reference: Covers the specifics of creating dynamic labels and annotations for alert rules using elements such as variables and functions.
Learn more in Grafana Alerting Part 5
Tip
In Get started with Grafana Alerting - Part 5 you learn how to dynamically route alerts and link them to dashboards.

