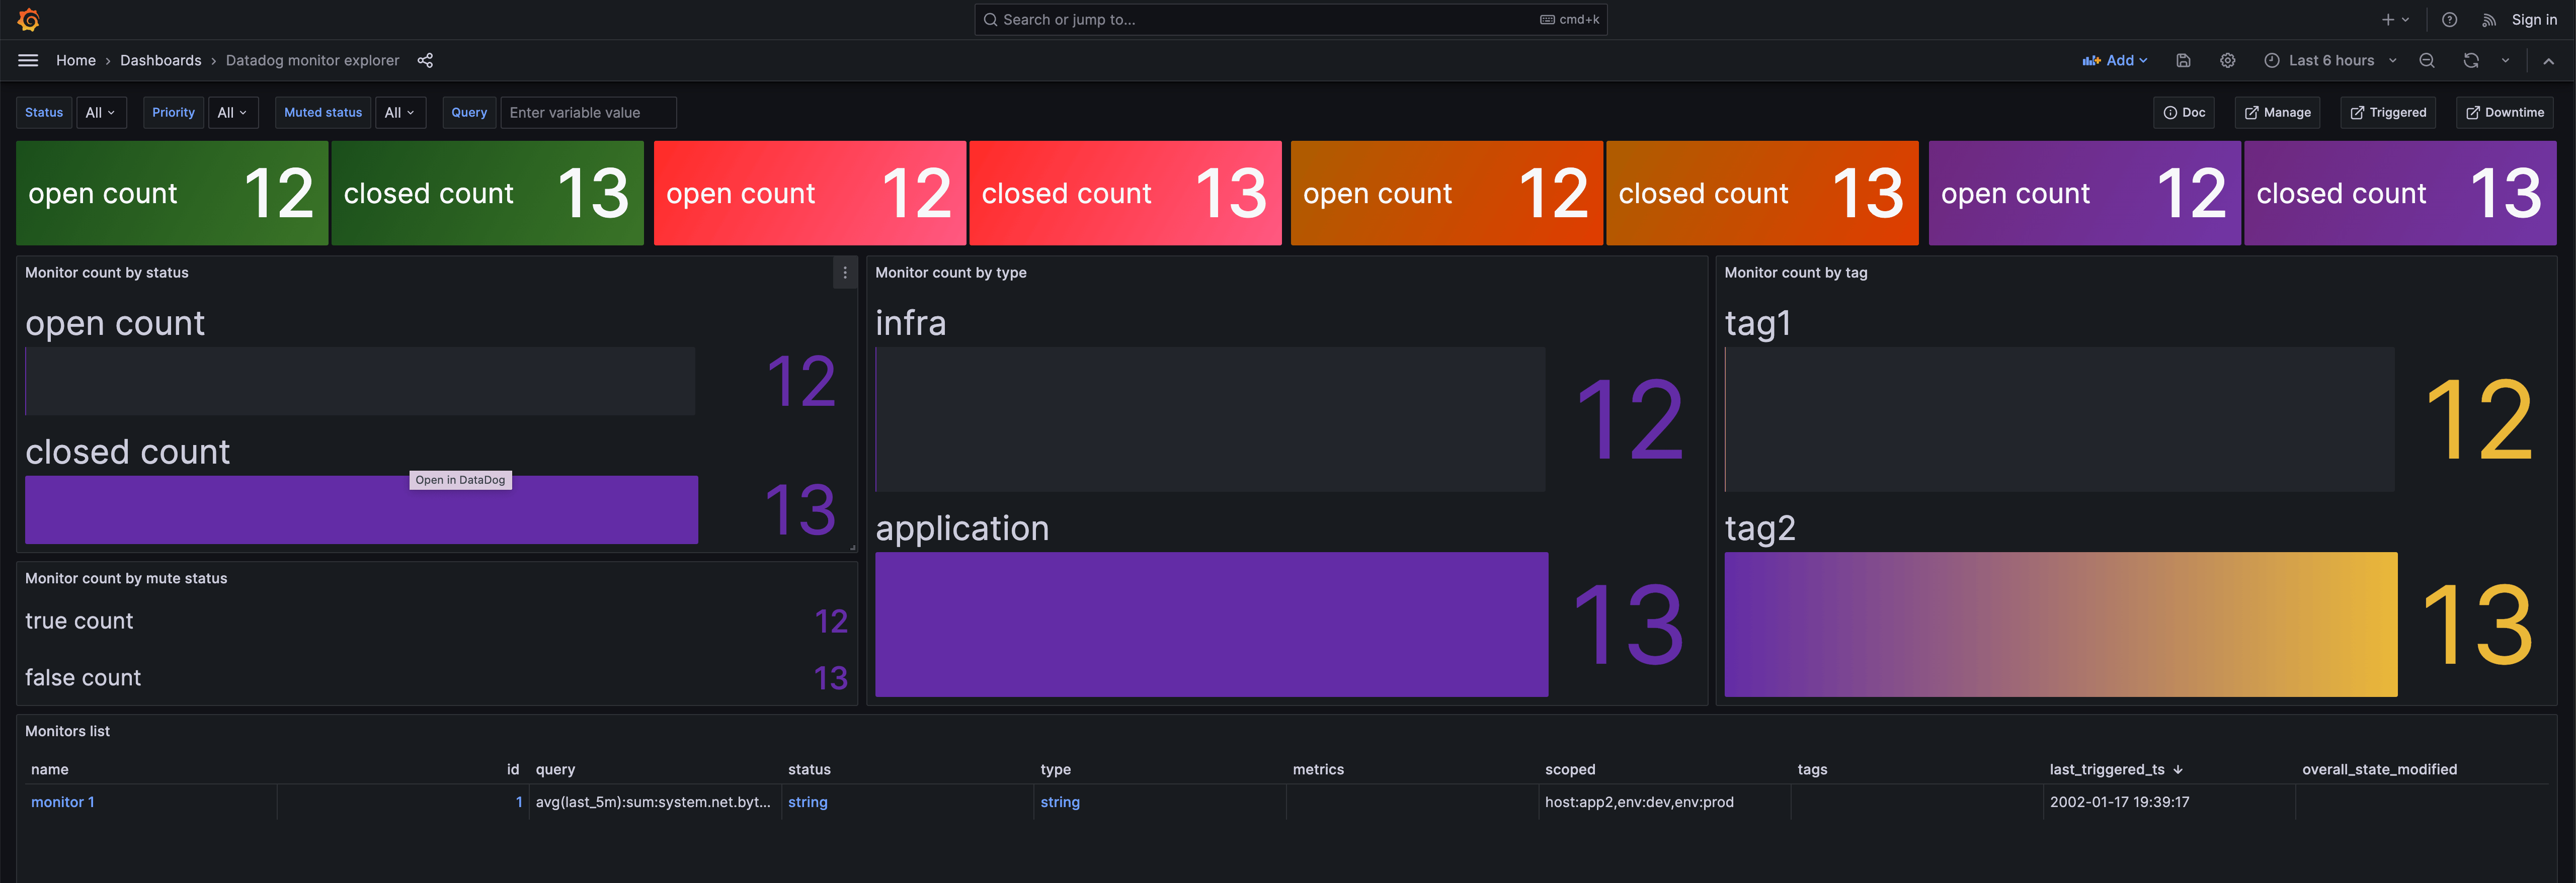
Datadog visualizations
The Datadog data source plugin is the easiest way to visualize Datadog data alongside Prometheus metrics as well as telemetry from other observability tools in a single dashboard.
Existing Grafana Cloud users
New to Grafana Cloud?
One dashboard for all your data
Visualize Datadog data without moving or duplicating it
Correlate Datadog data with a wide range of data sources
How to install and set up the Datadog data source plugin in Grafana Cloud
It only takes a few clicks to connect your Datadog instance with API and application authentication keys. Then you can use the prebuilt Grafana dashboards or write Datadog queries to create your own dashboard.
For full implementation details and best practices, see the step-by-step Datadog data source guide.


