
All-in-one Microsoft Azure observability in Grafana Cloud
Visualize and alert on Micosoft Azure resources and metrics in minutes.
Why use Microsoft Azure Observability in Grafana Cloud?
Easy, fast setup
Securely connect Microsoft Azure resources to Grafana Cloud, without local agents or complex configurations.
Unify your Microsoft Azure data
Integrate metrics and logs from Microsoft Azure services into a unified backend that’s powered by open source and built for scale.
Control costs
Select and aggregate the exact metrics needed from your Microsoft Azure resources, optimizing both performance monitoring and cost management.
One Microsoft Azure observability tool, multiple ways to connect
Send logs and metrics to Microsoft Azure with the integrations that fit your needs:
- Microsoft Azure metrics
- Microsoft Azure Monitor for metrics
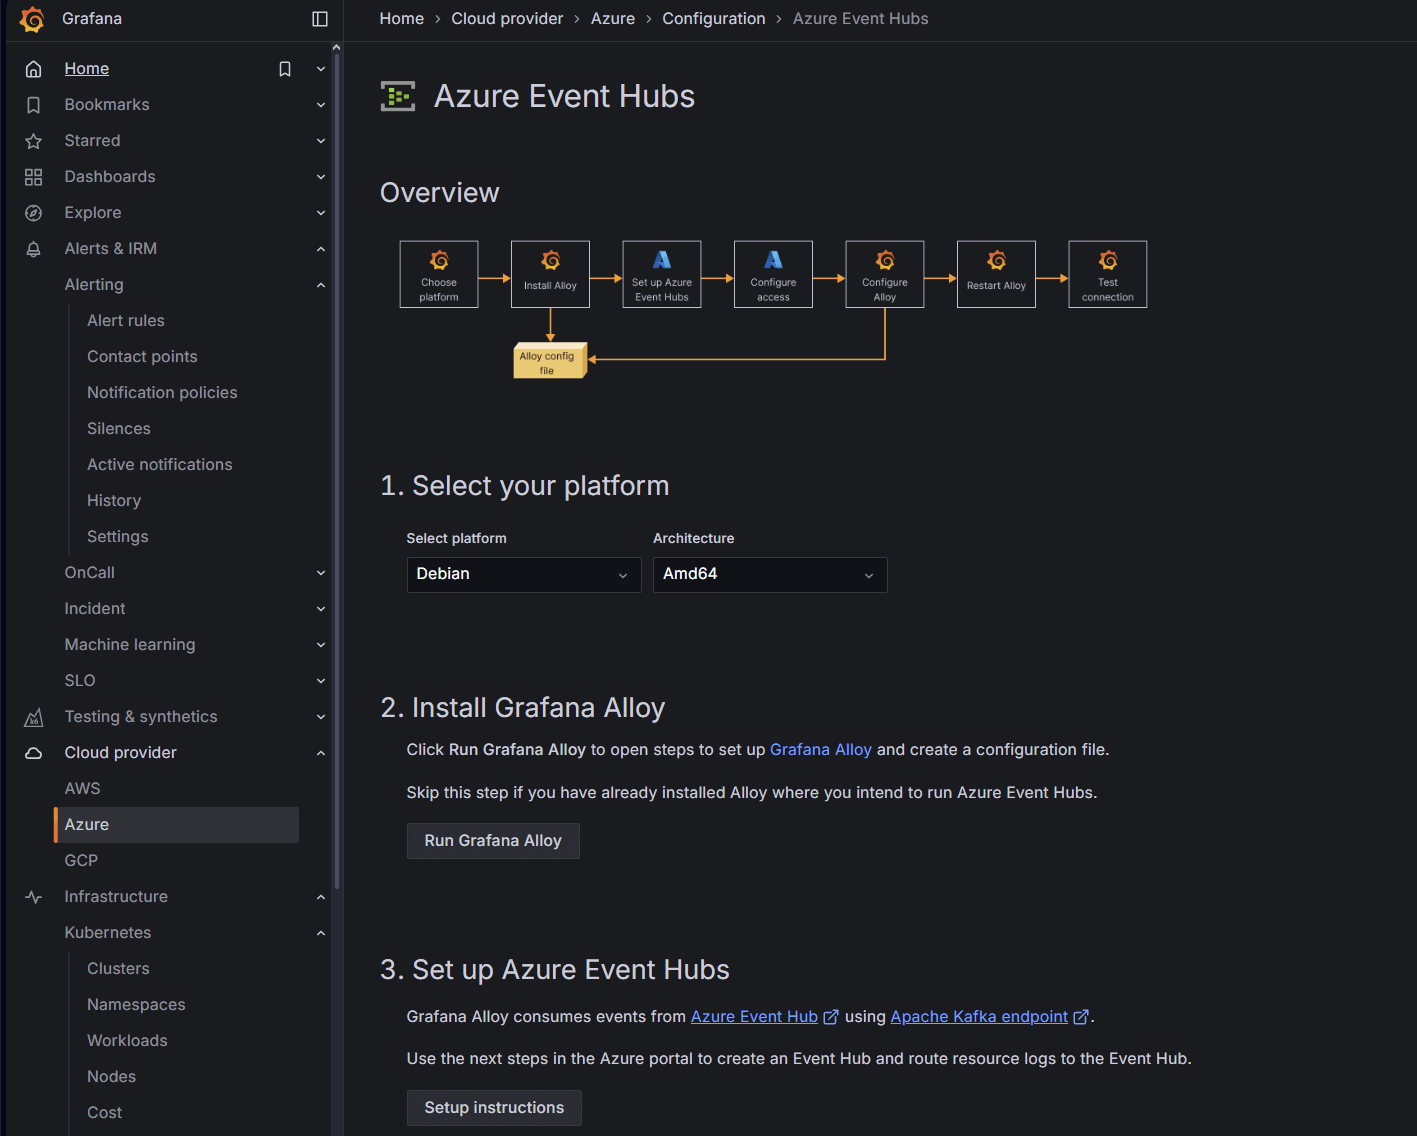
- Microsoft Azure Event Hubs for logs
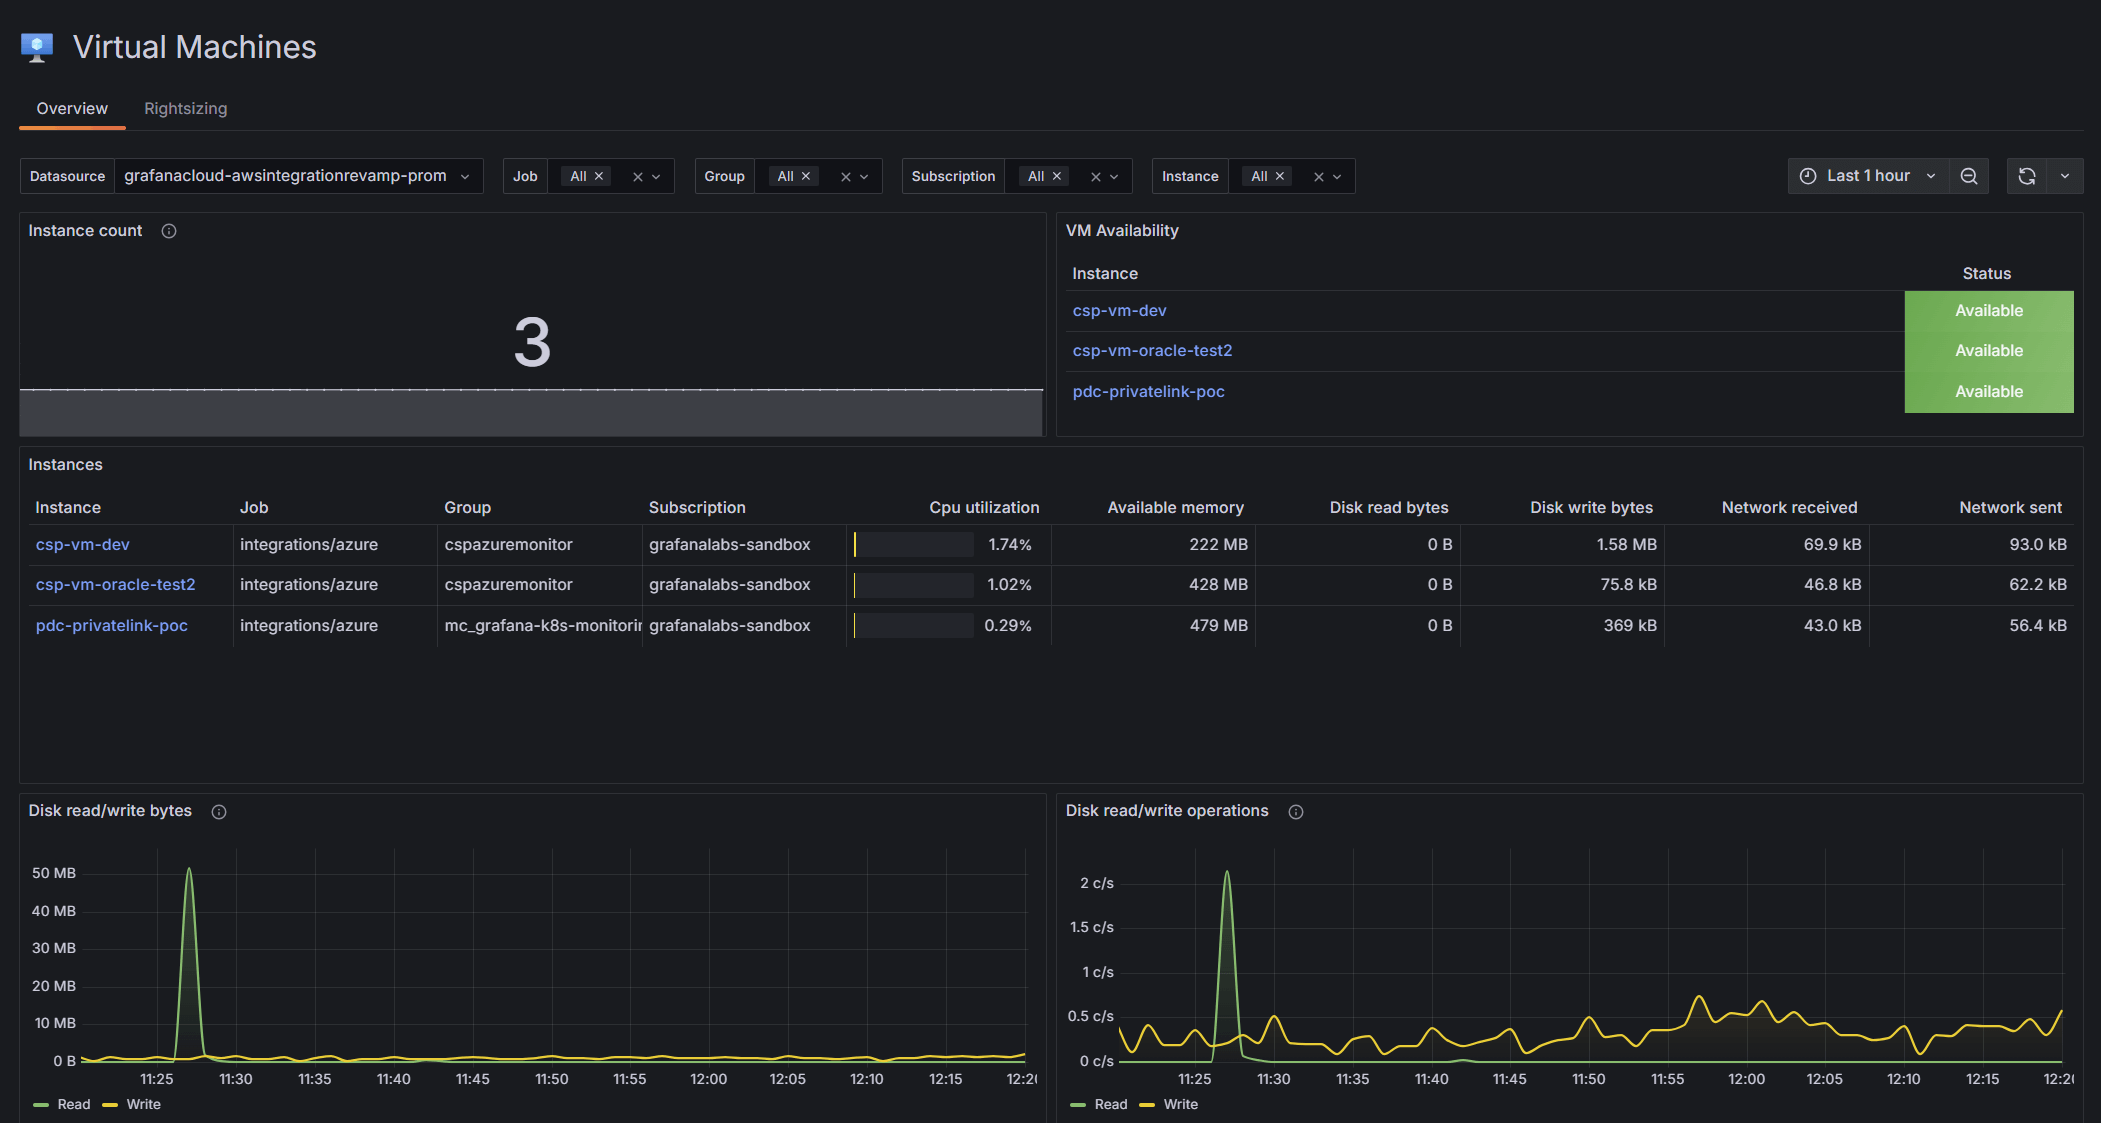
Dedicated Virtual Machines view
Gain in-depth insights into your Microsoft Azure Virtual Machines with a specialized visualization that helps you monitor critical metrics, optimize resources, and make data-driven decisions.
- Drill down into Microsoft Azure Virtual Machines to gain utilization and performance insights
- Filter instances by job, group, subscription, and instance
Prebuilt dashboards for Microsoft Azure services
Get immediate insights with preconfigured dashboards for popular Microsoft Azure resources such as:
- Microsoft Azure Blob Storage
- Microsoft Azure Event Hubs
- Microsoft Azure SQL Database
- Microsoft Azure Virtual Machines
- Microsoft Azure Front Door
- Microsoft Azure Service Bus
- Microsoft Azure Virtual Network
- Azure SQL Database elastic pools

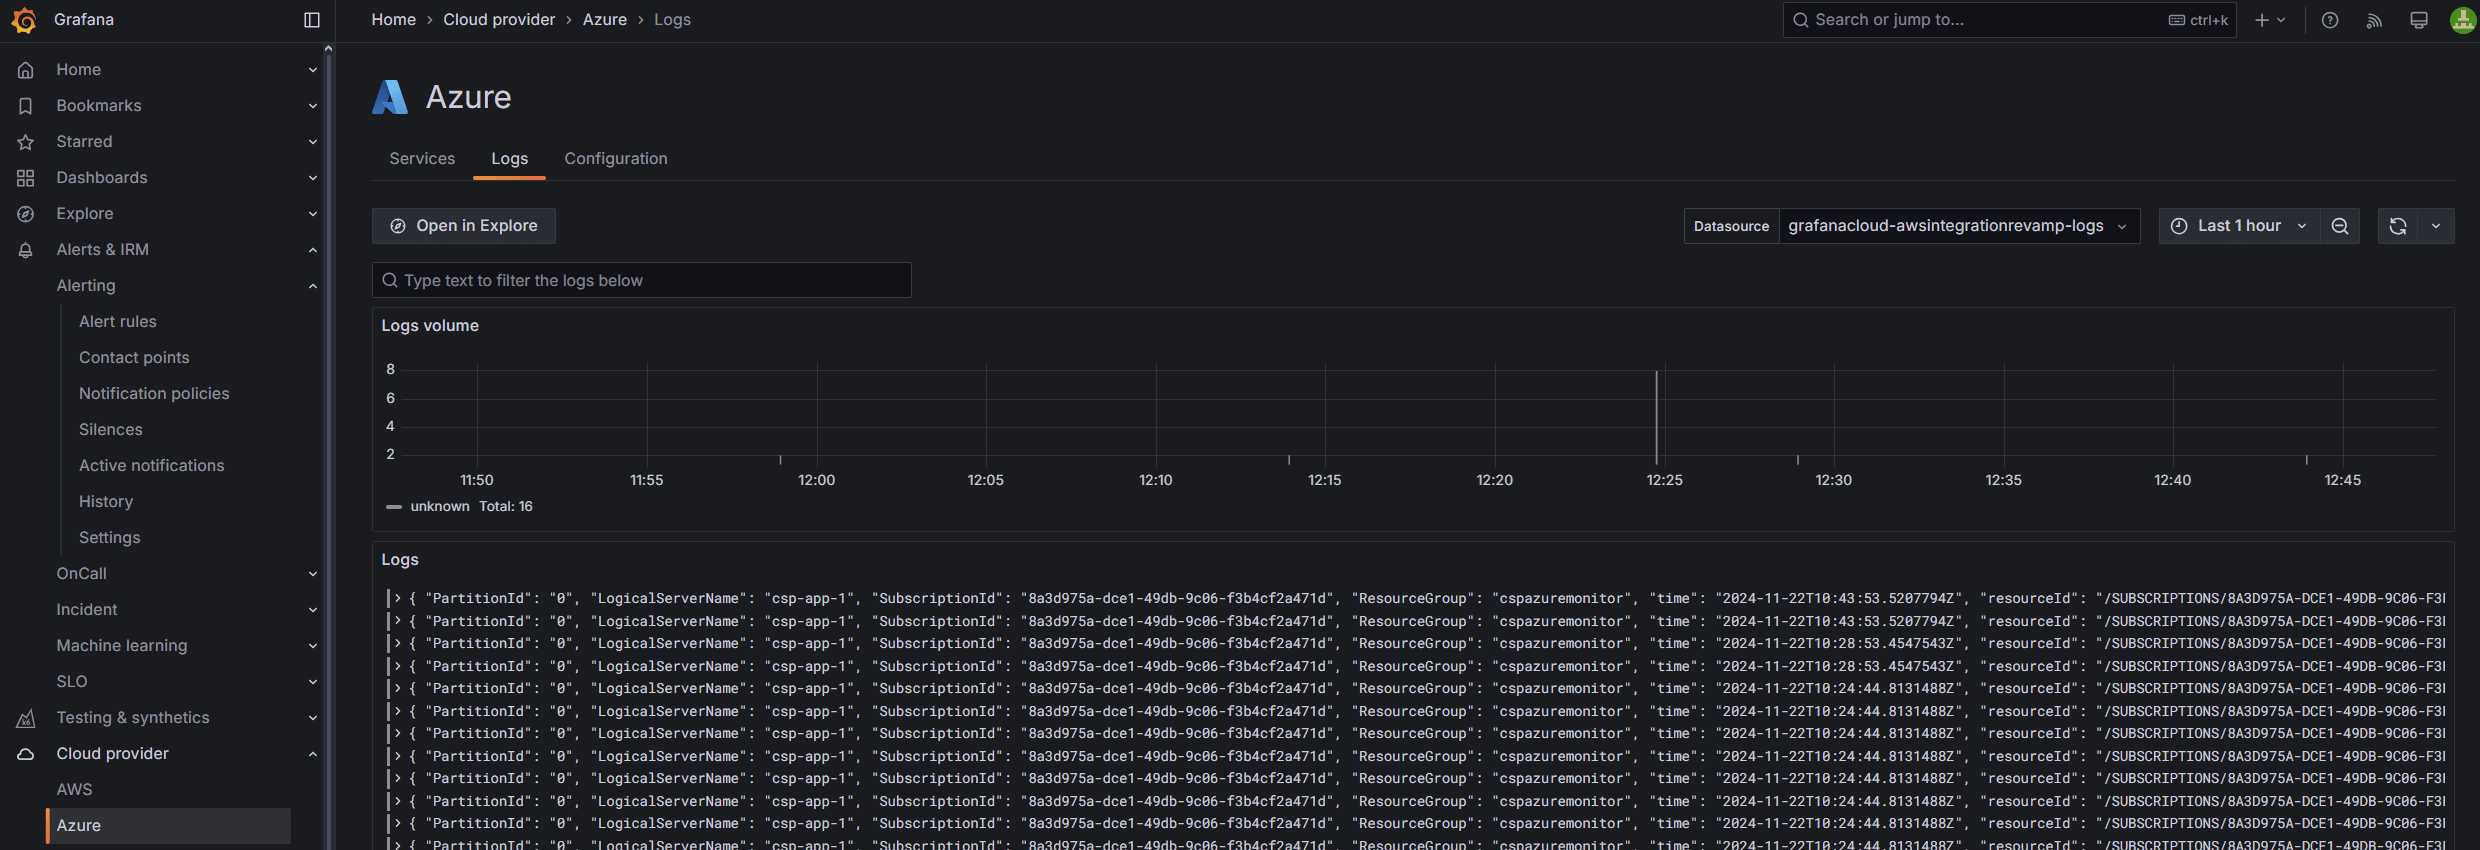
Dedicated logs view for Microsoft Azure services
- Correlate events across services
- Identify root causes, trends, anomalies, or potential vulnerabilities
- Pinpoint performance degradation or cascading failures for all your services
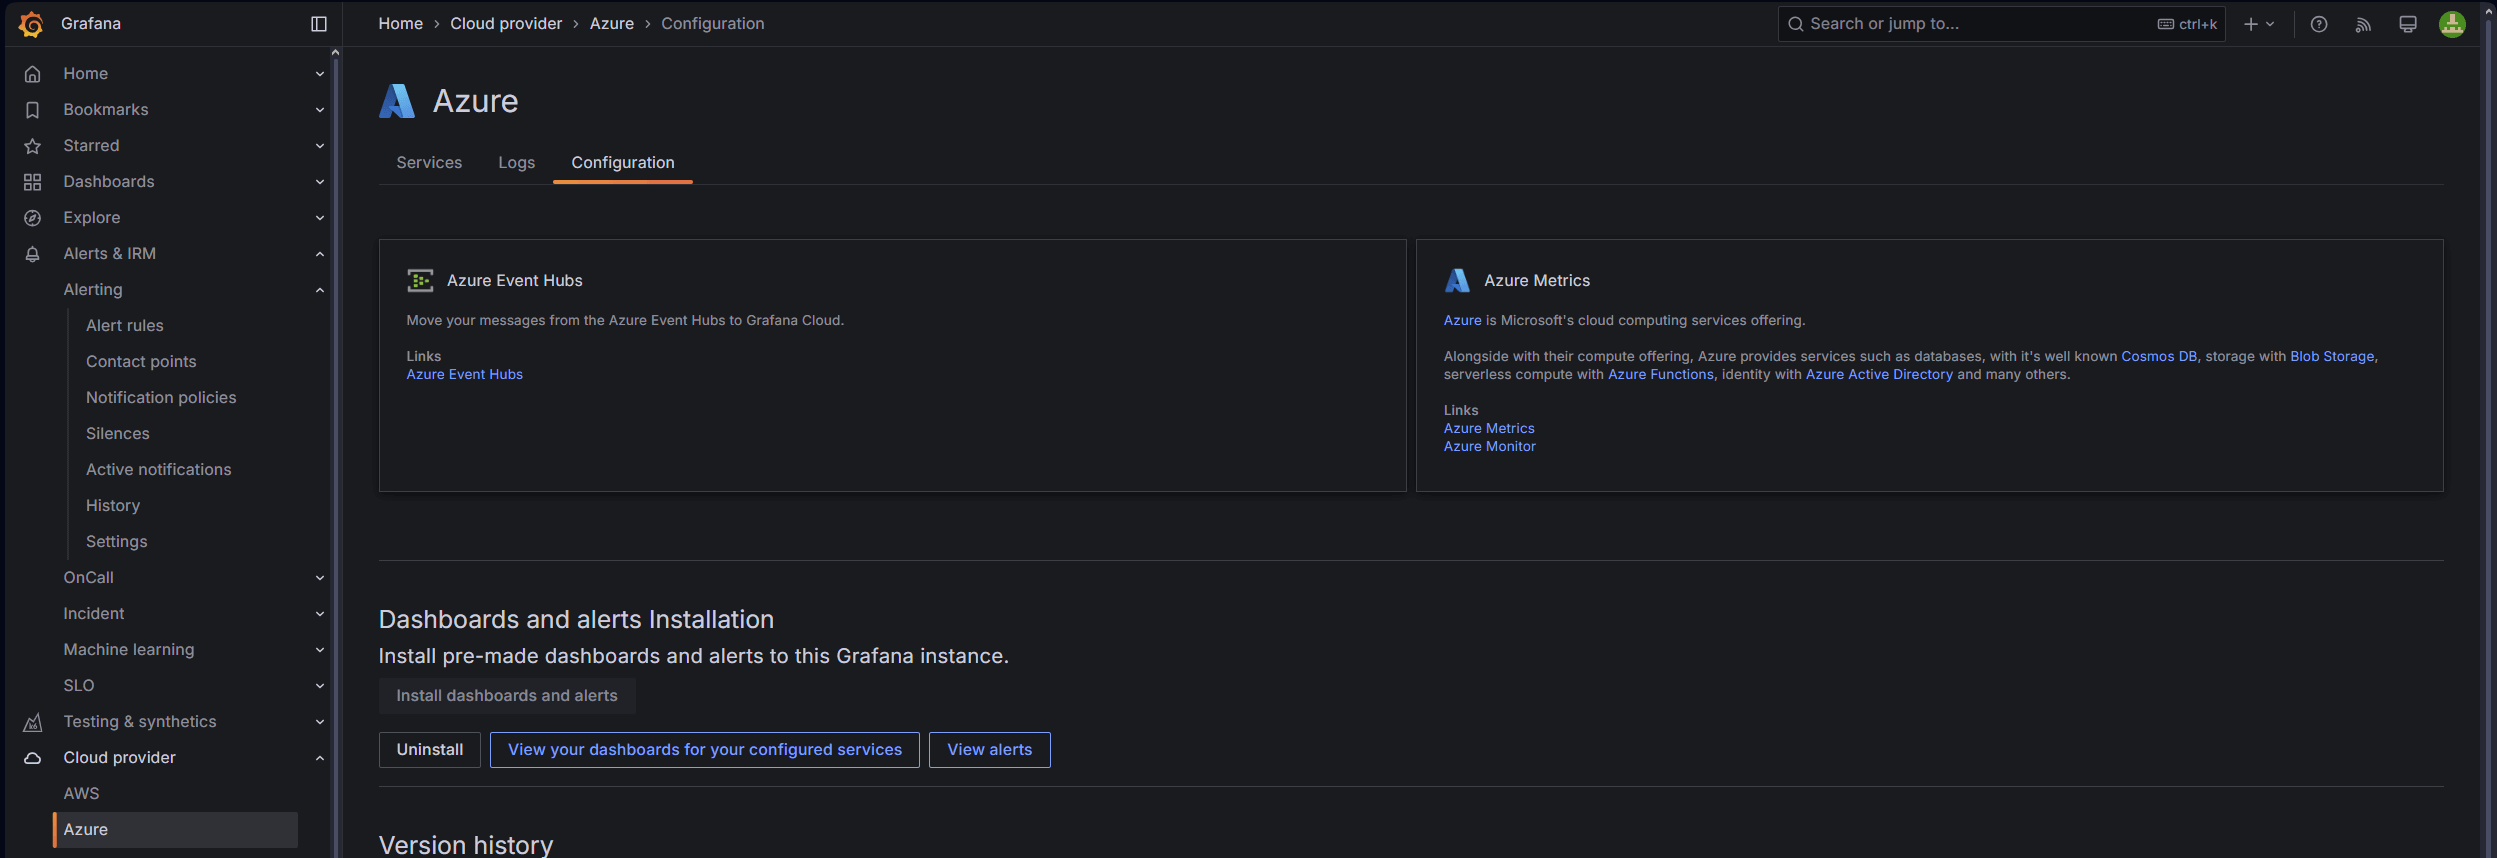
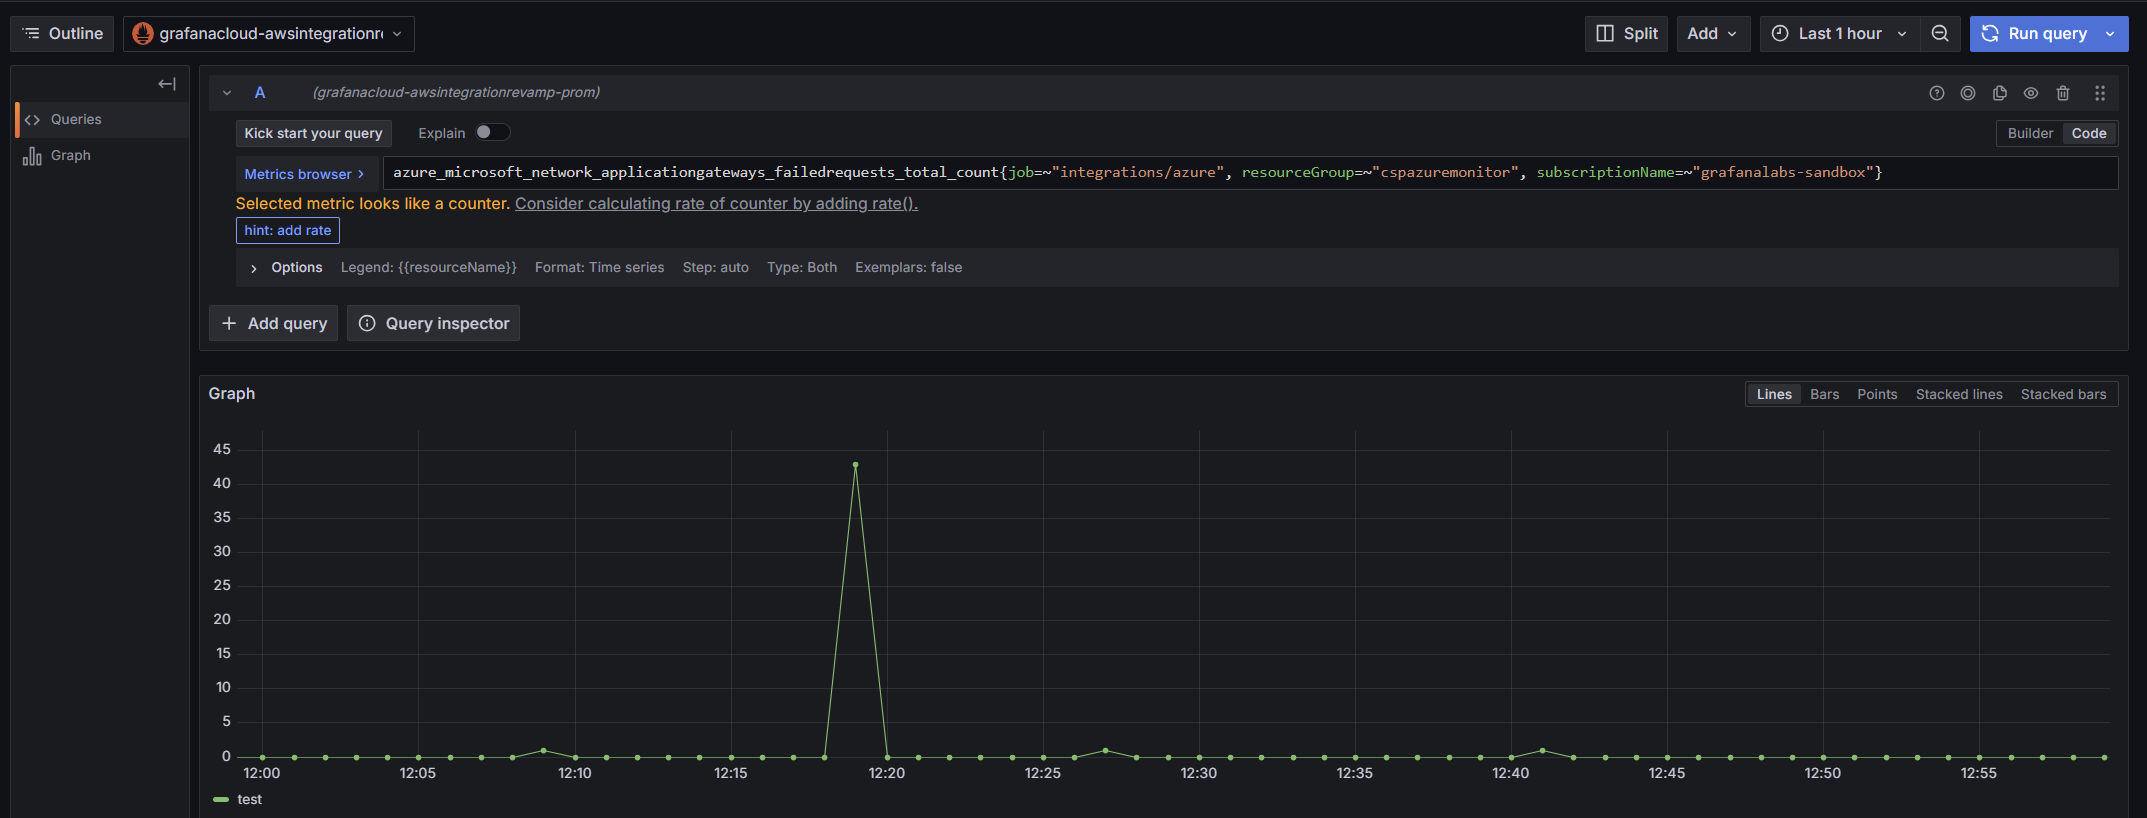
Simple metrics and logs ingestion
Configure your Microsoft Azure metrics and logs with ease.
- Easy-to-follow setup for for Microsoft Azure Event Hubs, Microsoft Azure Metrics, and Microsoft Azure Monitor with Grafana Alloy
- Configure serverless Microsoft Azure metrics with Terraform
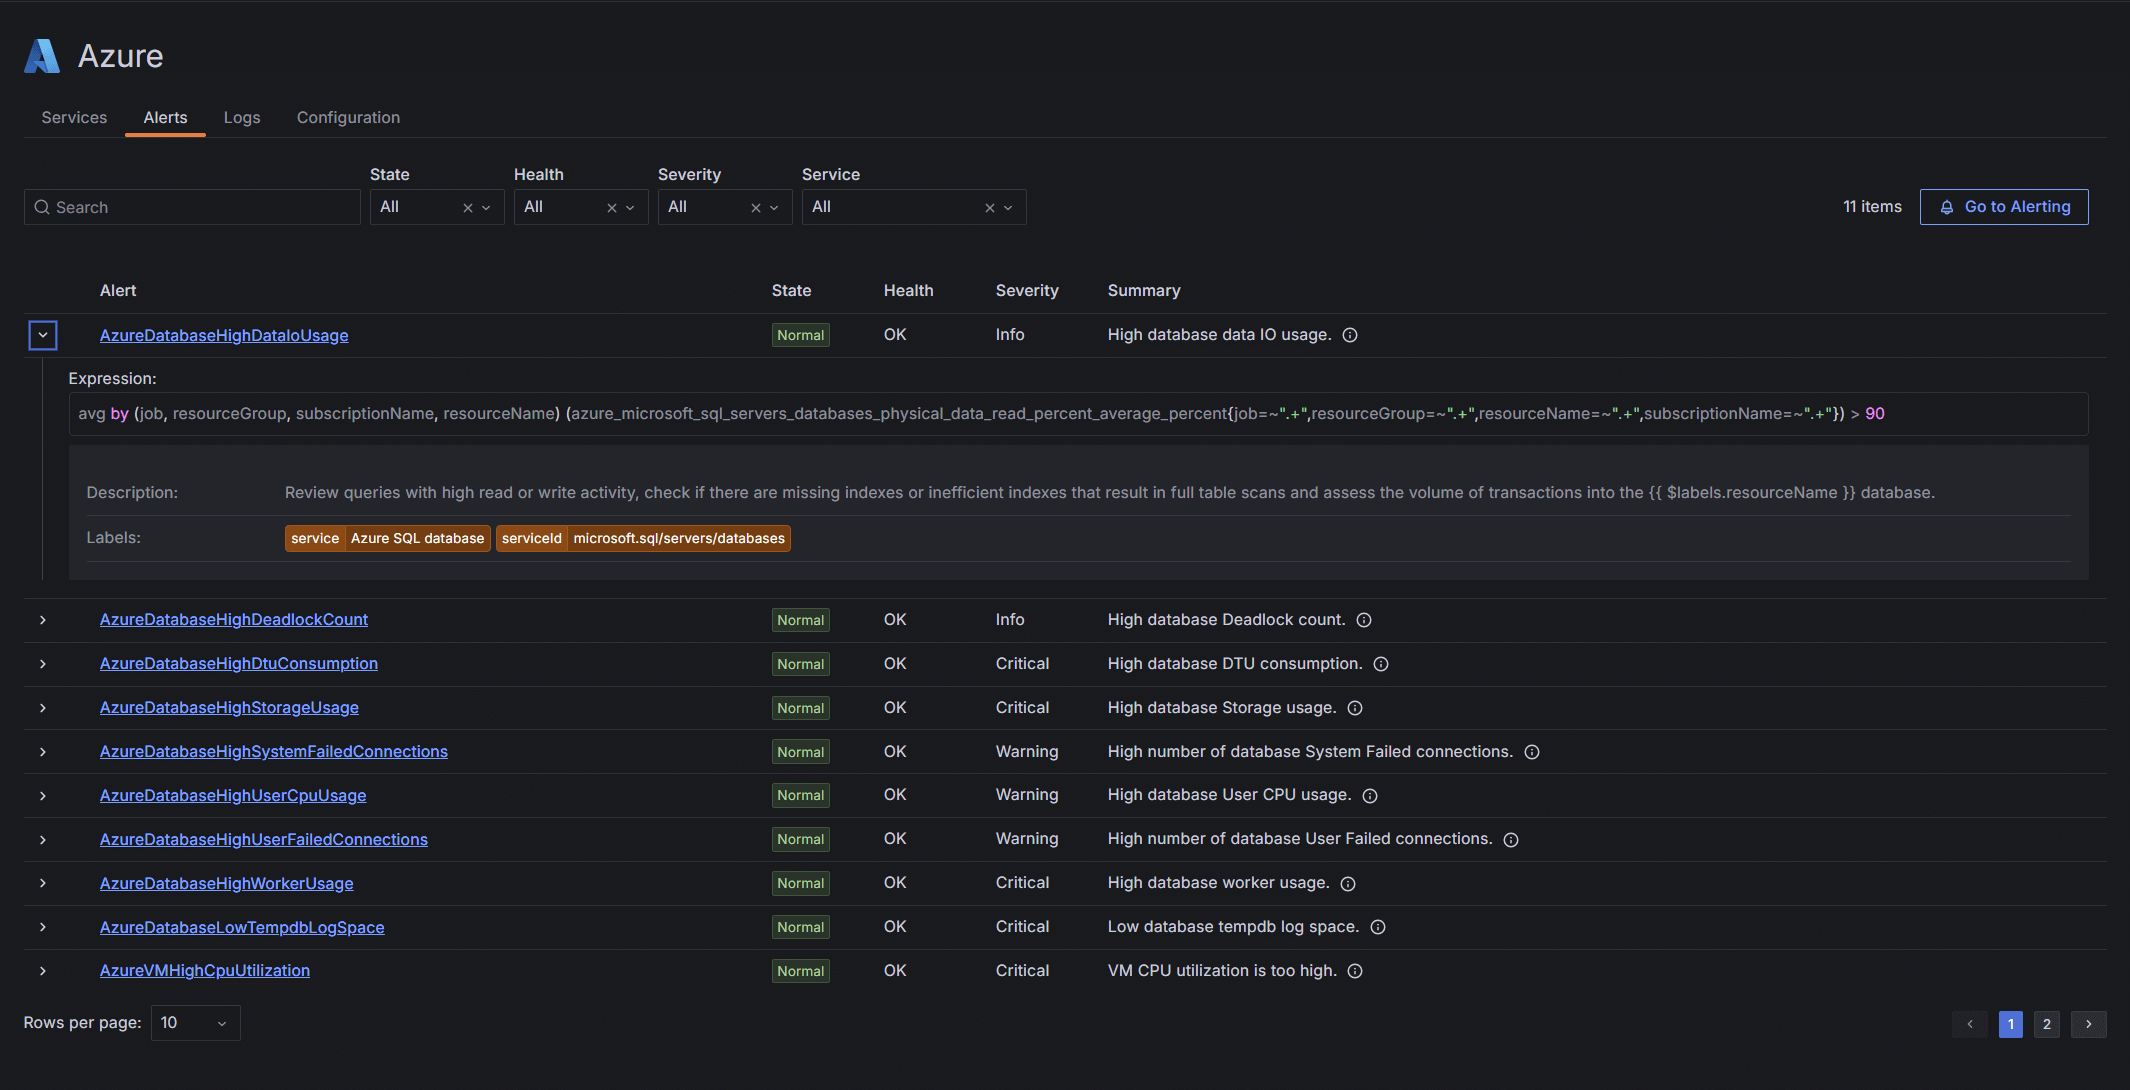
Out-of-the-box alerting
Ensure prompt reaction and detection of service anomalies.
- Easy, one-click install
- Foundational set of alerts following Microsoft Azure’s best practices for health and performance
Observe all your cloud environments in one place
Centralize your Microsoft Azure data alongside your metrics, logs, and more from other data sources, including other public clouds.
- Unify data in Grafana Cloud for fast, unlimited queries
- Create alerts and explore your data with a single query across Microsoft Azure regions and services by using PromQL-based query languages
- Securely send your telemetry between virtual private clouds (VPCs), supported Microsoft Azure services, and your on-prem networks without exposing your traffic to the public internet, saving on egress fees
It’s easy to get started
For full implementation details and best practices
1
Sign up
Create your free Grafana Cloud account.
2
Connect your data
With a few clicks, set up default configurations for prebuilt Microsoft Azure dashboards.
3
Deploy
Data will stream from Microsoft Azure into Grafana Cloud.