All-in-one AWS observability in Grafana Cloud
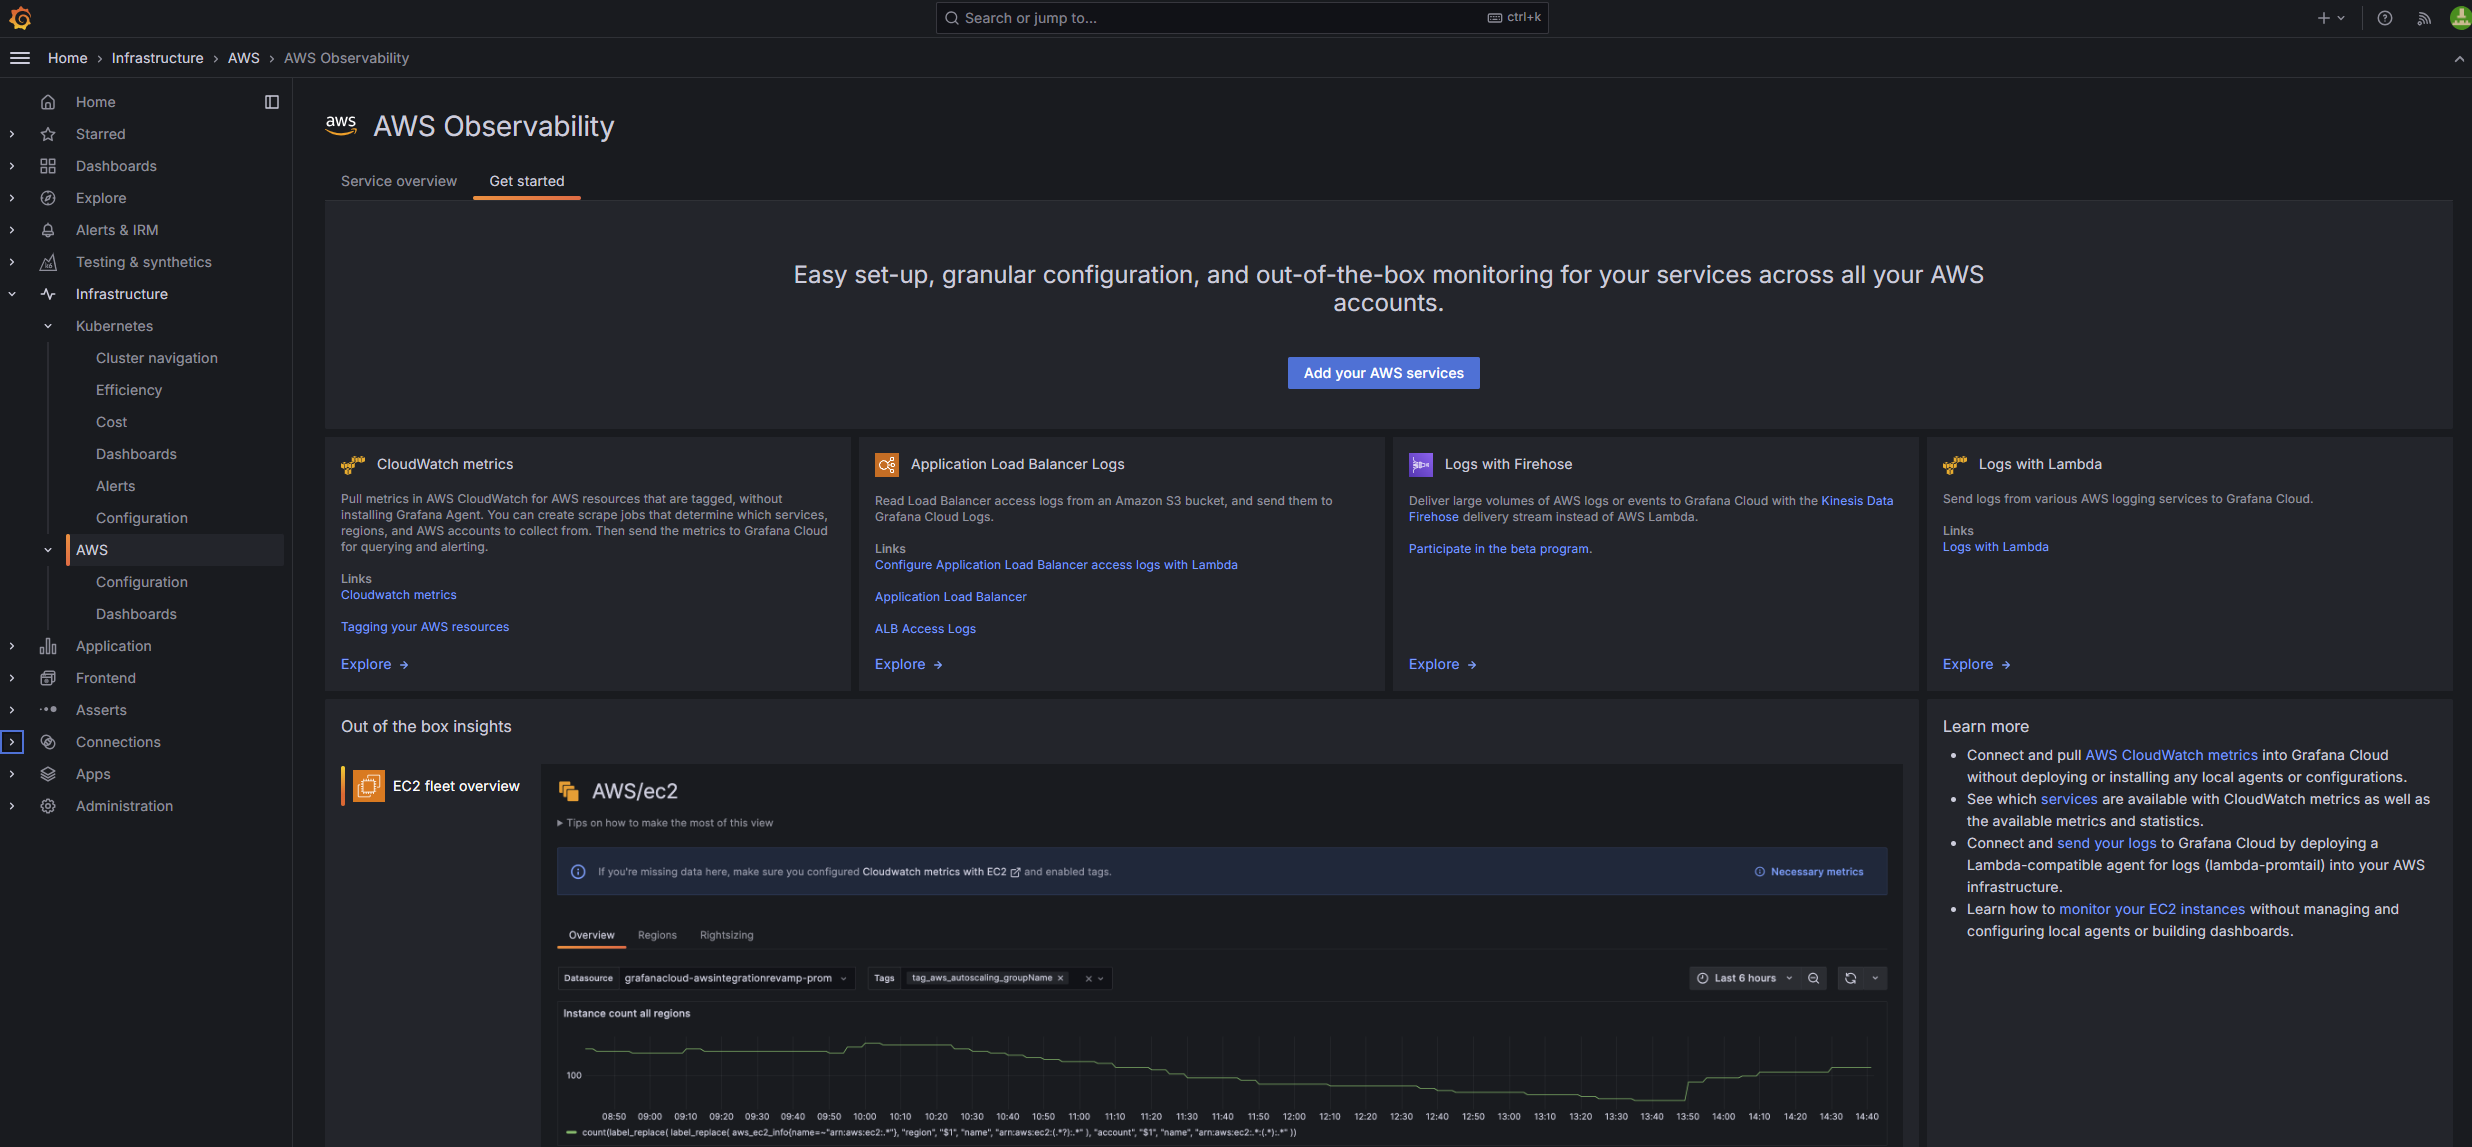
Visualize and alert on more than 60 Amazon Web Services (AWS) resources in minutes with the AWS Observability app.
Why use AWS Observability in Grafana Cloud?
Easy, fast setup
Securely connect your AWS resources to the fully managed Grafana Cloud observability stack without the need for local agents, exporters, or instrumentation libraries.
Unify your AWS data
Store metrics and logs from more than 60 different services in a unified backend powered by open source and built for massive scale.
Control costs
Define the exact aggregated metrics you want to connect for each AWS cloud service — whether it’s one or many — to help manage your budget.
One AWS monitoring tool, multiple ways to connect
Send logs and metrics to Grafana Cloud with the integrations that fit your needs:
- Amazon CloudWatch for metrics
- Amazon Data Firehose streaming for logs
- AWS Lambda-Promtail for logs
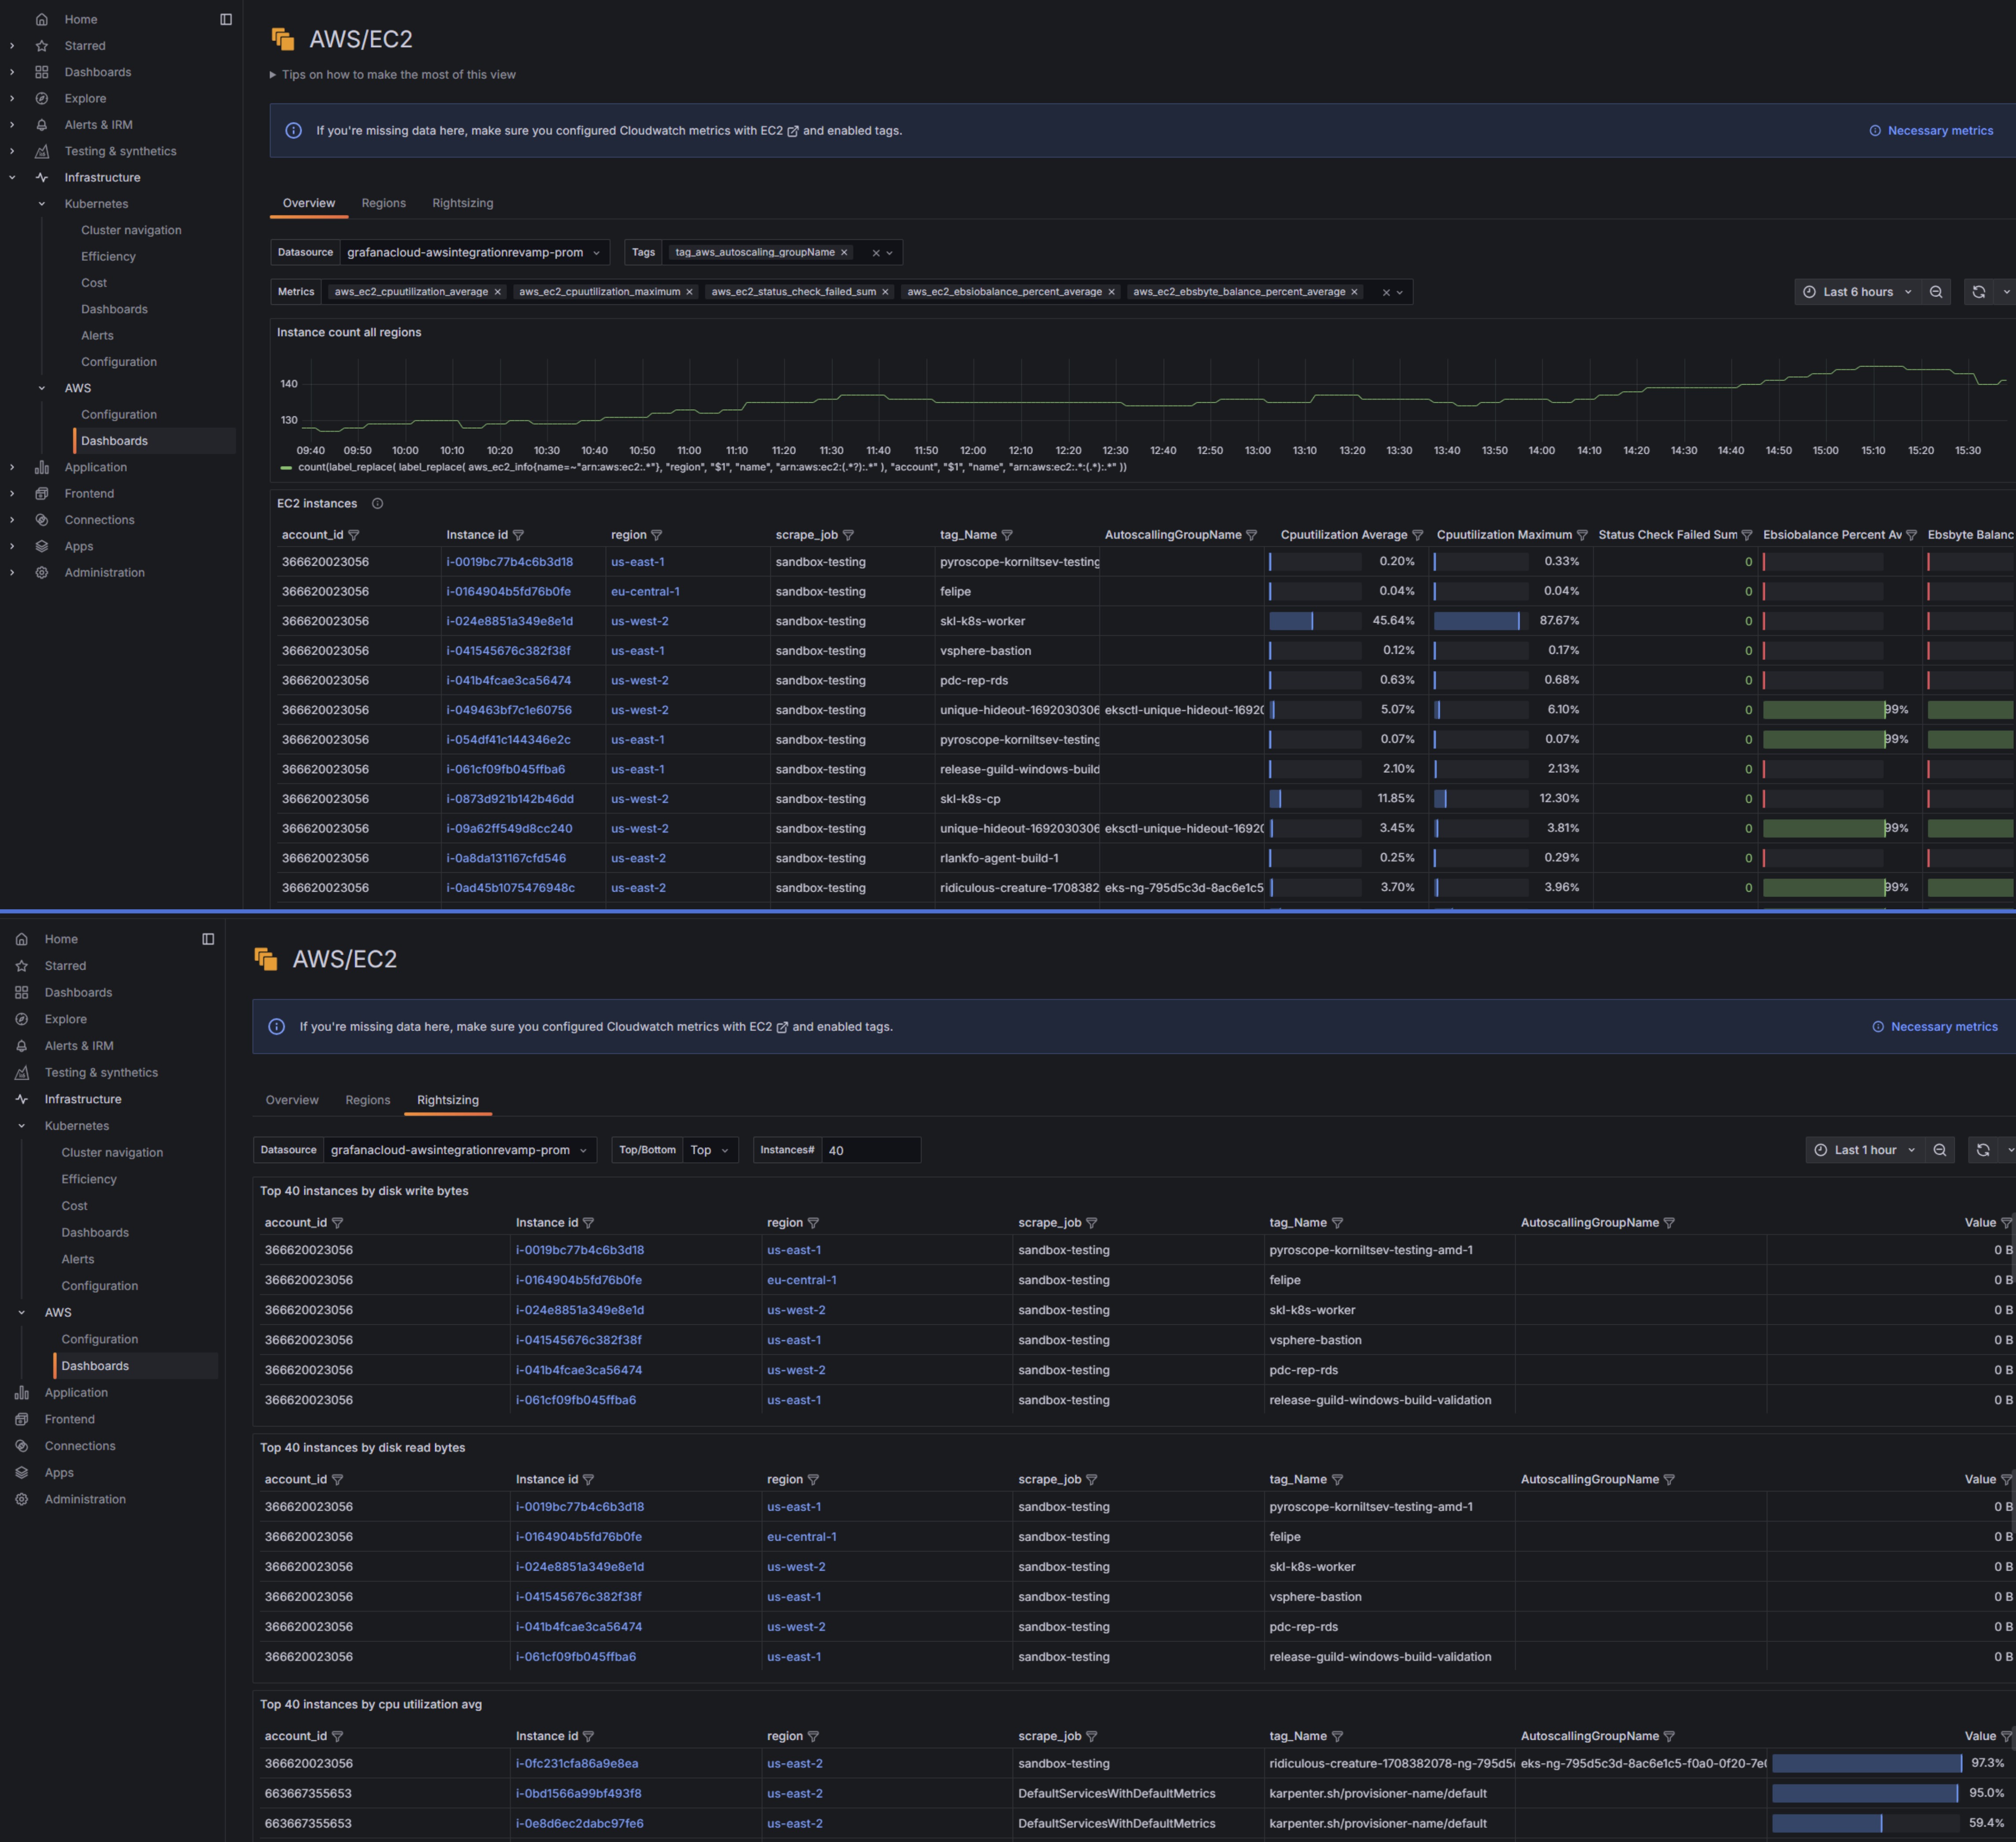
Dedicated Amazon EC2 view
Gain in-depth insights into your Amazon EC2 instances with a specialized dashboard that helps you monitor critical metrics, optimize resources, and make data-driven decisions.
- Drill down into EC2 instances to gain utilization and performance insights
- Filter instances by region, scrape job, or tag
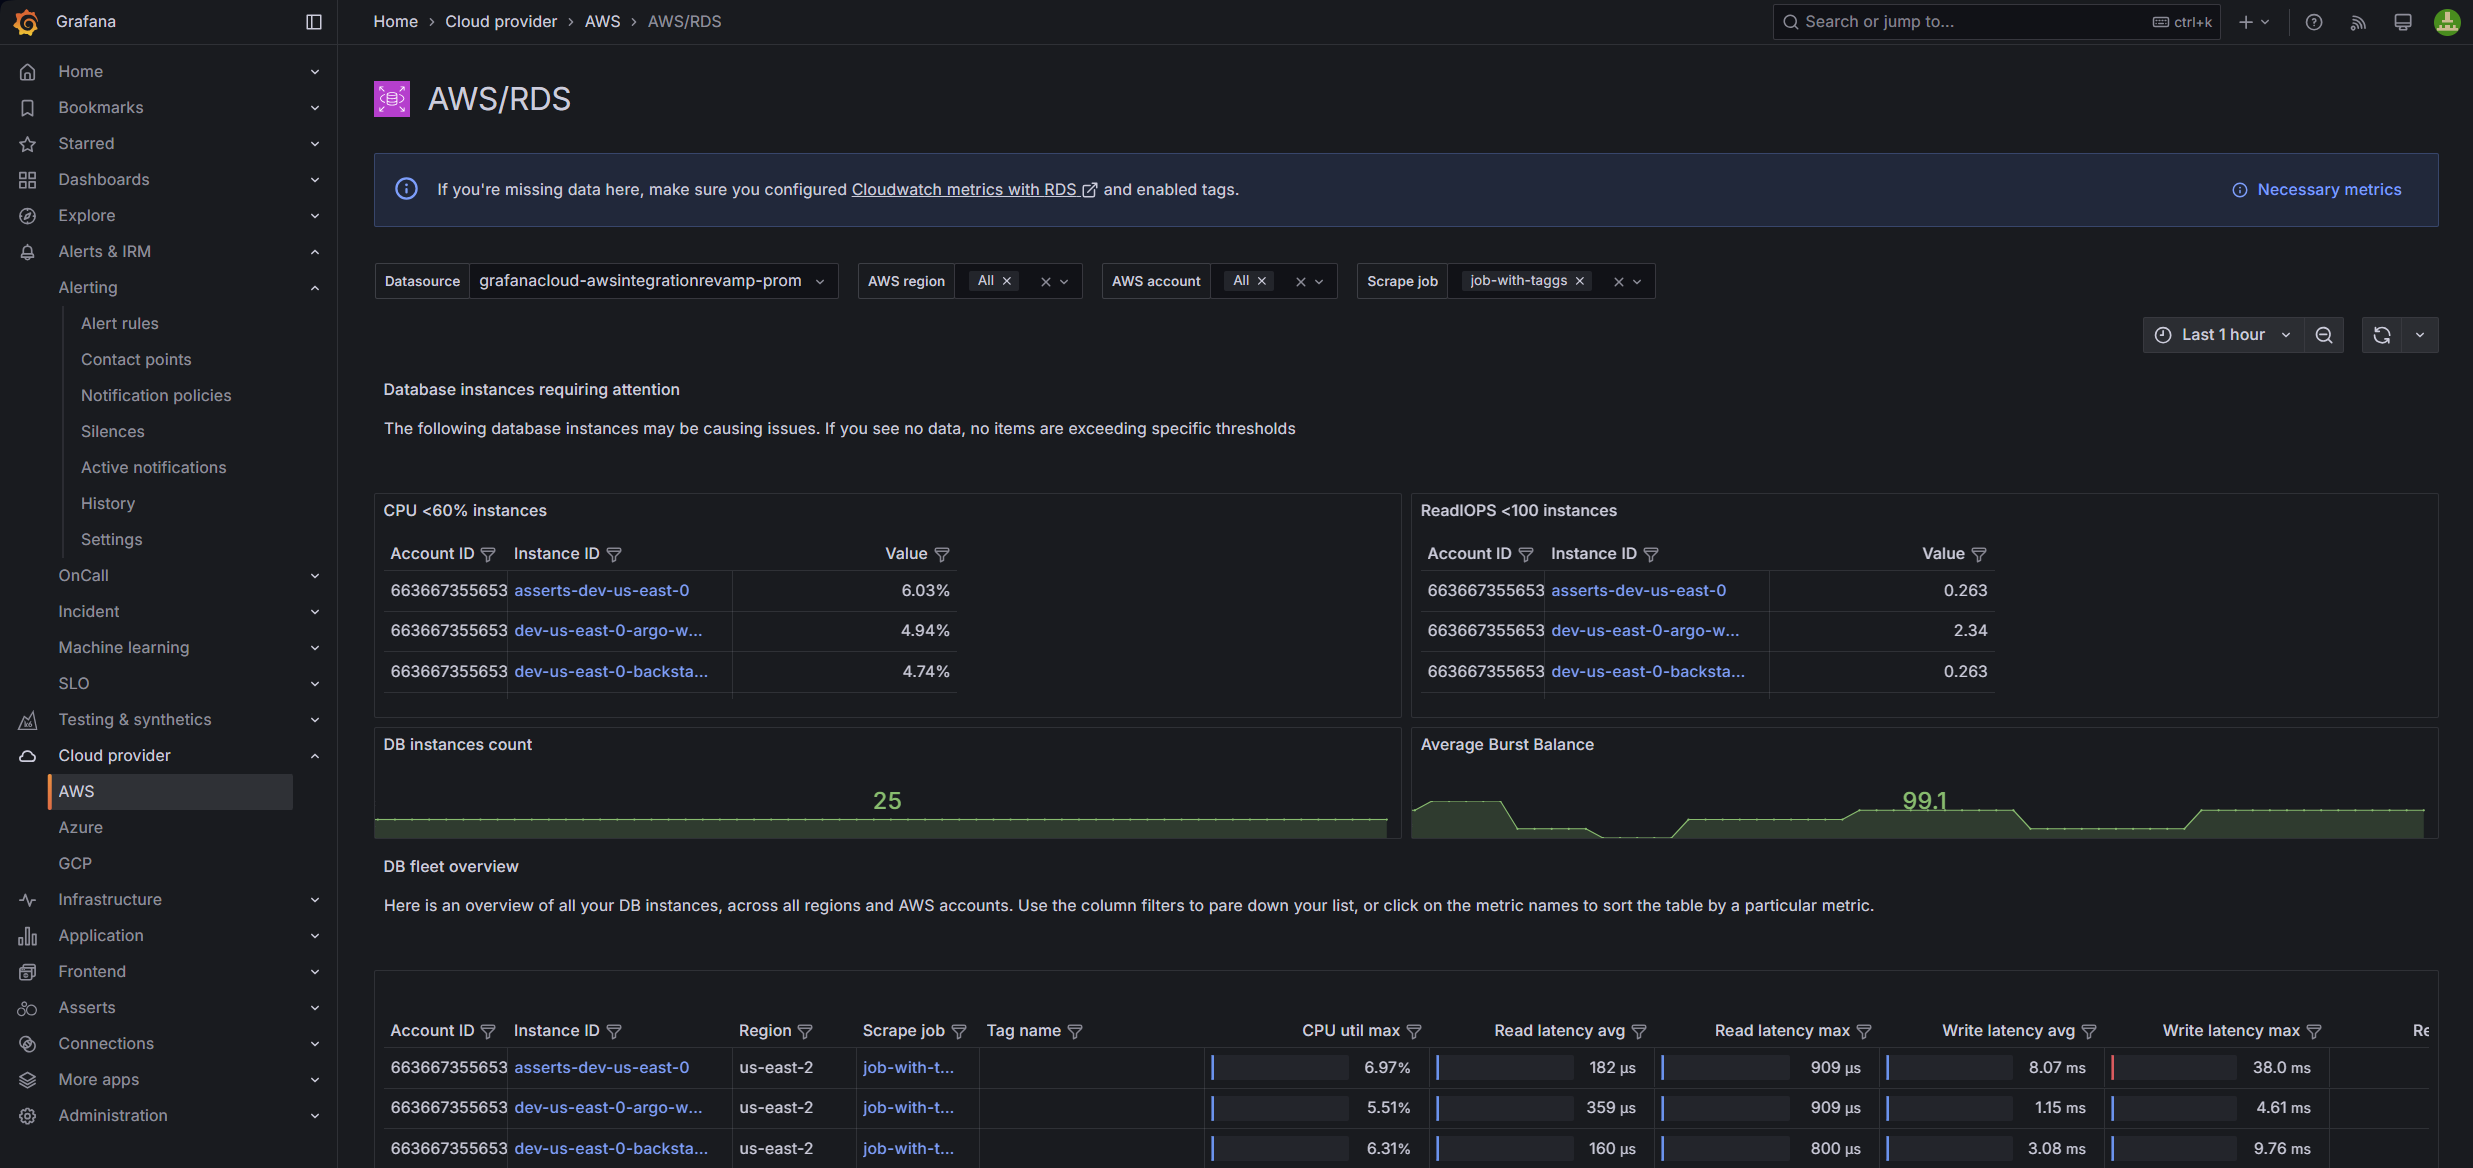
Dedicated Amazon RDS view
Gain in-depth insights into your Amazon Relational Database Service (RDS) instances with a specialized dashboard that helps you monitor essential metrics, optimize database performance, and make informed decisions.
- Drill down into RDS instances to analyze performance and availability
- View metrics like CPU utilization, database connections, disk throughput, IOPS, and Aurora replica lag
- Filter instances by region, account, or tag for tailored monitoring
Turnkey AWS dashboards
Quickly spin up dozens of additional prebuilt dashboards to track your costs and monitor popular AWS cloud services such as:
- AWS Billing
- Amazon CloudFront
- Amazon EBS
- Amazon ECS
- AWS ELB Application Load Balancer
- AWS ELB Classic Load Balancer
- AWS Lambda
- AWS NAT Gateways
- Amazon S3
- Amazon SES
- Amazon SQS
- AWS VPN
Dedicated logs view for all services
Access all AWS service logs in one centralized location for holistic insights.
- Identify root causes faster
- Explore all your services logs in one place
Simple UI for metrics and cost management
Configurable metrics, statistics, and refresh frequencies mean more predictable costs.
- Only pull what you need, when you need it, right down to the exact statistic
- Correlate and organize metrics in Grafana Cloud by adding resource tags to your CloudWatch metrics
Comprehensive scrape job management at scale
Ensure continuity in data collection and reduce your administrative overhead.
- Easily manage your scrape jobs with a single view of the ARN, region, and status for each configuration
- Make direct adjustments to existing jobs
Observe all your cloud environments in one place
Centralize your AWS data with your metrics, logs, and more from other data sources, including other public clouds.
- Unify data in Grafana Cloud for fast, unlimited queries
- Create alerts and explore your data with a single query across AWS regions and services, using PromQL-based query languages
- Securely send your telemetry between virtual private clouds (VPCs), supported AWS services, and your on-premises networks without exposing your traffic to the public internet, saving on egress fees
It’s easy to get started
For full implementation details and best practices
1
Sign up
Create your free Grafana Cloud account.
2
Connect your data
With a few clicks, set up default configurations for prebuilt AWS dashboards.
3
Visualize
Data will stream from AWS into Grafana Cloud.
Grafana Cloud in AWS Marketplace
- Existing AWS customers can procure, deploy, and scale the fully managed Grafana LGTM observability stack with just a few clicks.
- Get simplified, consolidated billing. Plus, use AWS customer commitments towards the purchase of Grafana Cloud.
- Extend your stack to include performance and load testing with Grafana Cloud k6, incident response and management with Grafana IRM, plus Frontend Observability and Application Observability.


