Grafana Enterprise Logs
With its unique approach to log indexing, storage, and administration control, Grafana Enterprise Logs is a self-managed logging solution that runs securely at scale with expert support from Grafana Labs.
Traditional logging vendors
Most enterprise logging solutions are expensive and require constant attention and monitoring to scale up.
Limited or inflexible admin capabilities for setting proper access controls
Expensive to store logs
Doesn’t correlate well with Prometheus metrics
Grafana Enterprise Logs
Store petabytes of log data with enterprise-grade administration, collaboration features, security, and support.
Advanced admin capabilities to easily grant individuals access to the resources they should have access to
Uses object storage for logs, making it very cost-effective
Great fit with Kubernetes, Prometheus, and visualization within Grafana
Architected for scale
Grafana Enterprise Logs is designed to store petabytes of log data and handle spikes in query and ingestion load at a fraction of the cost compared to other logging solutions.
- Centralized, horizontally scalable, replicated architecture so you can easily manage and scale your logging
- Only object storage needed (S3/S3-compatible, GCS, Azure, etc.)

Secure access with advanced admin controls
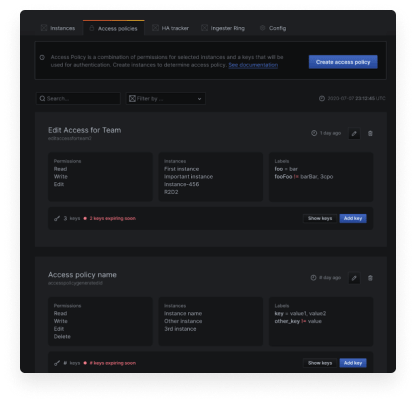
Grafana Enterprise Logs includes the security features enterprises need to scale logs for large, distributed teams. Robust data-access policies enable administrators to secure and govern data in order to control where their logs live and who gets to use them.
- Admins can use the built-in interface or a simple API to create access policies and generate tokens that grant or restrict individual access to resources.
- Access policies integrate with your existing authentication provider, making it simple to manage a large number of users.
Correlate metrics and logs
Traditional solutions were created before the rise of Prometheus as the de facto standard for monitoring Kubernetes and cloud native services. As the Prometheus query language and data model are very different from the traditional logging vendors’ query languages, this makes correlating metrics and logs harder.
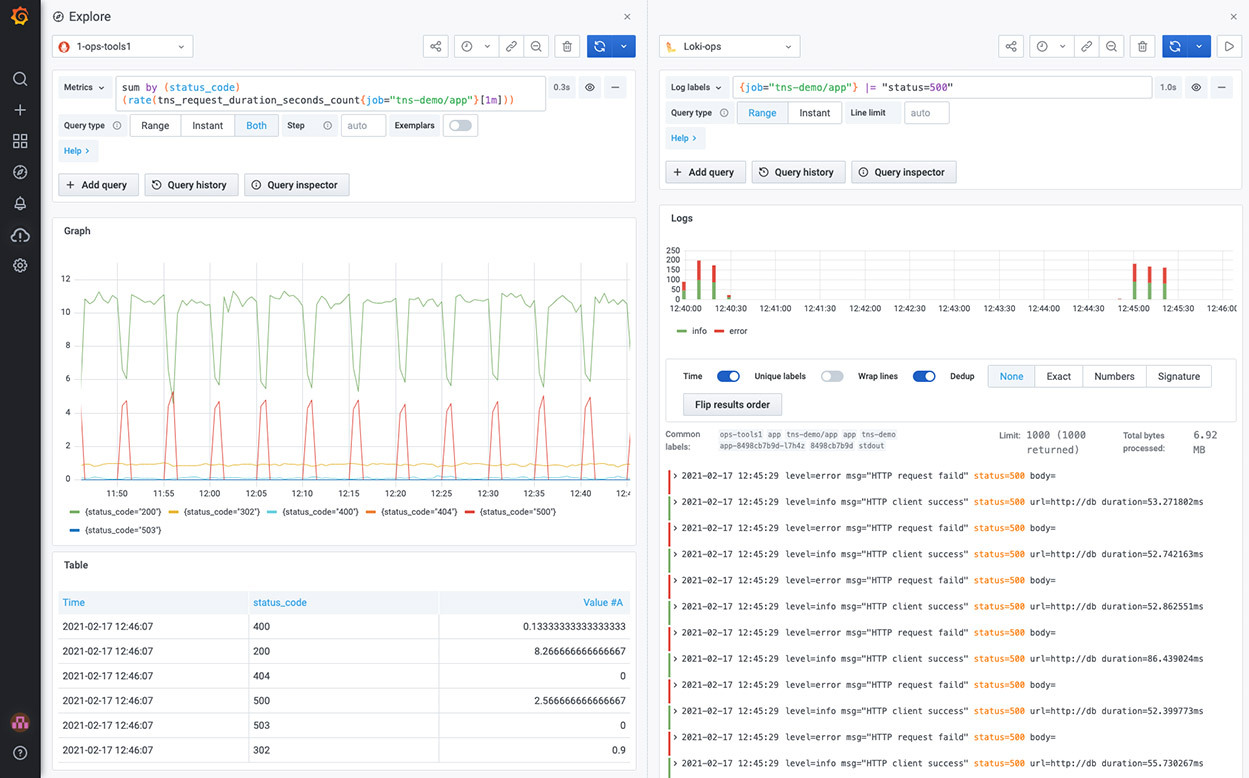
Grafana Enterprise Logs utilizes the same label model as Prometheus, allowing for effortless switching between metrics and logs and making it a great fit with Kubernetes, Prometheus, and visualization within Grafana.
- Prometheus integration makes it simple to jump between metrics and logs, helping you get a global view of the data faster.
- LogQL, which is modeled after PromQL, allows you to query logs with the same syntax used for querying metrics.


Integrated with your tools
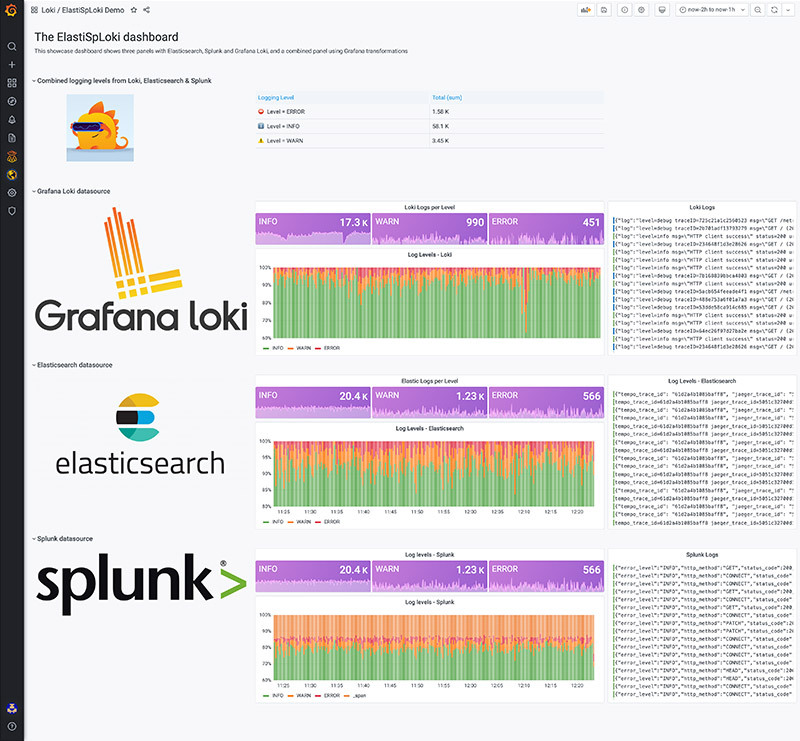
Grafana Enterprise Logs works alongside your technologies, making it easy to get started without having to rip out your existing logging tools.
Visualize log data from your current logging tool (such as Splunk, Elastic, or other providers) alongside your Grafana Enterprise Logs data, allowing you to:
- Gradually transition off of your costly or legacy logging tools.
- Avoid vendor lock-in and give your teams the tools they actually want to use.
Support
With Grafana Enterprise Logs, your team gets support, training, and consulting provided by the Grafana Labs team.
- A dedicated support team will help with setup, ongoing questions, bugs, security updates, and more.
- The core maintainers of Grafana Loki are available to ensure you’re implementing best practices.
Features
LokiLoki is a horizontally scalable, highly available, multi-tenant log aggregation system inspired by Prometheus. | Grafana Enterprise LogsLoki with enterprise-grade administration, collaboration features, security, and support. | |
|---|---|---|
LogQLA powerful language for querying logs, it’s based on PromQL, so your engineers don’t have to learn another query language. | ||
Efficient storage of logsStore logs for less than other logging solutions thanks to a simple object-storage-based backend. | ||
Alerts from logsSet up alerts that get triggered from log content. Great for applications that you can’t instrument with metrics because you don’t own the code. | ||
Runs on-premiseDeploy in your own data center or private cloud. | ||
Instance (tenant) managementCreate and manage instances, access policies, and tokens via UI and/or API. | ||
Fine-grained access controlLabel-based and cross-tenant access controls let you enforce access both within and across an individual team’s data. | ||
Centralized authenticationIntegrates with OAuth OpenID. Connect JWTs with access policies to seamlessly integrate with your current authentication provider. | ||
IndemnificationGet protection and peace of mind when offering the product as a critical service within your organization. | ||
Customer supportIncludes services like training and consulting as well as bug fixes and security updates. | ||
Usage insightsQuickly find out how your logging system is being utilized, such as which teams are writing or reading the most data. | Coming soon. |
Resources
Grafana Enterprise Logs demo video: Logging with security and scale
Blog: A closer look at the admin API and plugin in Grafana Enterprise Logs
Documentation: Grafana Enterprise Logs
Video: Observability with Loki 2.0

