Grafana Enterprise
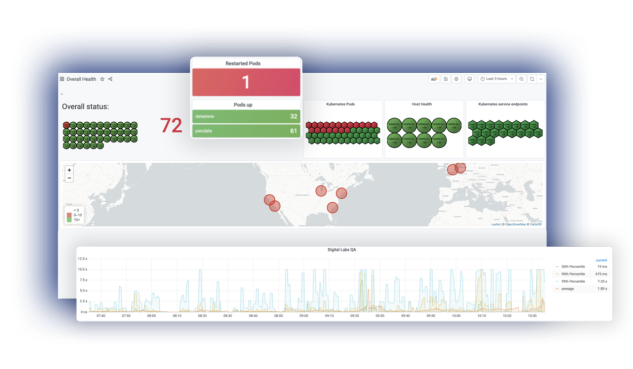
- Observe all of your data in one place with Enterprise plugins like Splunk, ServiceNow, Datadog, and more
- Built-in collaboration features allow teams to work together from a single dashboard
- Advanced security and compliance features to ensure your data is always secure
- Access to Prometheus, Graphite, Grafana experts and hands-on support teams

Unify your data,
not your database
Other vendors will try to sell you an “everything in my database” mentality. At Grafana Labs, we have a different approach: We want to help you with your observability, not own it.
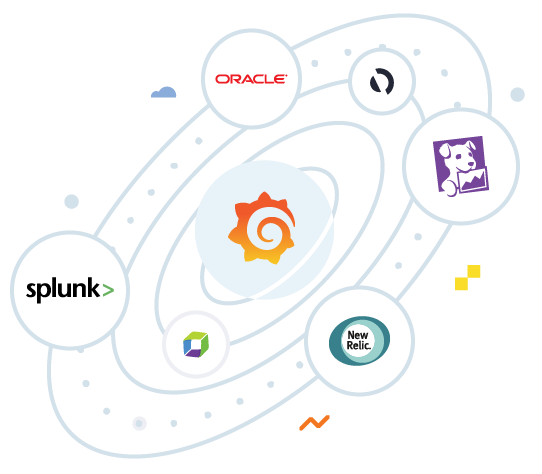
Grafana Enterprise includes access to enterprise plugins that take your existing data sources and allow you to drop them right into Grafana. This means you can get the best out of your complex, expensive monitoring solutions and databases by visualizing all the data in an easier and more effective way.

Build better together

See who else is looking at the same dashboard
Using Grafana by yourself is great, but when there is an outage or critical project, it’s important to know you have backup. With Grafana Enterprise, you can quickly see other users that are currently (or recently) viewing the same Grafana dashboard.
Reduce dashboard sprawl
Dashboards don’t help anyone if they aren’t being used. With usage insights, you can quickly understand the behavior and utilization of users, dashboards, and data sources to assure your team has access to meaningful data with insight into every dashboard.


Improve developer productivity
Democratize Grafana so your developers can easily collect data from various sources, view it, and then overlay it onto a single page. When everyone has access to the same data, it increases productivity and cross-functional collaboration.
Find what you’re looking for faster
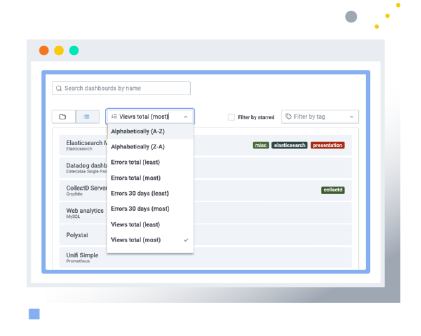
With advanced dashboard search capabilities, you can find unused or broken dashboards and learn which dashboards are the most viewed.

Get Grafana to your inbox
Reporting allows you to generate PDFs from any of your dashboards and have them sent out to interested parties on a schedule.
Custom branding
Customize your Grafana instance with your logo.
Tap into expert knowledge
Get access to experts at Grafana Labs
44% of Prometheus team members
89% of the Grafana team members, including project founders
91% of the Loki team members, including project founders
100% of Cortex maintainers, including project co-creator
Turn your team into experts
Engineering-led learning to help your teams uplevel their skills and observability strategy
Get roadmap assurance, and work with us to accelerate new features and functionality to shape the future of Grafana
Best practices embedded throughout various engagements and tools
Stay secured
Team sync
Team sync allows you to set up synchronization between teams in Grafana and teams in your auth provider so that your users automatically end up in the right team.
SAML authentication
SAML authentication enables your Grafana Enterprise users to authenticate with SAML.
Advanced authentication
Enhanced LDAP integration synchronizes your LDAP groups and teams with your Grafana instance, providing easier access and user management.
Enterprise support
2-hour critical response for emergency inquiries
Emergency inquiries are defined as software deficiencies that impact product performance and delivery of Grafana.
Long-term support
Ensure that your deployed version of Grafana gets long-term support for bug fixes and security updates.
Indemnification
Protection and peace of mind about offering Grafana as a critical service within your organization.
Features comparison
Grafana open source | Grafana Enterprise | ||
|---|---|---|---|
Plugins| Connect to popular commercial databases and web services | |||
Community plugins Plugins created by the Grafana community | |||
Grafana Labs free plugins Plugins created by the Grafana Labs team | |||
Enterprise plugins Unlimited access to official Enterprise Plugins from Grafana Labs, which include Splunk, New Relic, AppDynamics, Oracle, Dynatrace, ServiceNow, DataDog |
| ||
Plugins platform Tooling, documentation, and components to create plugins | |||
Collaboration and usage| Tools to align and analyze your distributed teams | |||
Presence indicator See who else is looking at the same dashboard |
| ||
Dashboard insights Details on daily query counts, error count, view count, and all activities from recent users |
| ||
Dashboard search Sort dashboards to find unused, broken, and most-viewed dashboards |
| ||
Reporting Automatically generate PDFs from any dashboards and have it emailed to interested parties on a schedule |
| ||
Custom branding Replace the Grafana brand and logo with your own corporate brand and logo |
| ||
Export as dashboard Generate PDFs from any of your dashboards and save it to file |
| ||
Training and pro services| Custom trainings and access to Grafana Labs experts | |||
Unlimited expert support Ticket support |
| ||
Custom training & workshops Choose a prepared course or craft a custom training specifically for your team. Virtual and on-site visits are both available. |
| ||
Access to Grafana Labs experts Consulting from the company founded by the original developers of Grafana, Loki, Cortex, and Prometheus |
| ||
Support with observability efforts Dedicated technical account management |
| ||
Roadmap assurance Work with us to accelerate new features and functionality to shape the future of Grafana |
| ||
Security and authentication| Secure access and better data protection | |||
Dashboard/folder permission Add and assign permissions to specific users and teams | |||
OAuth Configure many different OAuth2 authentication services with Grafana | |||
LDAP Allows Grafana users to log in with their LDAP credentials | |||
Enhanced LDAP Integration to synchronize LDAP groups and teams with your Grafana instance |
| ||
Active LDAP synchronization Configure Grafana to actively sync users with LDAP servers in the background |
| ||
SAML Allows Grafana users to log in by using an external SAML 2.0 Identity Provider (IdP) |
| ||
Team sync Set up synchronization between your auth providers teams and teams in Grafana |
| ||
Data source permissions Grant and restrict access for users to query a data source |
| ||
Role-based access control Add or remove detailed permissions from Viewer, Editor, and Admin org roles, to grant users access to Grafana |
| ||
Enterprise support| Expert support with SLA | |||
Critical response SLA If you get woken up at 3 a.m., you can count on our help to get Grafana operational again |
| ||
Long-term support Ensure that your deployed version of Grafana gets long-term support for bug fixes and security updates |
| ||
Indemnification Protection and peace of mind about offering Grafana as a critical service within your organization |
|
Case study

Solution
84.51° needed a way to combine and standardize product and infrastructure metrics across all products and display them in one place.
Impact
Grafana has led the company on the path toward a centralized metrics program with dashboards that erase the need for people to “manually spend multiple hours and days trying to pull data to tell a story.”

It was really easy for me to get the cost justification to go with Grafana Enterprise. This will enable us to pull the data we collect from various sources right into customized Grafana dashboards, giving the holistic story in a one-stop shop.
– Erin O’Brien,
Lead Service Manager, 84.51°
Resources
Top 4 reasons customers buy Grafana Cloud and Enterprise
5 ways to get your company to buy Grafana Enterprise
6 reasons why the largest companies in the world are adopting Grafana Enterprise
How we differentiate Grafana Enterprise from open source Grafana
