Synthetic monitoring for a seamless user experience
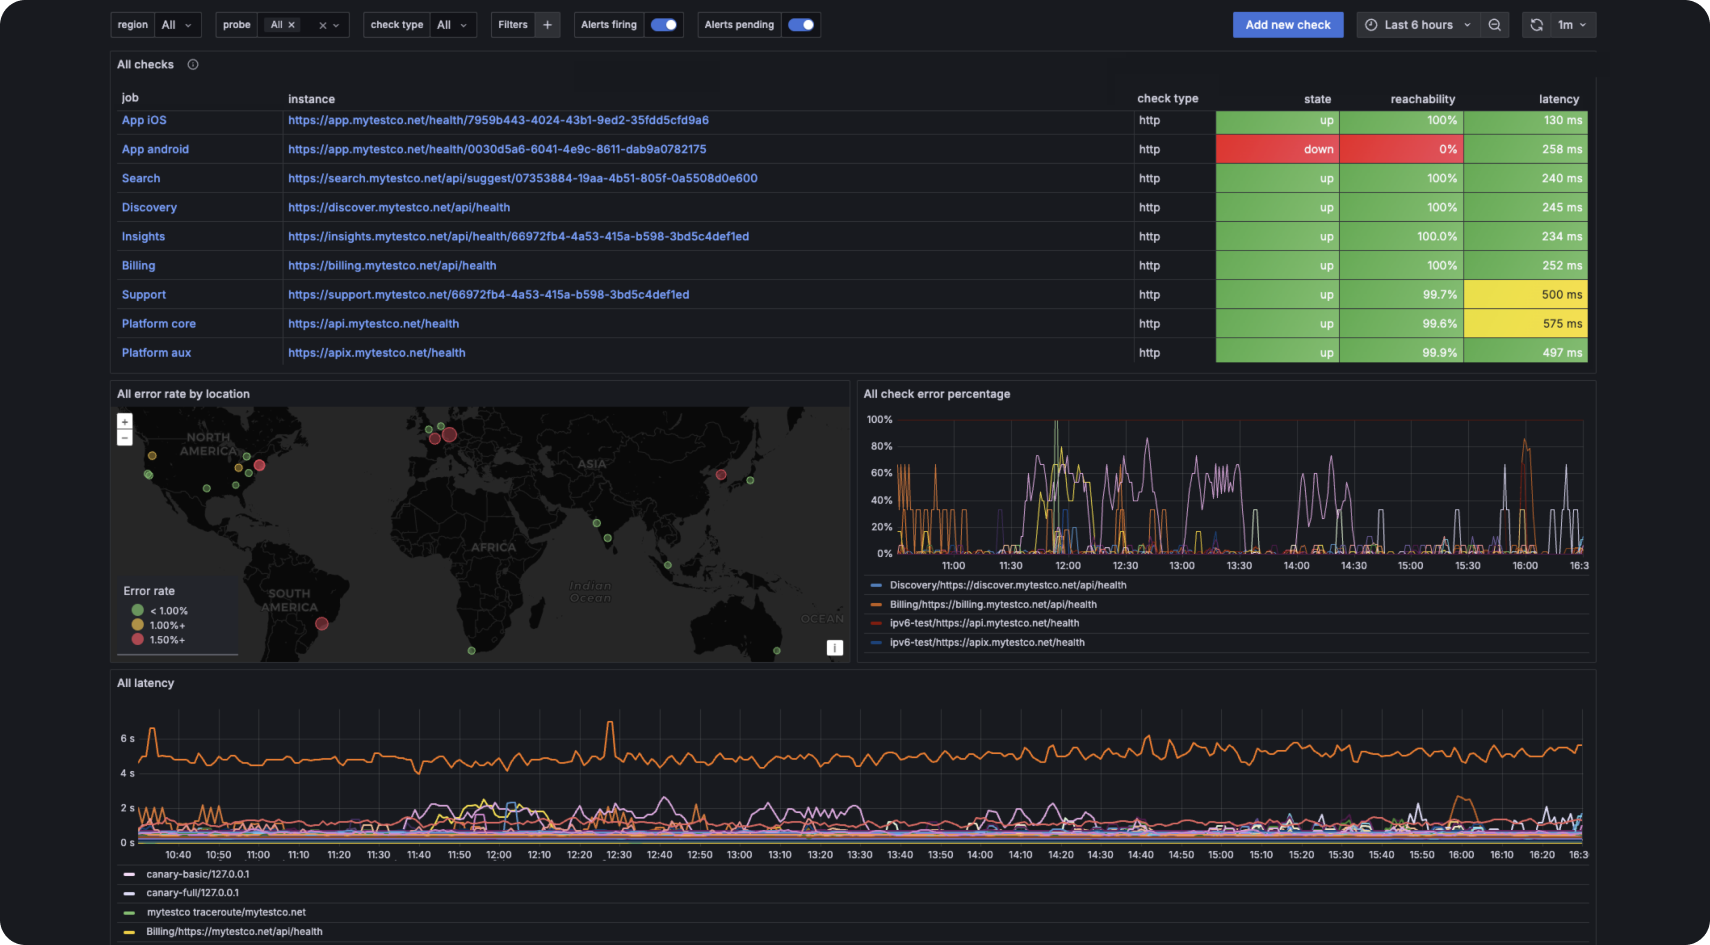
Grafana Cloud Synthetic Monitoring proactively monitors the performance of your APIs and web applications from the user’s perspective, testing the availability, health, and quality of your services around the world. Powered by Grafana k6, Synthetic Monitoring combines GUI-based and as-code monitoring to improve efficiency, collaboration, and application reliability.
The actually useful Grafana Cloud Free plan
- 100k test executions
- 50GB traces
- 10k metrics
- 50GB logs
- 14-day retention
- 3 active users
Stay on top of your SLOs
Proactively monitor the performance and uptime of your websites and APIs at various network levels around the globe, helping you track SLOs and SLAs.
Improve developer productivity
Streamline your workflow with automated synthetic monitoring. Use the same k6 scripts from pre-prod to production to improve collaboration and efficiency.
Reduce MTTR
Combine the user-friendly, prebuilt workflows with Grafana custom dashboarding for effortless triage, diagnosis, and issue resolution.
Why use Grafana Cloud for synthetic monitoring?
Validate the global user experience
- Send single or chained requests to verify the performance of your systems at various network levels: Ping, DNS, HTTP, HTTPS, and TCP checks.
- Simulate even the most complex user and transaction flows with accuracy and flexibility.
- Run checks from more than 20 Grafana managed probe locations around the world and gain visibility into your global user experience. Also use private probes to monitor internal-facing applications running behind a firewall.
- Activate prebuilt Prometheus-style alerts that track SLOs — all from the Synthetic Monitoring UI.
Synthetic monitoring as code
- Define your tests and synthetic checks in JavaScript, leveraging the k6 API. Reuse modules and JavaScript libraries to build and maintain your test suite.
- Use the same test scripts across teams for the entire software development life cycle. (No more silos!)
- Store monitoring resources in your GitHub repo alongside your application code.
- Automatically deploy and maintain checks via Terraform or the API.
Troubleshoot for faster MTTR
- Track key performance metrics of your websites and APIs (e.g., uptime, reachability, duration) with out-of-the-box workflows.
- Use PromQL-based query languages to query metrics or logs with Grafana Explore.
- Use generated metrics to create custom Grafana dashboards for detailed analysis and customized reporting.
- Correlate client-side data from Synthetic Monitoring with server-side metrics, logs, and traces in Grafana for fast debugging, regardless of where the data is hosted.


