Unlock the full potential of your metrics data
Find root causes faster
Correlate metrics with logs and traces to identify problems before they turn into disasters.
Control observability costs
Manage high cardinality data with prebuilt dashboards and gain insights into unused metrics.
Improve developer experience
Leverage observability-as-code tooling and create custom workflows to swiftly onboard teams.
Why scale metrics with Grafana Cloud?
High performance at any scale
Struggling with slow queries and sluggish dashboards at massive scale? Grafana Cloud Metrics, powered by Grafana Mimir, is built to horizontally scale and manage high cardinality data in cloud native infrastructures.
- 100% Prometheus-compatible with remote-write, PromQL, alerting, and a query builder to remove onboarding friction.
- The ability to browse Prometheus-compatible metrics via an intuitive, queryless experience using the Explore Metrics app.
- Sharded query engine for 10x improvement in query speed; scalable compactor for unlimited cardinality, tested up to 1 billion active series.
- High availability, durable storage, and support for out-of-order sample ingestion.
Optimize metric cardinality
Need to keep observability costs in check without compromising on reliability? Grafana Cloud Metrics’ cost optimization toolkit provides actionable insights so you can manage metric cardinality and usage.
- Visualize high cardinality metrics and labels with out-of-the-box cardinality analysis dashboards.
- Track and attribute metric volume to specific teams, services, or products through usage groups.
- Gain valuable insights to eliminate costly unused and partially used metrics.
Streamline your hybrid observability operations
Transitioning from legacy monitoring to cloud native? The Grafana Cloud Metrics backend supports multiple metrics formats, reducing time and money spent on operations and improving efficiency.
- Best-in-class Prometheus metrics ingestion and querying performance and scale.
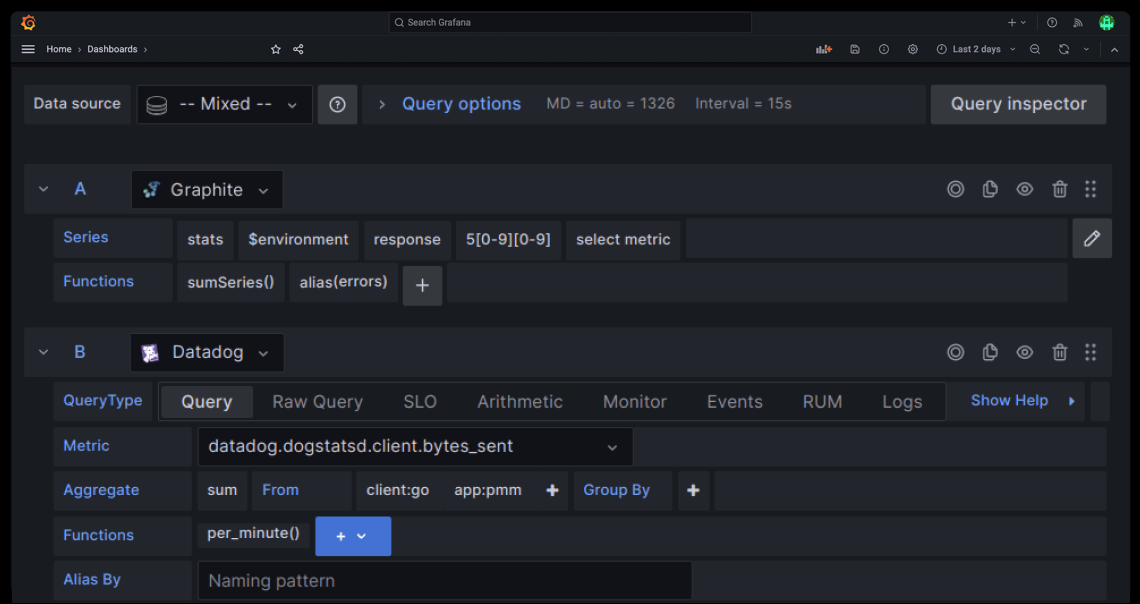
- Support for legacy and proprietary metric formats like Graphite, Datadog, and InfluxDB as well as modern, vendor-agnostic standards like OpenTelemetry metrics.
- Interoperability with any of these formats requires zero re-instrumentation of agents or application code.
Seamlessly expand your observability stack
Slowed down by managing different vendors for all your observability needs? The Grafana Cloud platform brings together metrics, logs, and traces with Grafana visualizations, along with performance testing, application observability, and incident response and management.
- Shift left with performance and load testing with Grafana Cloud k6.
- Monitor your infrastructure metrics and logs with out-of-the-box integrations for Kubernetes and commonly used software infrastructure.
- Improve incident response and resolution with Grafana Alerting, Grafana Incident, and Grafana OnCall.
Not ready for a fully hosted cloud observability solution?
Grafana Mimir
Open source, horizontally scalable, highly available, multi-tenant, long-term storage for Prometheus.
Grafana Enterprise Metrics
Self-hosted Prometheus service supported by Grafana Labs, for large organizations running at scale.


