Grafana Cloud in AWS Marketplace

Access and unify all your data in AWS with Grafana Cloud, the open and composable, fully managed observability stack.
Instant Kubernetes monitoring and more
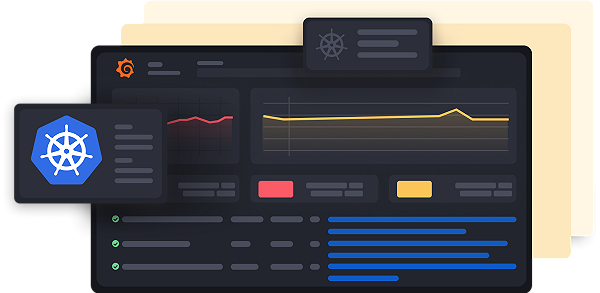
Grafana Cloud offers a complete Kubernetes solution that packages out-of-the-box metrics, logs, alerts, and prebuilt Grafana dashboards so you can easily get started with monitoring your Kubernetes fleets. There are also more than 50 curated infrastructure integrations available.
Benefits of using Grafana Cloud on AWS
All-in-one observability stack
Leverage a high-performance metrics backend compatible with Prometheus, Graphite, Datadog, InfluxDB, and OpenTelemetry, as well as logs, traces, performance testing, incident response management, and more.
Fully managed
Get instant upgrades, security patches, and backups for your observability stack so your teams can focus on actionable insights — not the upkeep.
Easy to get started
Deploy Grafana Cloud directly through AWS Marketplace to instantly start monitoring all your applications on AWS. Plus instantly connect to AWS data source plugins, including Amazon Athena, Amazon Opensearch, Amazon RedShift, AWS IoT SiteWise, Amazon Timestream, AWS IoT Twinmaker, and Amazon X-Ray.
Simplified billing
Consolidate your billing and apply AWS financial commitments towards your Grafana Cloud usage.


