
Automate, document, and learn from your incident management, all in Grafana Cloud
Grafana Incident, which is part of Grafana IRM, is an incident management tool that automates routine tasks so your team remains focused on resolving incidents (and improving on them) faster.
All the info you need, documented for you
Learn from comprehensive incident timelines to mitigate future problems. No matter when or where you declare an incident, you’ll capture all the crucial information, from start to finish.
Your single source of truth
No more scrambling to find the right information scattered across platforms. Centralize communication and avoid confusion during incidents.
Focus on what matters most
Automate manual administrative work so engineers can stay on task and remediate issues faster.
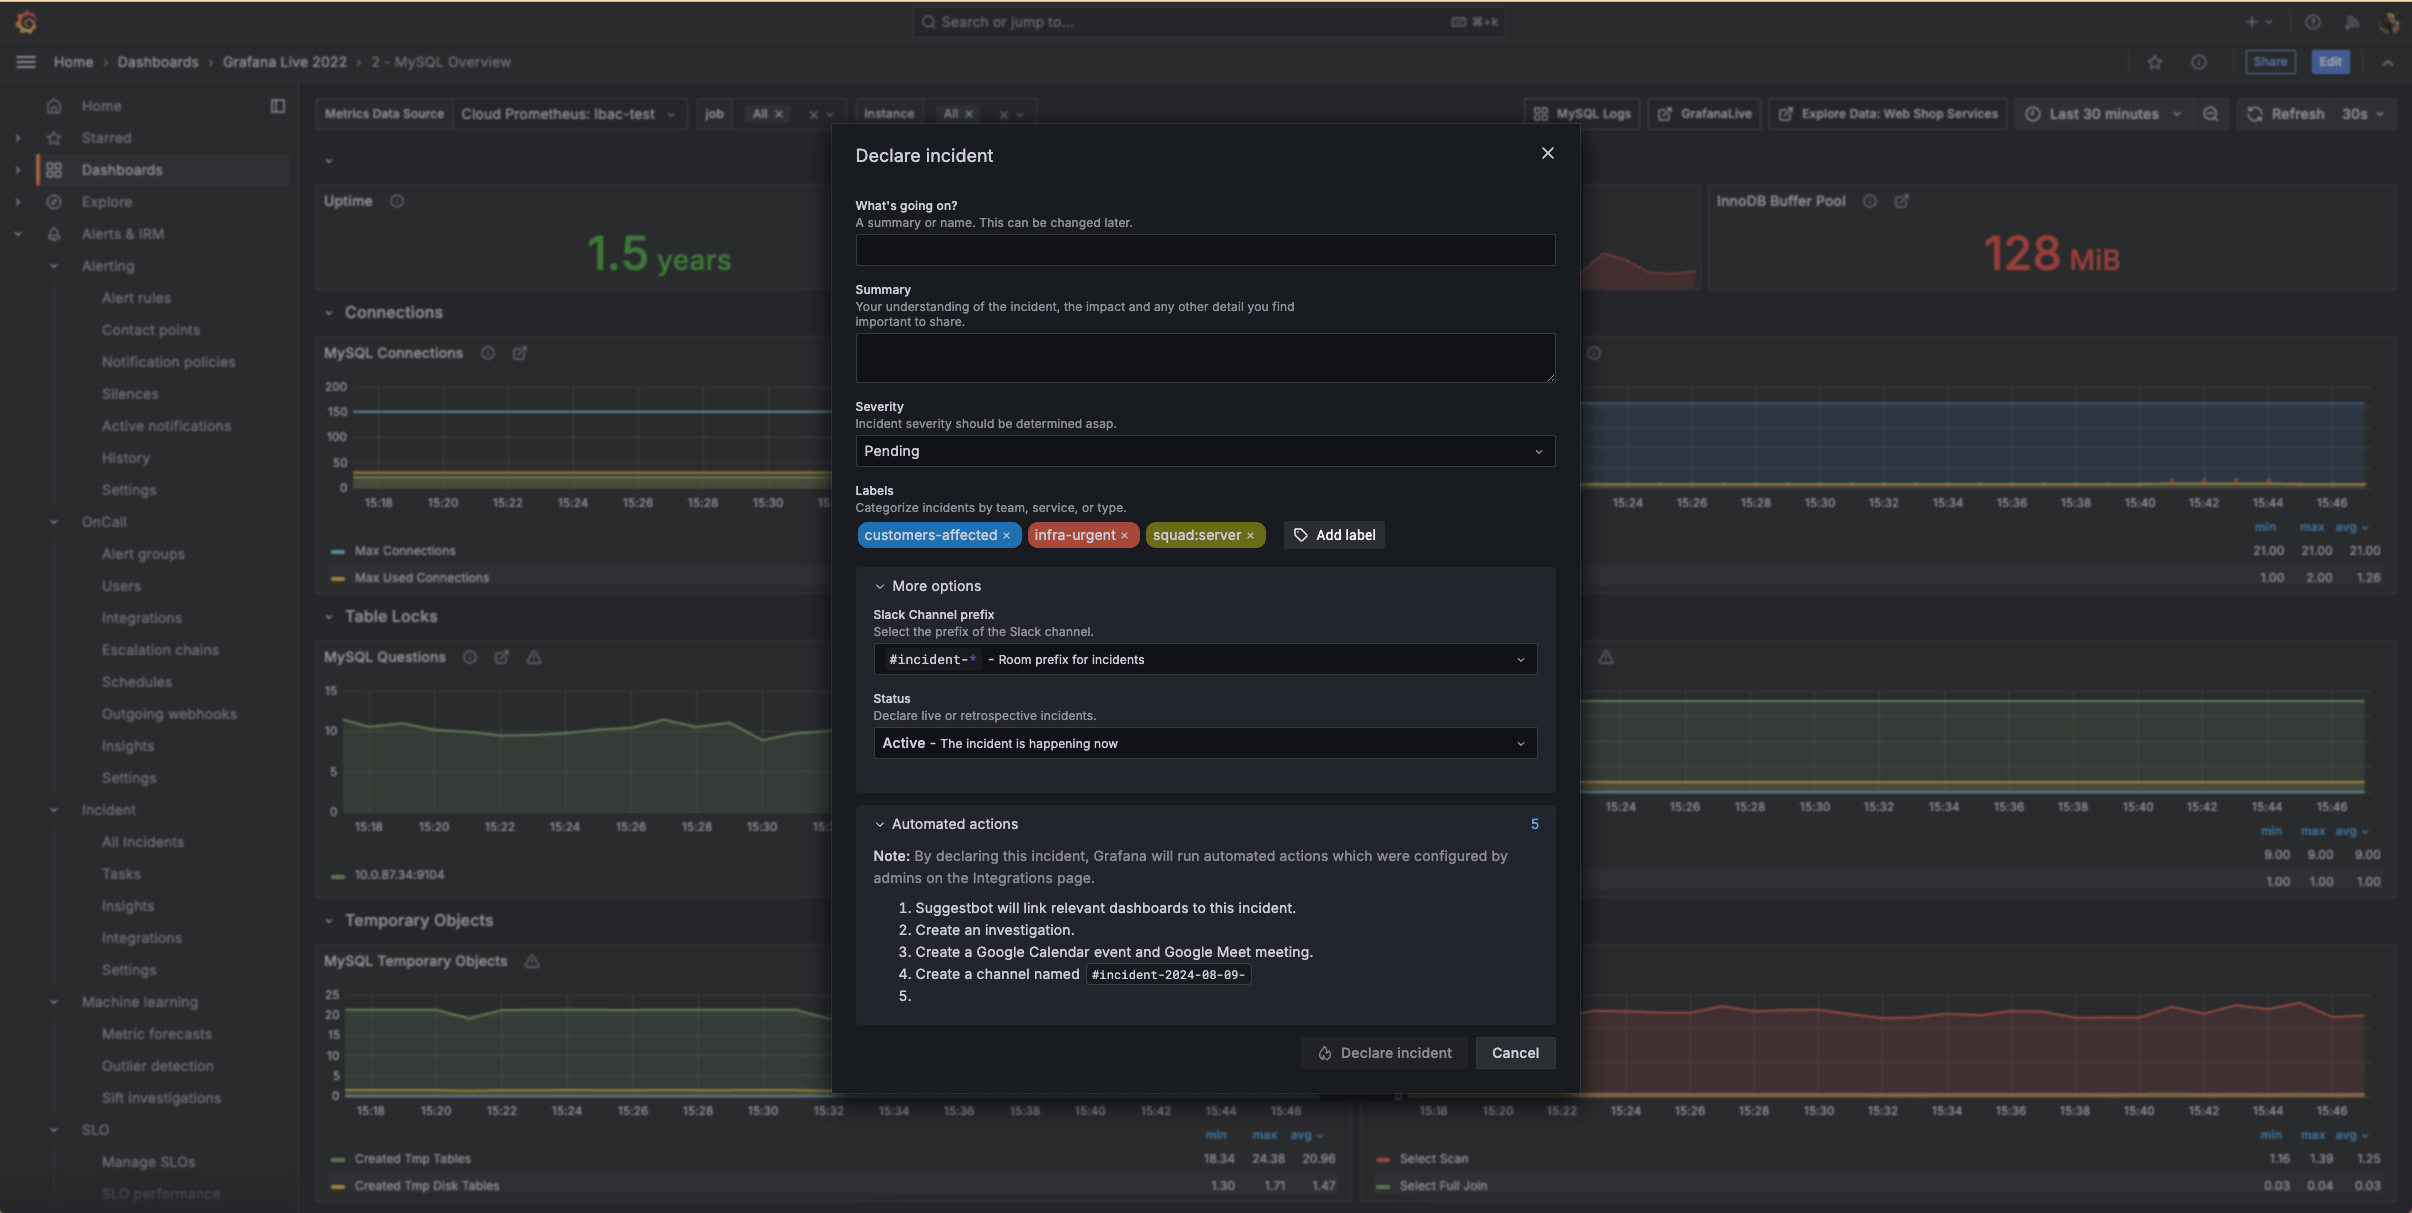
Declare incidents quickly and easily
You can trigger an incident from any Grafana visualization, the moment you find a concerning issue.
- Embed the right context, such as relevant dashboards and metrics, for responders.
- Assign appropriate severity levels when declaring an incident to prioritize response efforts, and invite participants to collaborate.
- Go from monitoring to active incident response within the Grafana ecosystem, and create incident channels and collaboration spaces directly from your visualizations.
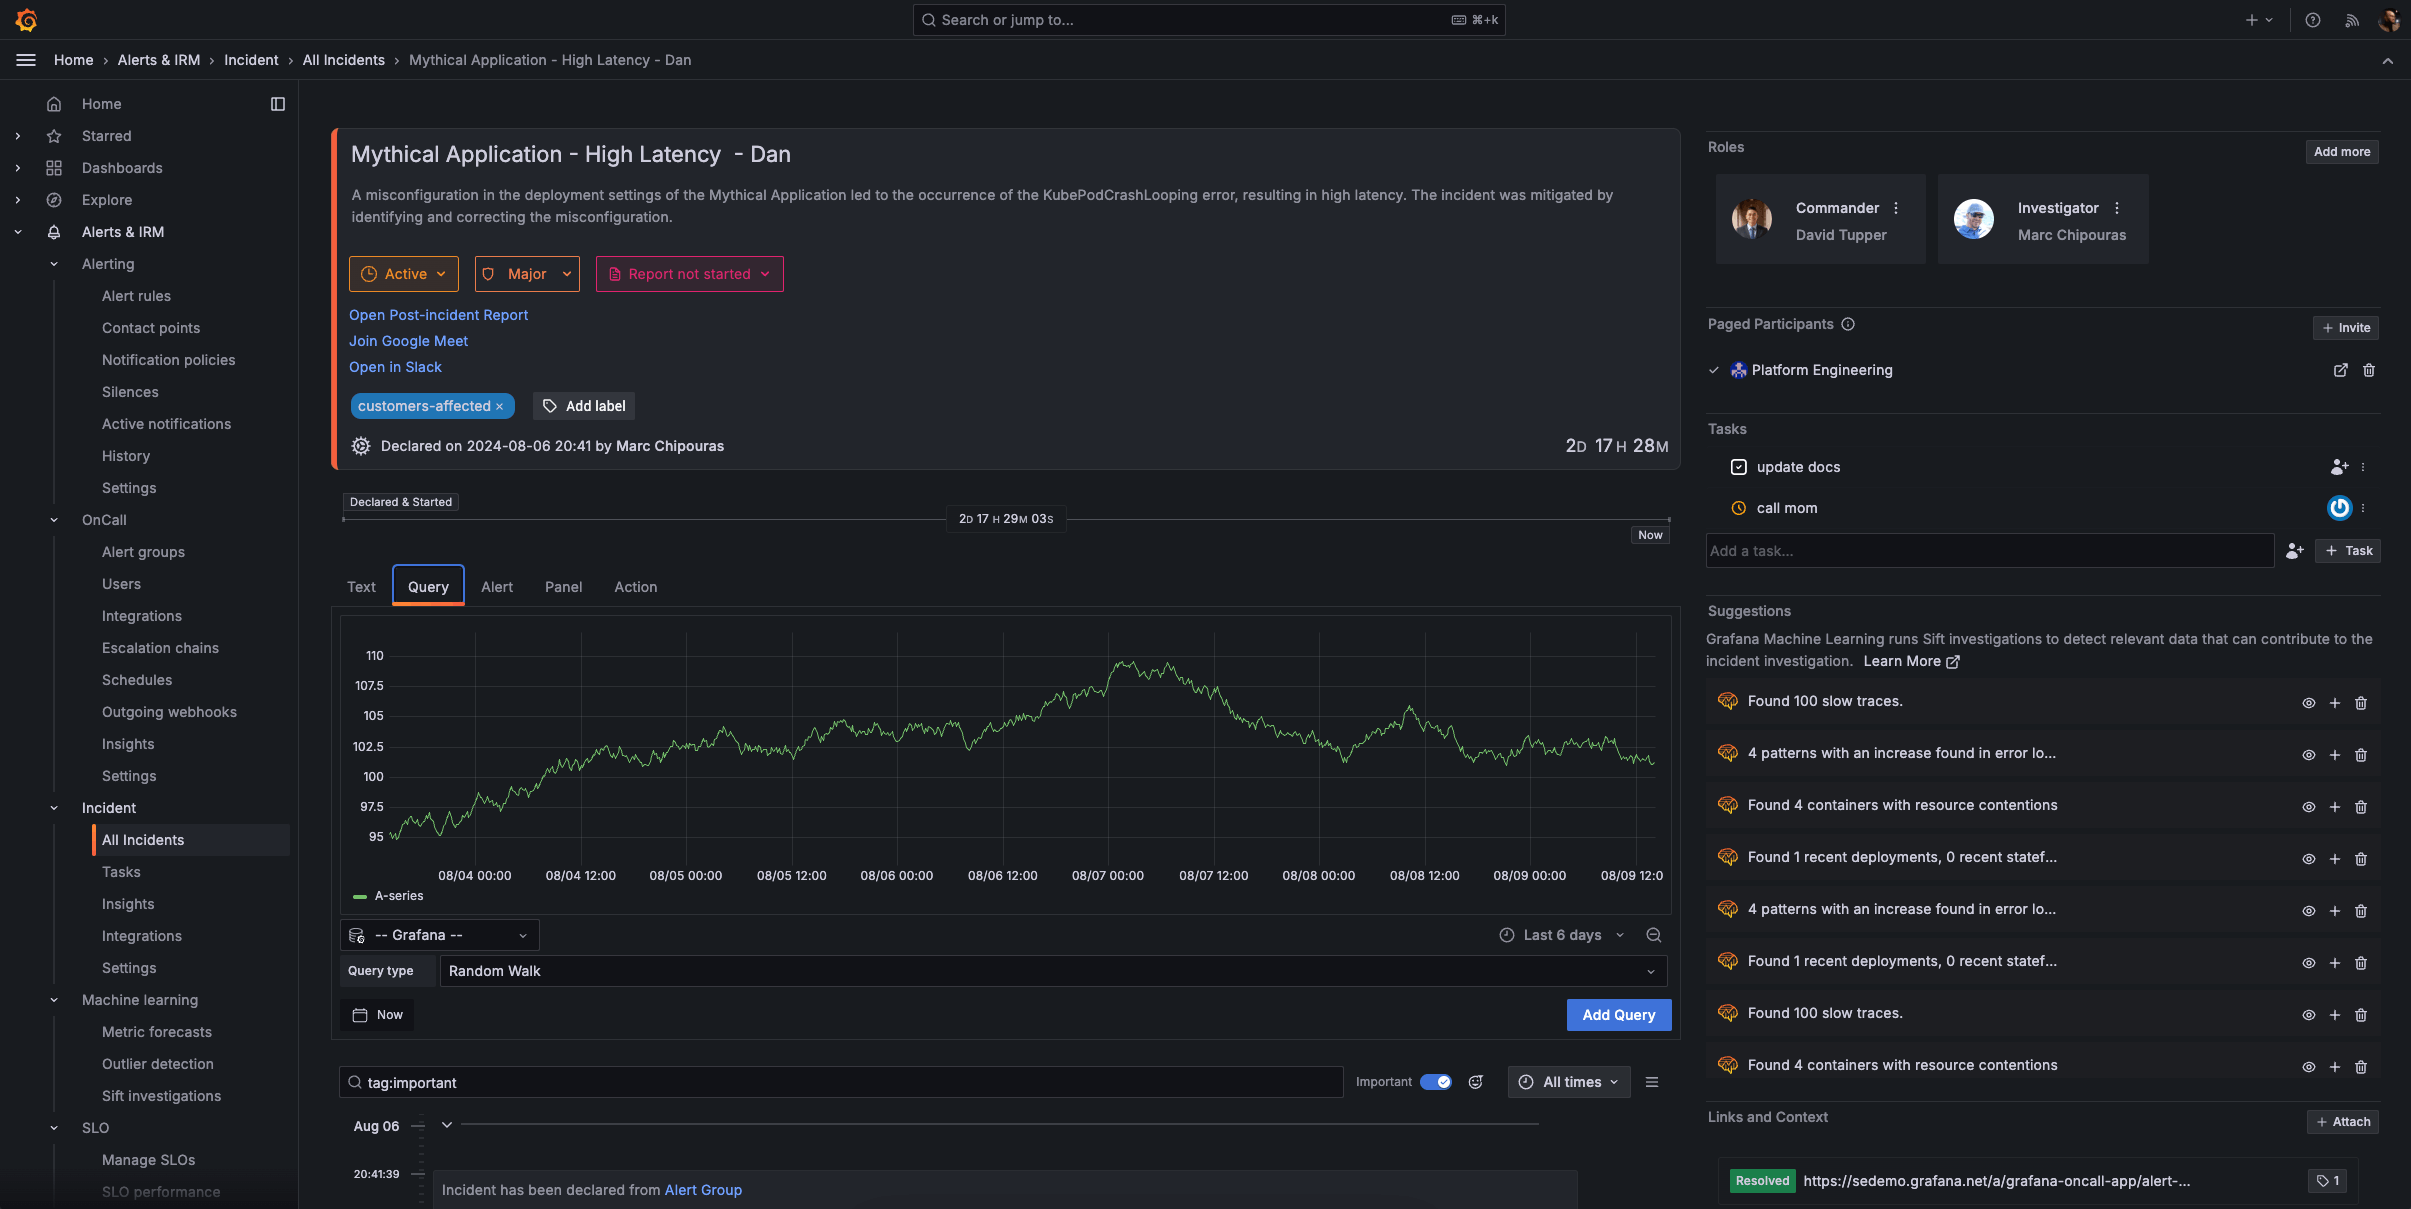
Document everything that matters
Automatically generate a single source of truth for each incident so you can better track ongoing events and improve future responses.
- Maintain a centralized record for each incident so all team members have access to consistent, accurate information.
- Capture key decisions and updates throughout the incident lifecycle, including relevant Grafana panels and critical Slack notifications.
- Automatically organize events, communications, and actions into a clear, chronological timeline to track the incident’s progression and response efforts.
- Convert the incident timeline into a structured post-incident review (PIR) document, and streamline the review process with pre-populated incident data and key events.

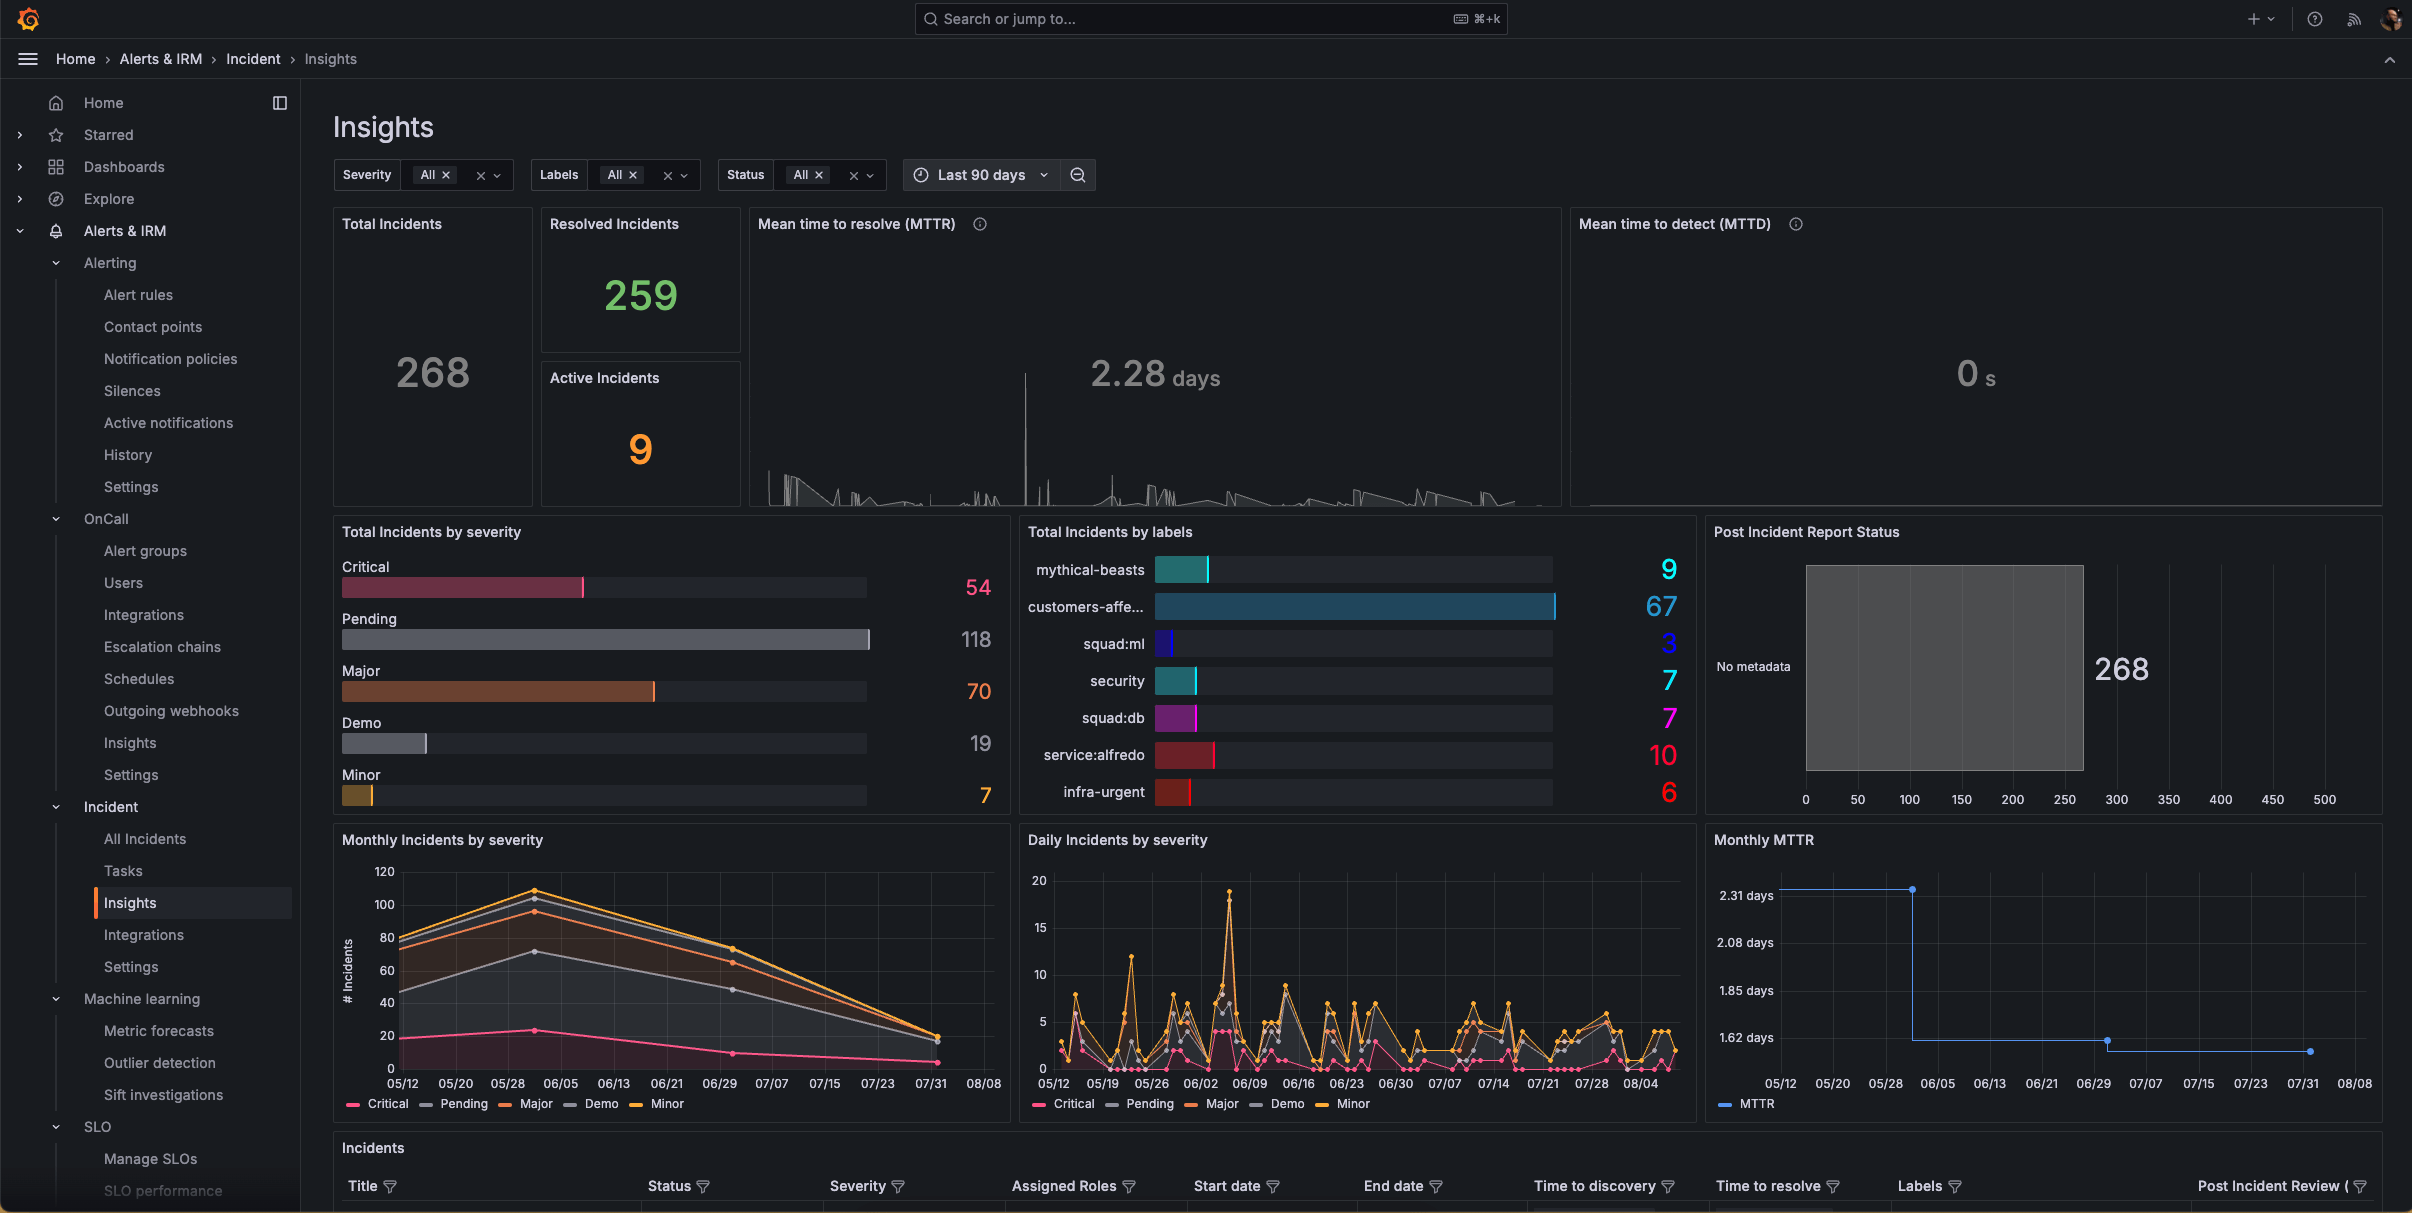
Analyze and improve your incident management operations
Get a comprehensive overview into your incident ops performance so you can continuously improve your processes with data-driven insights.
- Get a high-level view of your incident management workflows, and gain valuable insights into the trends and patterns in your incident frequency and resolutions.
- Track key metrics such as mean time to resolution (MTTR) and mean time to detection (MTTD), identify bottlenecks, and analyze performance by various dimensions, including label, severity, or status.
- Gather data on incident frequency and types to optimize your observability and response strategies.
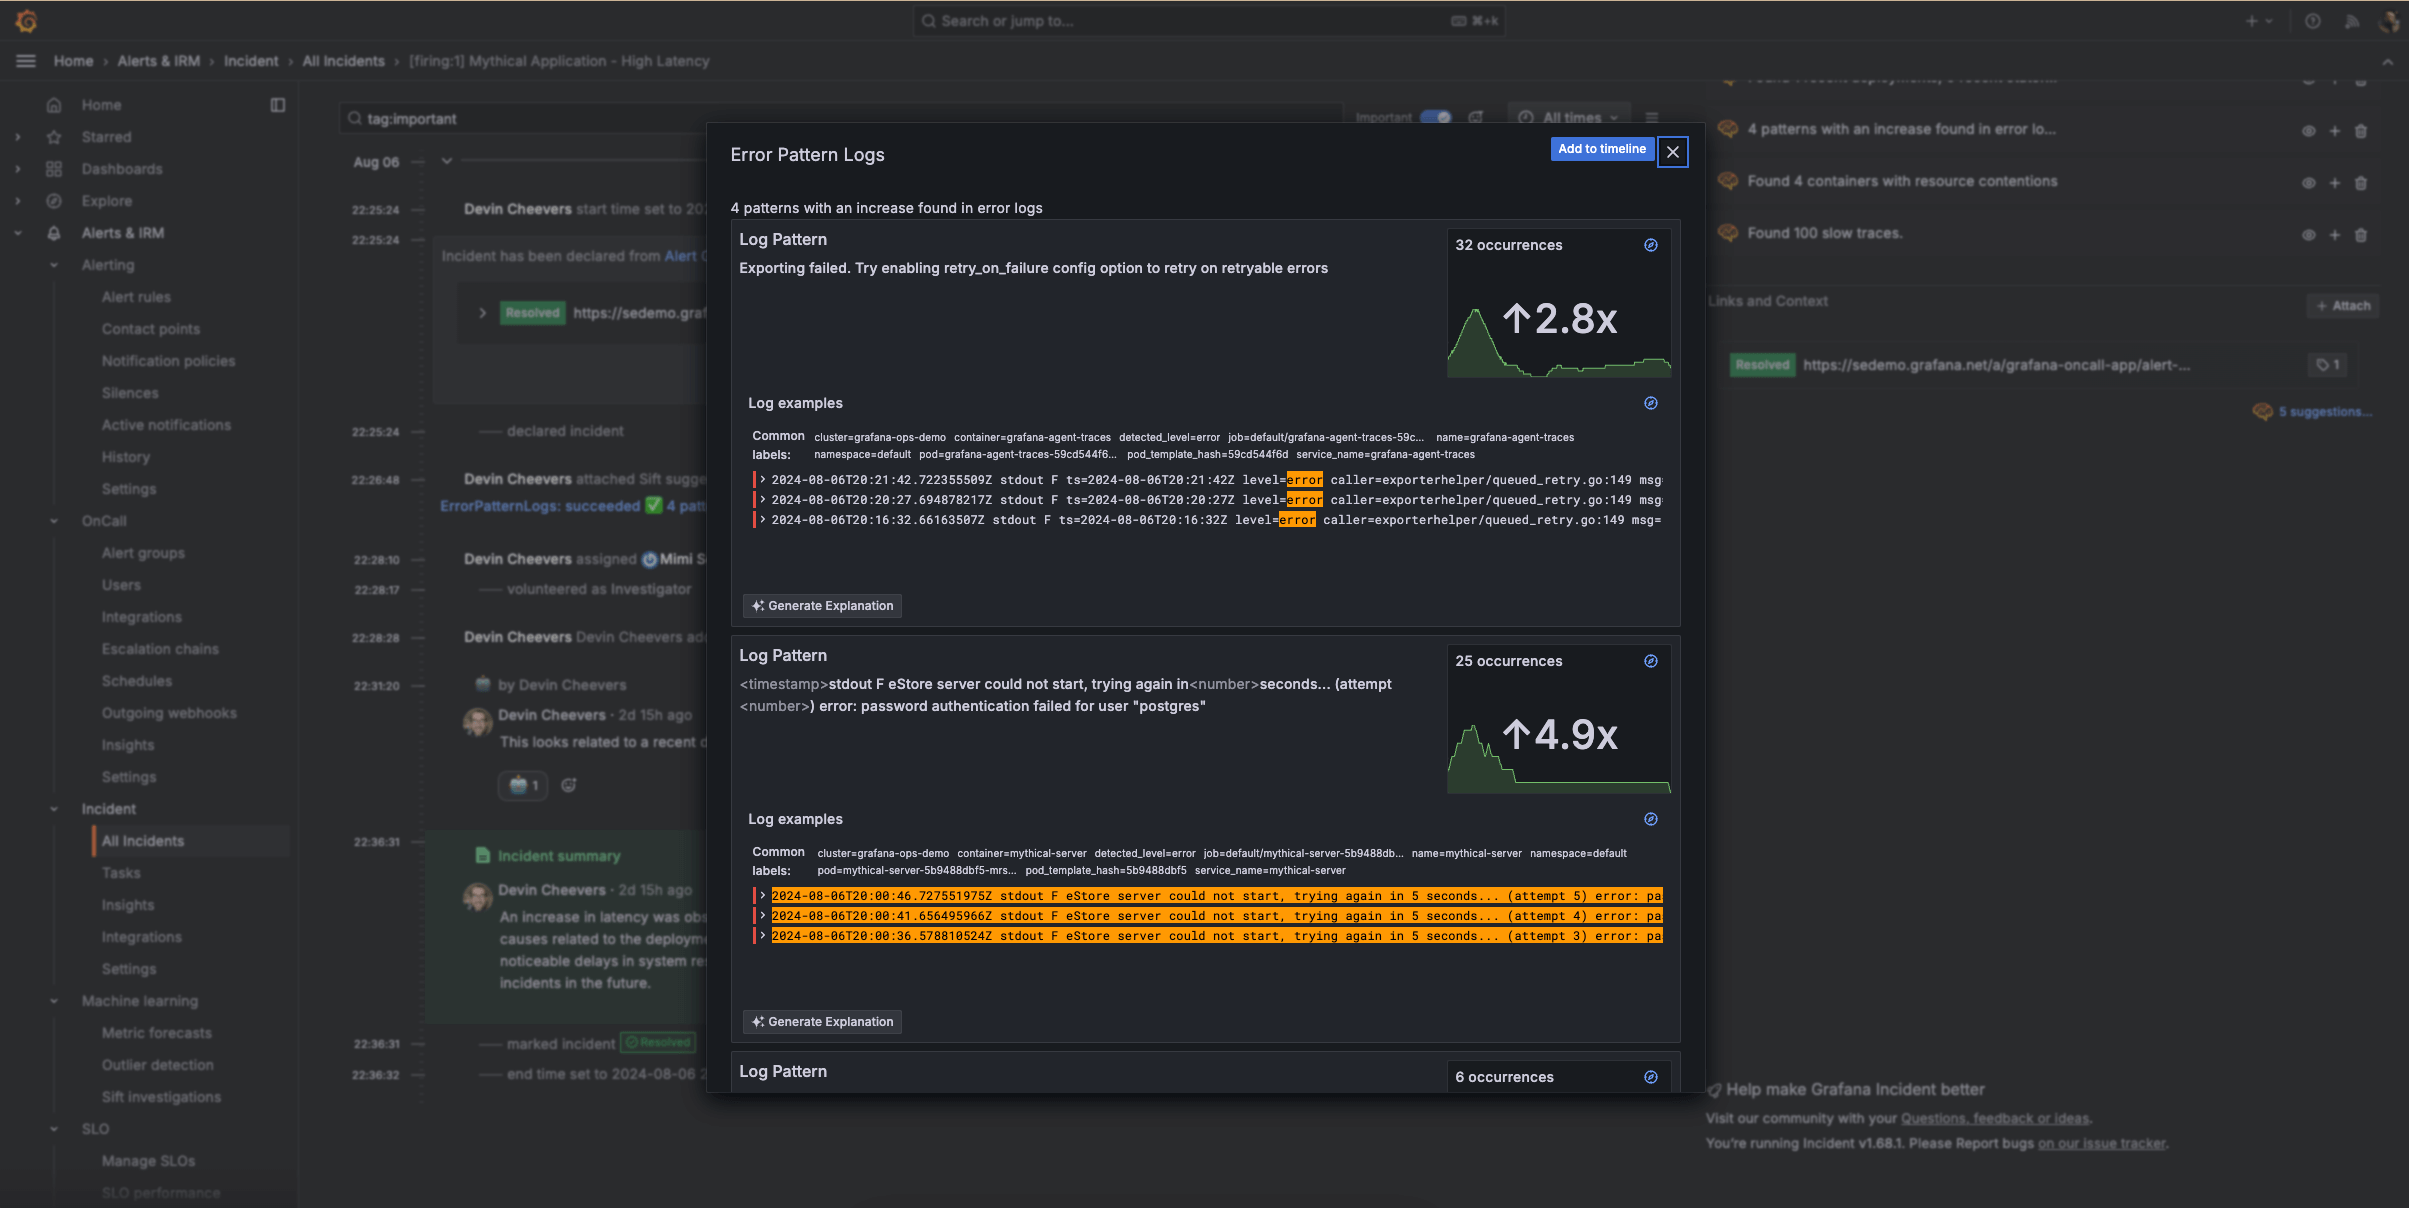
Reduce MTTR with machine learning
Surface problems to reduce MTTR and MTTD with Sift, a powerful diagnostic assistant in Grafana Cloud.
- Automatically scan metrics and logs to provide a holistic view of your system’s health, and correlate data from multiple sources to identify complex, interconnected issues.
- Begin an incident with a Sift Check and automatically gather relevant context and data to jumpstart the incident response process.
- Sift continuously improves its detection capabilities based on feedback and outcomes and adapts to evolving system behaviors and new types of issues over time.
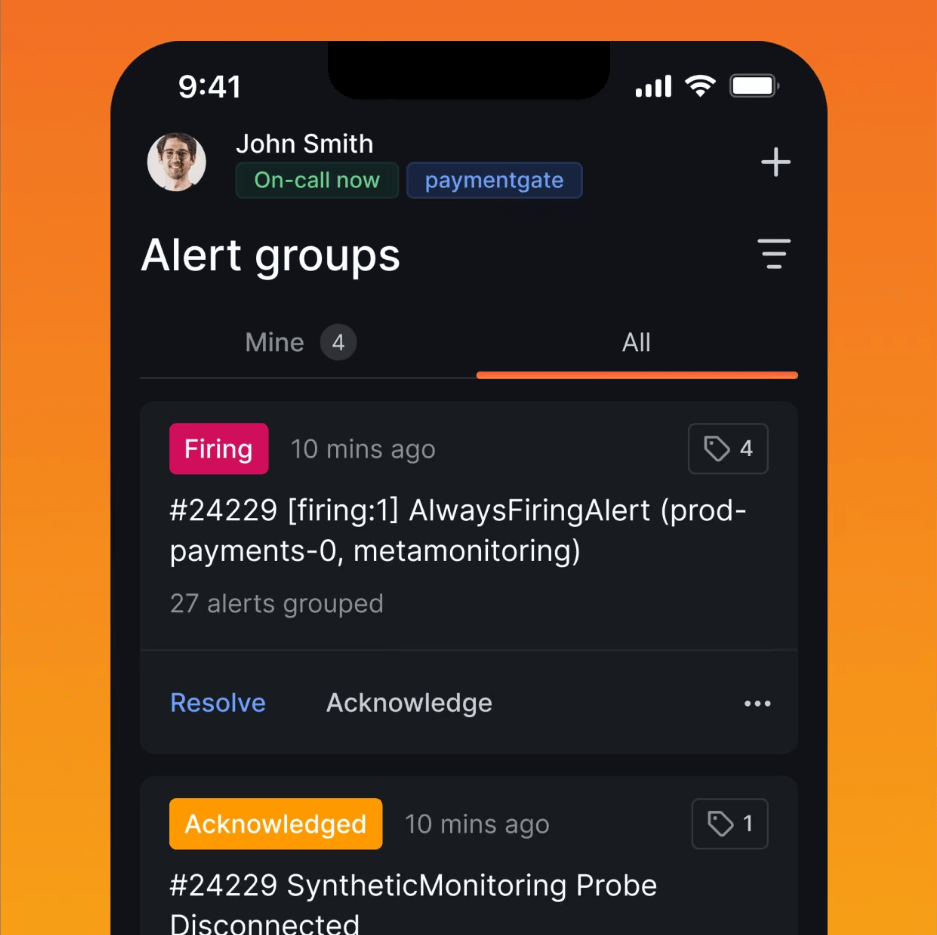
Incident response and management on the go
With the IRM mobile app, you can handle critical situations from anywhere.
Personalized notifications:
- Receive push notifications tailored to your personal preferences.
- Override “do not disturb” settings for critical emergencies.
On-call schedules at your fingertips:
- Review on-call rotation details anytime, anywhere.
- Quickly check upcoming shifts and team availability.
- Easily request shift swaps with your team.
Incident details on demand:
- Acknowledge, respond to, or escalate incidents directly from your mobile device.
- Access comprehensive incident information to make informed decisions.
Get started with incident response and management in Grafana Cloud
2
Connect tools (recommended)
Set up integrations to your favorite apps, such as Slack, where you can add the Grafana Incident chatbot to the relevant channel.
3
Configure notifications
Decide how each user will receive notifications and create escalations.
4
Set up on-call schedules and start declaring incidents
Establish on-call schedules within the UI and declare your first drill incident.
Get Grafana IRM in Grafana Cloud
Cloud FreeNo payment. Ever.
Cloud ProPay as you go
Cloud AdvancedPremium bundle
Helpful resources
Easily connect to more Grafana Cloud tools
Grafana Alerting
Unify alert management across your entire stack with powerful, flexible rules and notifications.
Grafana SLO
Define service level objectives and create error-budget alerts to catch issues before your customers do.