Log monitoring for faster troubleshooting at scale
- 50GB logs
- 14-day log retention
- 3 monthly active users
Aggregate any log data instantly
Go from collecting to querying logs in minutes without worrying about log format, schema, storage tiering, sharding, or indexing.
Log everything with efficient indexing
No need to pick and choose which logs to monitor. Keep all the logs you need while maintaining a small object storage footprint thanks to our novel approach to indexing.
Identify root causes faster
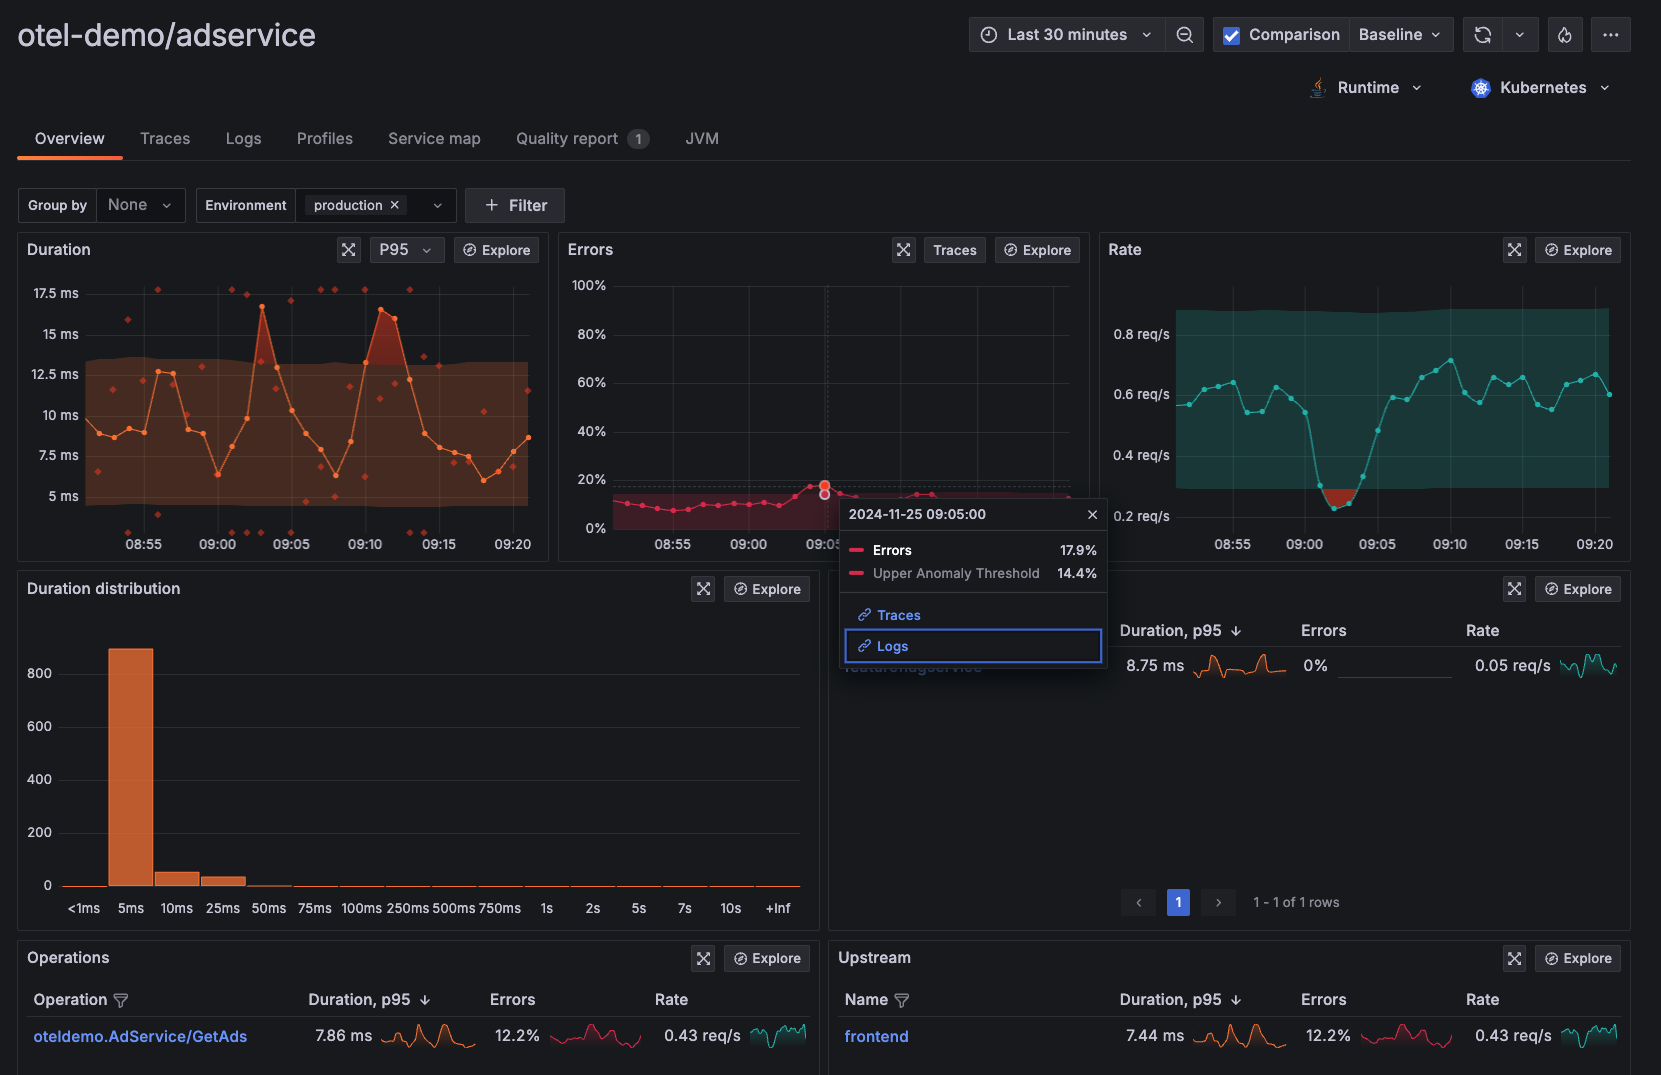
Correlate logs to metrics and traces for rapid troubleshooting when incidents arise — or even before they happen. View logs in real time as they are ingested, gaining rapid insights the instant a problem occurs.
Why use Grafana Cloud for log monitoring?
Keep your logs without breaking the bank
Smart cost management
Analyze, monitor, and optimize your logging spend with our centralized cost management hub. See more.
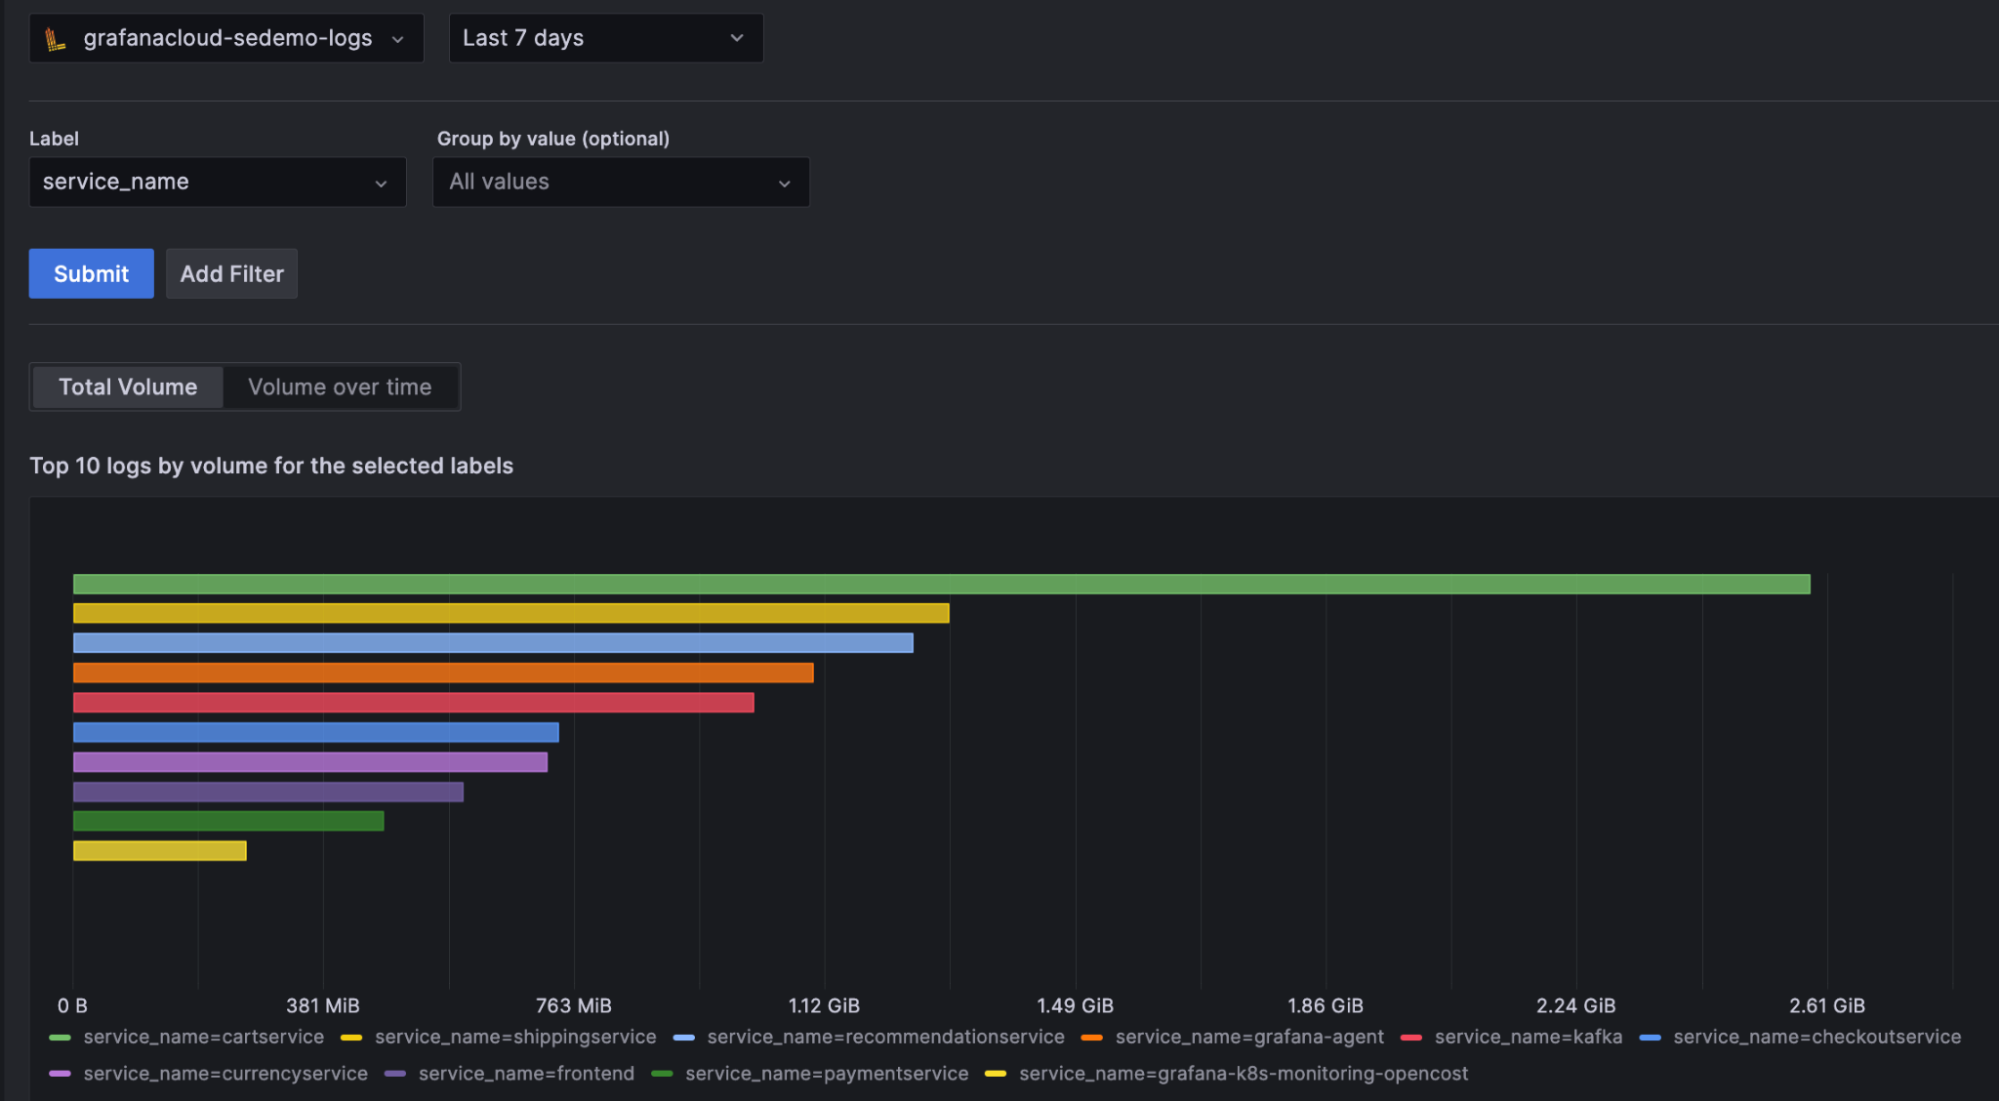
Log Volume Explorer
Identify high-volume logs easily and control costs by pinpointing the source. Watch a demo.
Adaptive Logs
Automatically filter out unnecessary logs to focus on what matters most — without compromising visibility. Read more.
Route logs to additional storage options
Export logs to external object storage at no extra cost to meet compliance and archiving needs. Learn more.
Performance that won’t quit
Whether you’re dealing with massive data bursts or out-of-order ingestion, Grafana Cloud Logs is built to keep up. Enjoy consistently fast performance without the headache.
Scalable and reliable architecture
Powered by Grafana Loki, Grafana Cloud Logs is horizontally scalable, highly available, and highly performant. Watch Loki in action.
No more lost logs
Built to handle bursts and out-of-order ingestion, ensuring data integrity at any scale.
Accelerated querying
Run faster queries using label selectors, line filters, and time-range optimizations to narrow down searches, cutting through log data with precision and efficiency. Tips to improve query performance.
Bring your logs and metrics together for instant insights
Easy data correlation
Logs have the same metadata as metrics, simplifying onboarding and data queries. Watch a demo.
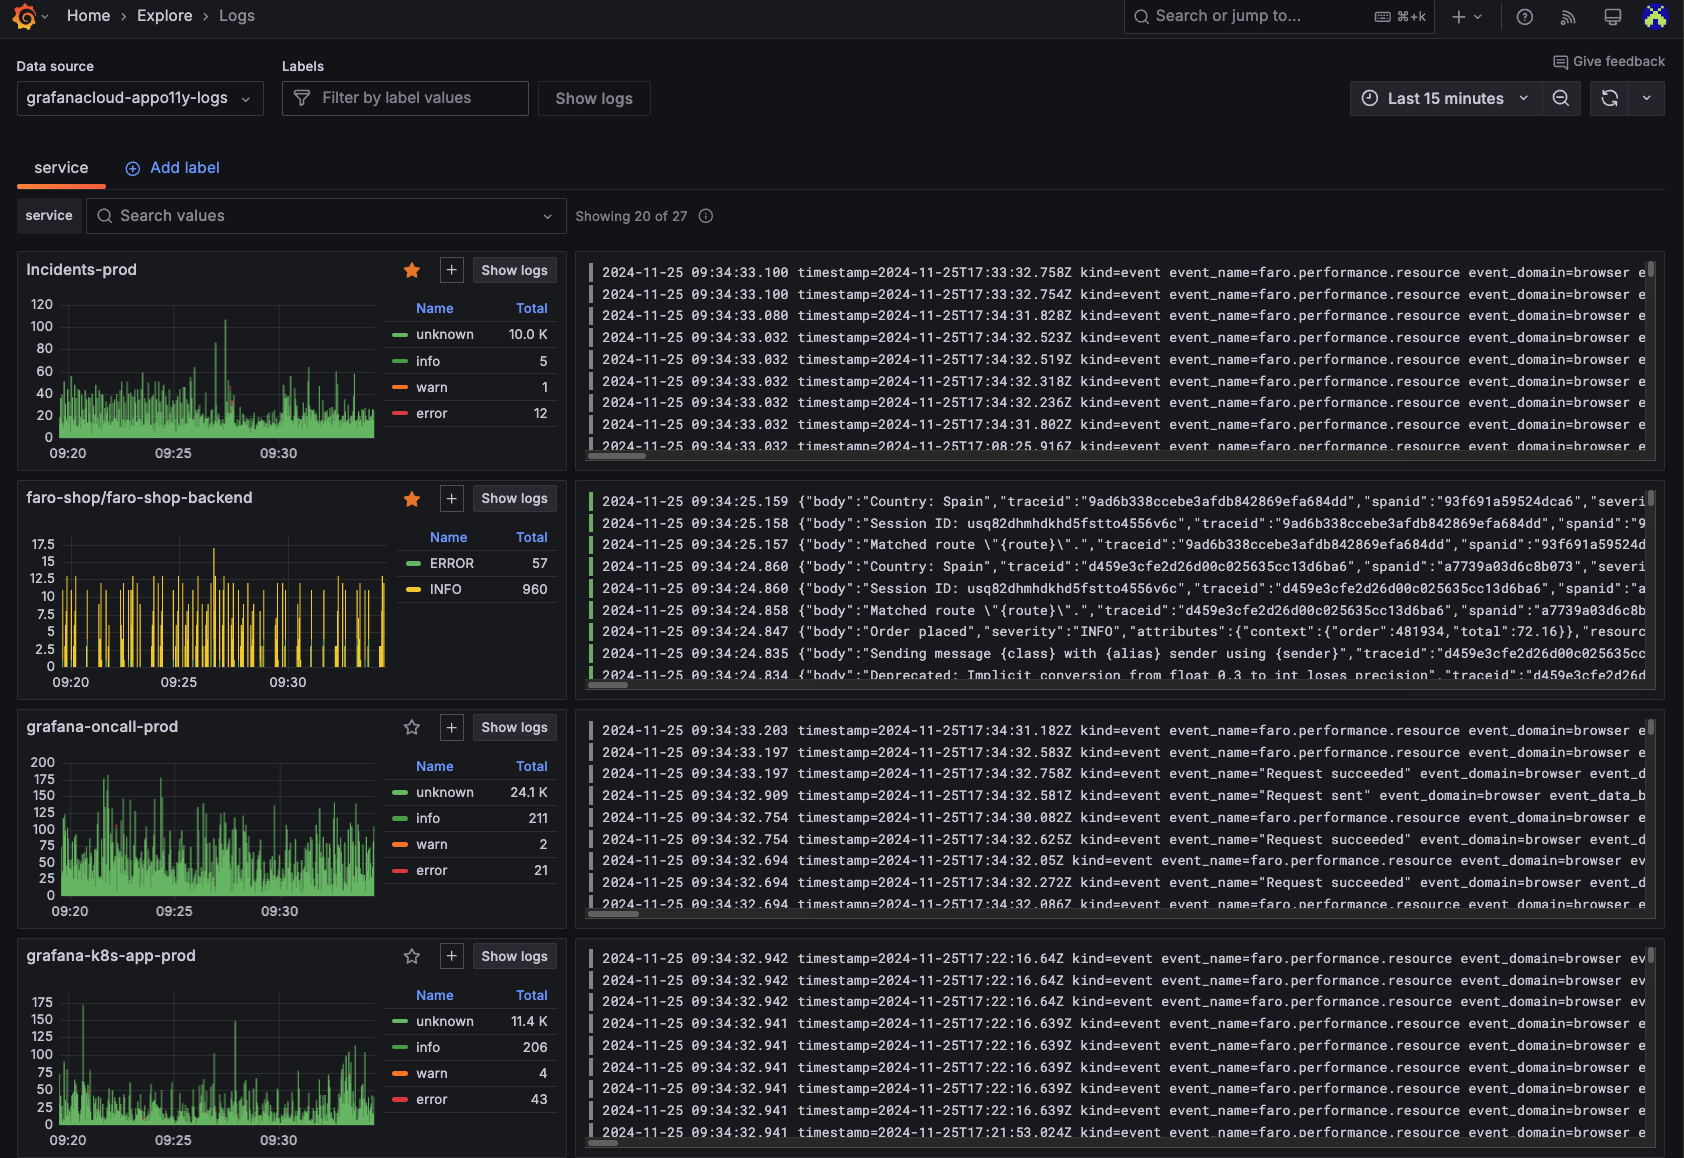
Explore without queries
Don’t want to learn another query language? No problem! Use our Explore Logs app to visualize your data without writing a single query. Learn about the Explore apps suite.
Native LogQL support
Leverage LogQL for complex queries, including field extraction, regex, and pattern matching. Learn about the query editor.
Metrics from logs
Generate metrics directly from logs to monitor anomalies, even in cases of high cardinallity or when metrics instrumentation isn’t possible. Read more.
Simple setup, powerful integrations
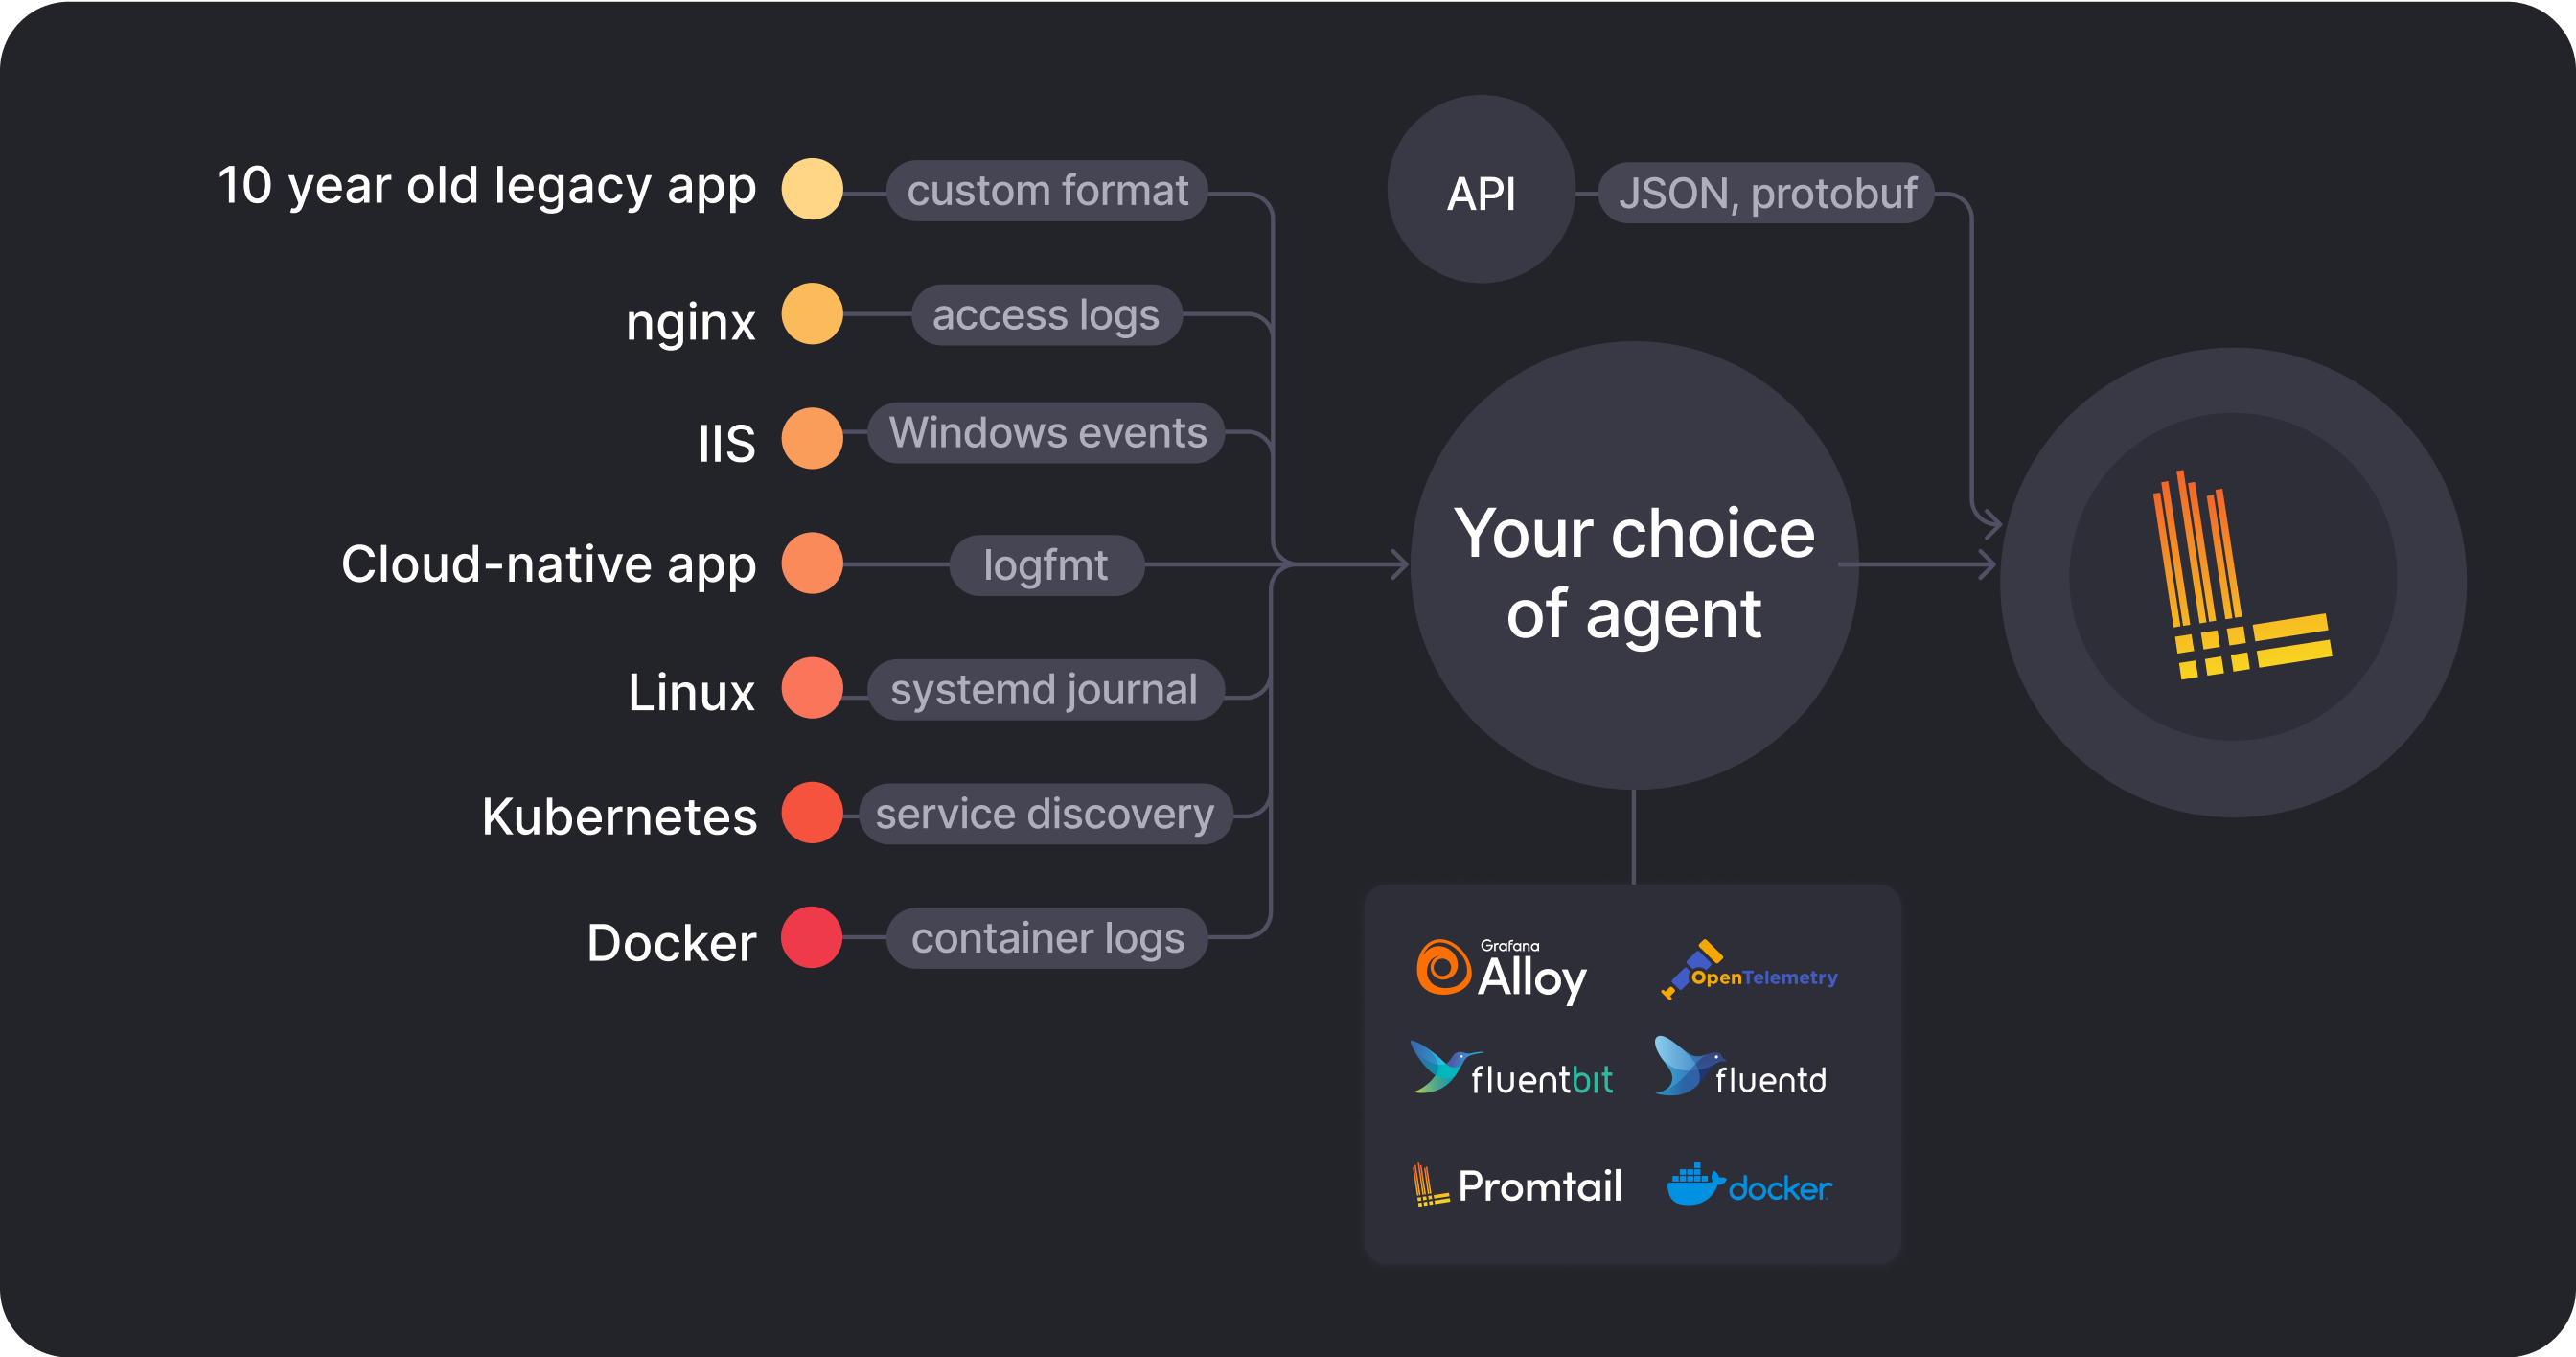
Building a scalable log system can be a chore. Grafana Cloud Logs aggregates logs from any source in any format — so you can focus on what’s important
Broad compatibility
Works seamlessly with Promtail, Fluentbit, Fluentd, Vector, Logstash, OpenTelemetry, Grafana Alloy, and more. See the list of clients.
Any format, any time
JSON, XML, CSV, logfmt, or unstructured text — all are welcome. Watch the video on log formats.
Data from all sources
Bring in logs from Kubernetes, Docker, AWS, GCP, Windows, and countless other sources. Learn how to send logs to Grafana Cloud.
Not ready for a fully hosted cloud-based observability solution?
Grafana Loki
Open source horizontally scalable, highly available, multi-tenant log aggregation system inspired by Prometheus.
Grafana Enterprise Logs
Self-hosted logging solution supported by Grafana Labs with a unique approach to log indexing, storage, and administration control.
Get started with log monitoring in Grafana Cloud
Cloud Free
Perfect for small teams that are just beginning their cloud native journey and don’t want to manage their log data.
- Up to 50GB lgos each month.
- 3 active monthly users.
- Always free. Never expires. Upgrade at any time.
Cloud Pro
Best suited for teams that are expanding their observability footprint, might not have a dedicated SRE team, and require greater scale and collaboration.
- Up to 100GB logs each month.
- 5 active monthly users.
Cloud Advanced
Best suited for teams who deal with massive scale, consider observability a critical service for business reliability, and will benefit from economies of scale.
- 100GB logs each month.
- 365x24x7 customer support with enterprise-level SLAs.


