Contextual, automated root cause analysis
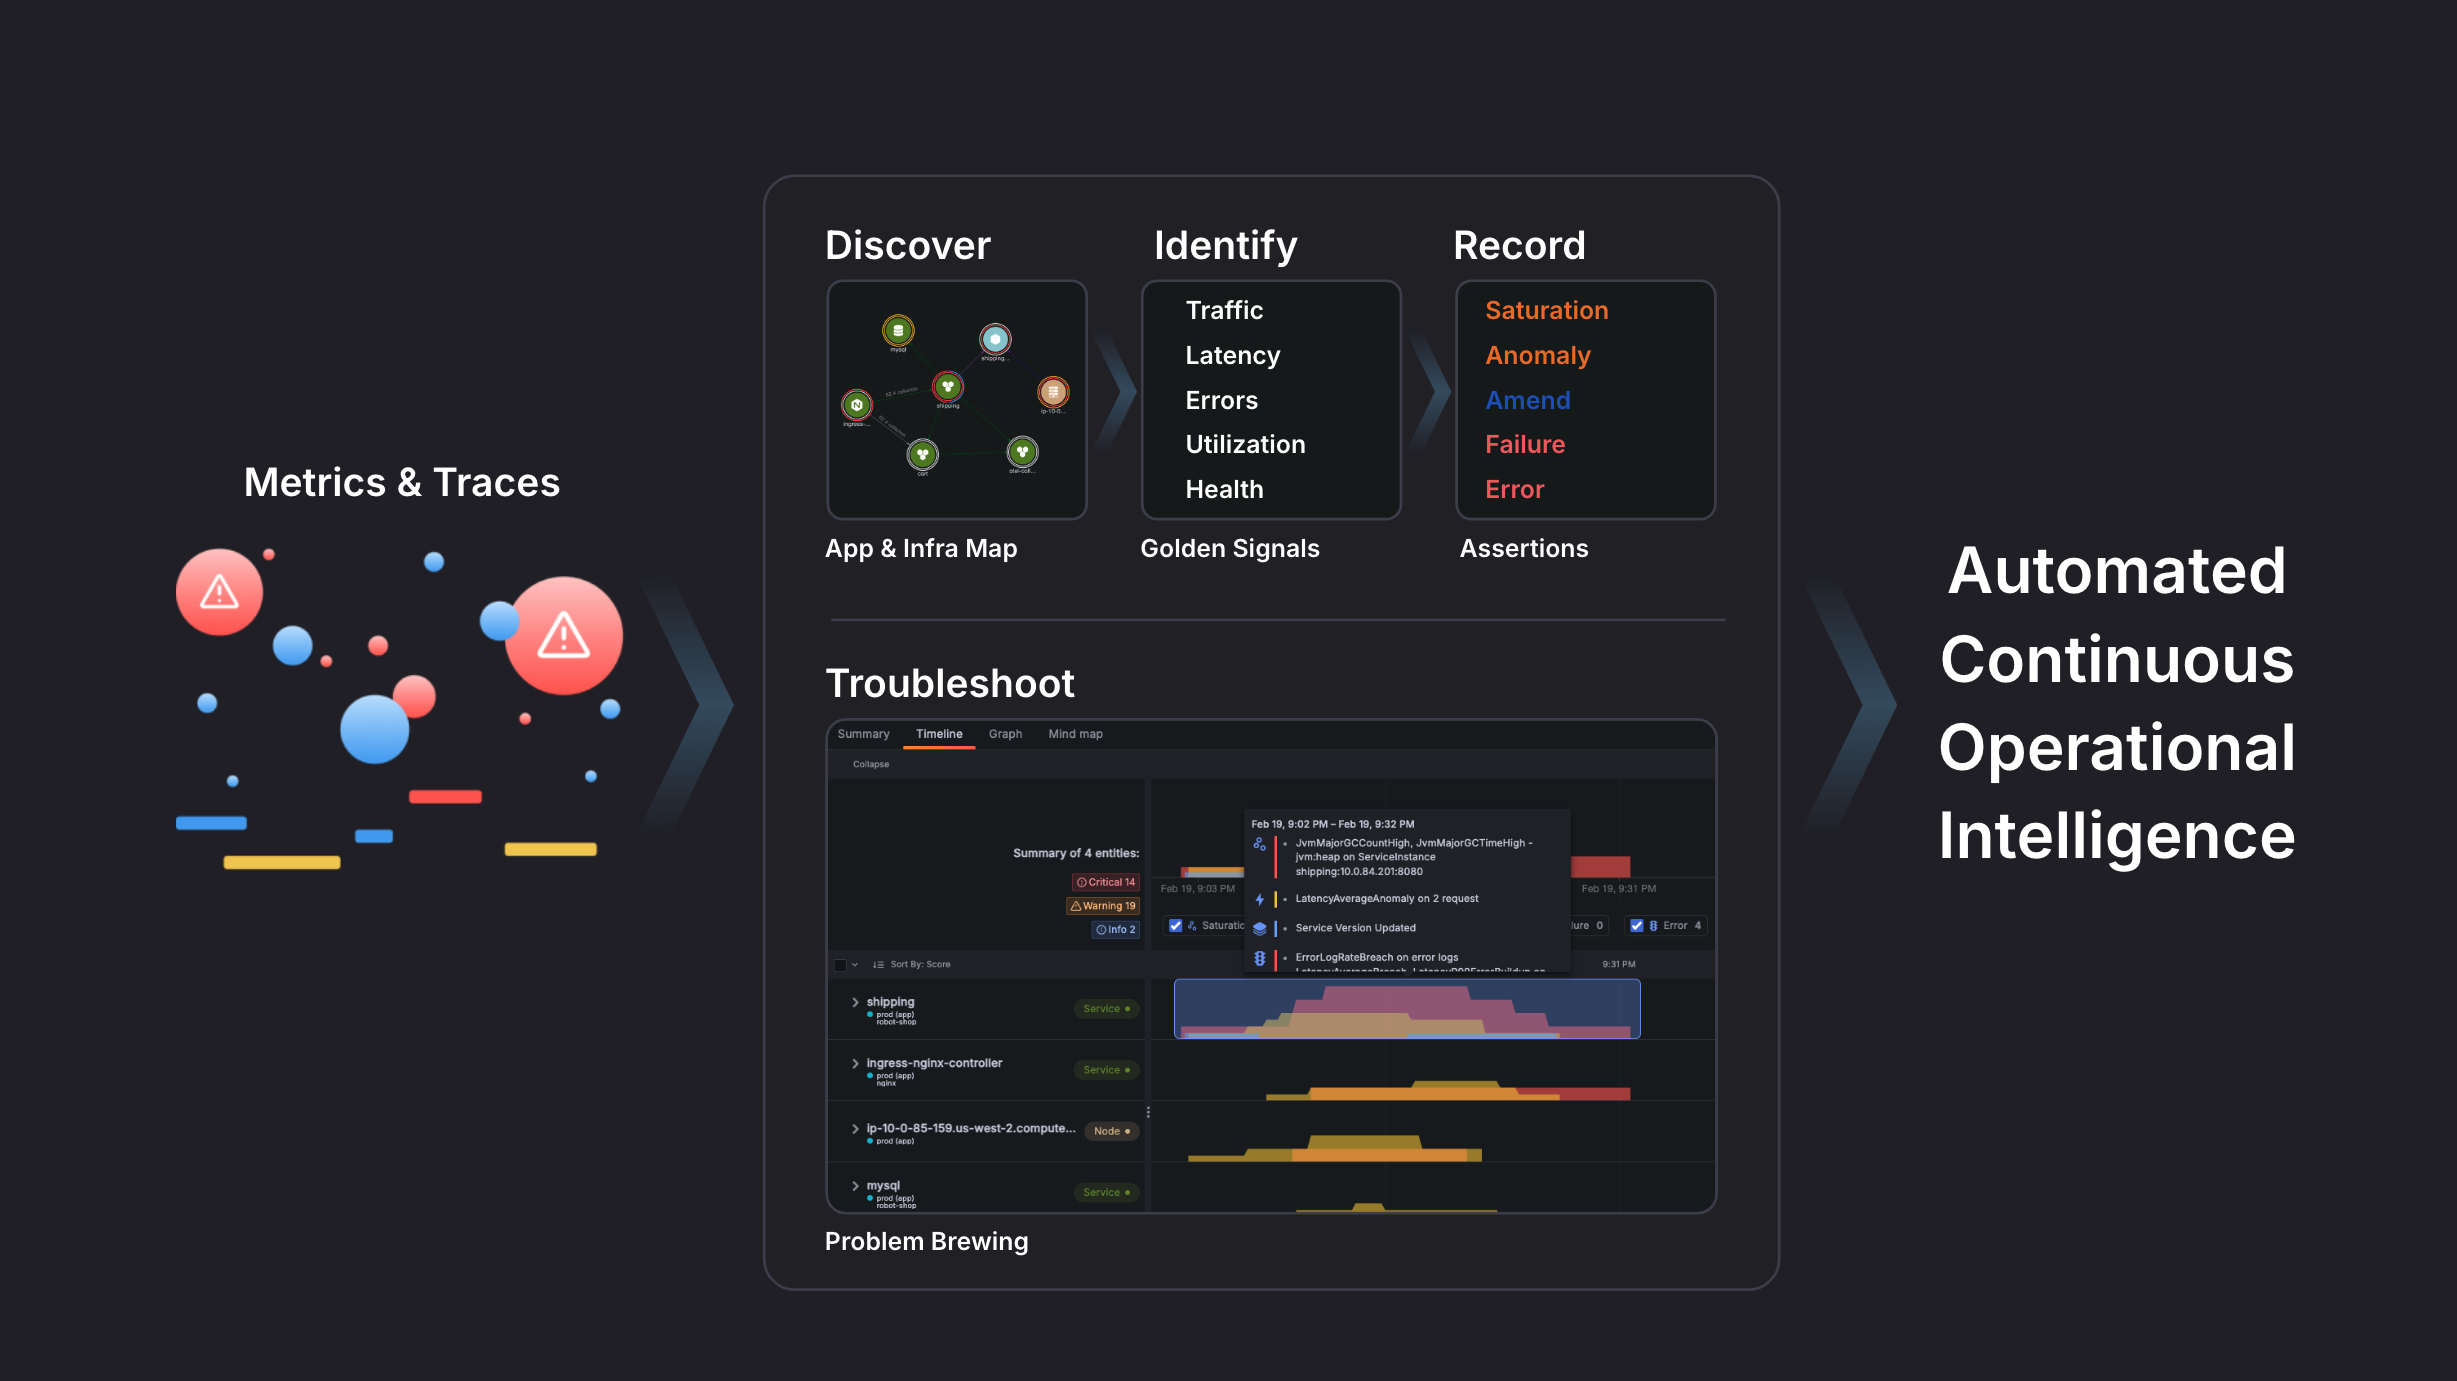
Grafana Cloud Asserts adds a contextual layer to your telemetry data to help you understand the behavior of your applications and services. When problems occur, Asserts leverages AI/ML to automate the process of correlating related issues and enables you to uncover root causes quickly.
Asserts is currently available to Grafana Cloud Advanced customers.
Faster troubleshooting
Automatically detect and correlate anomalies across the full stack to understand the causality chain.
Quickly identify problem domains
Easily determine where to troubleshoot first with a single view across all affected application services and underlying infrastructure.
Reduce toil by limiting the need for PromQL
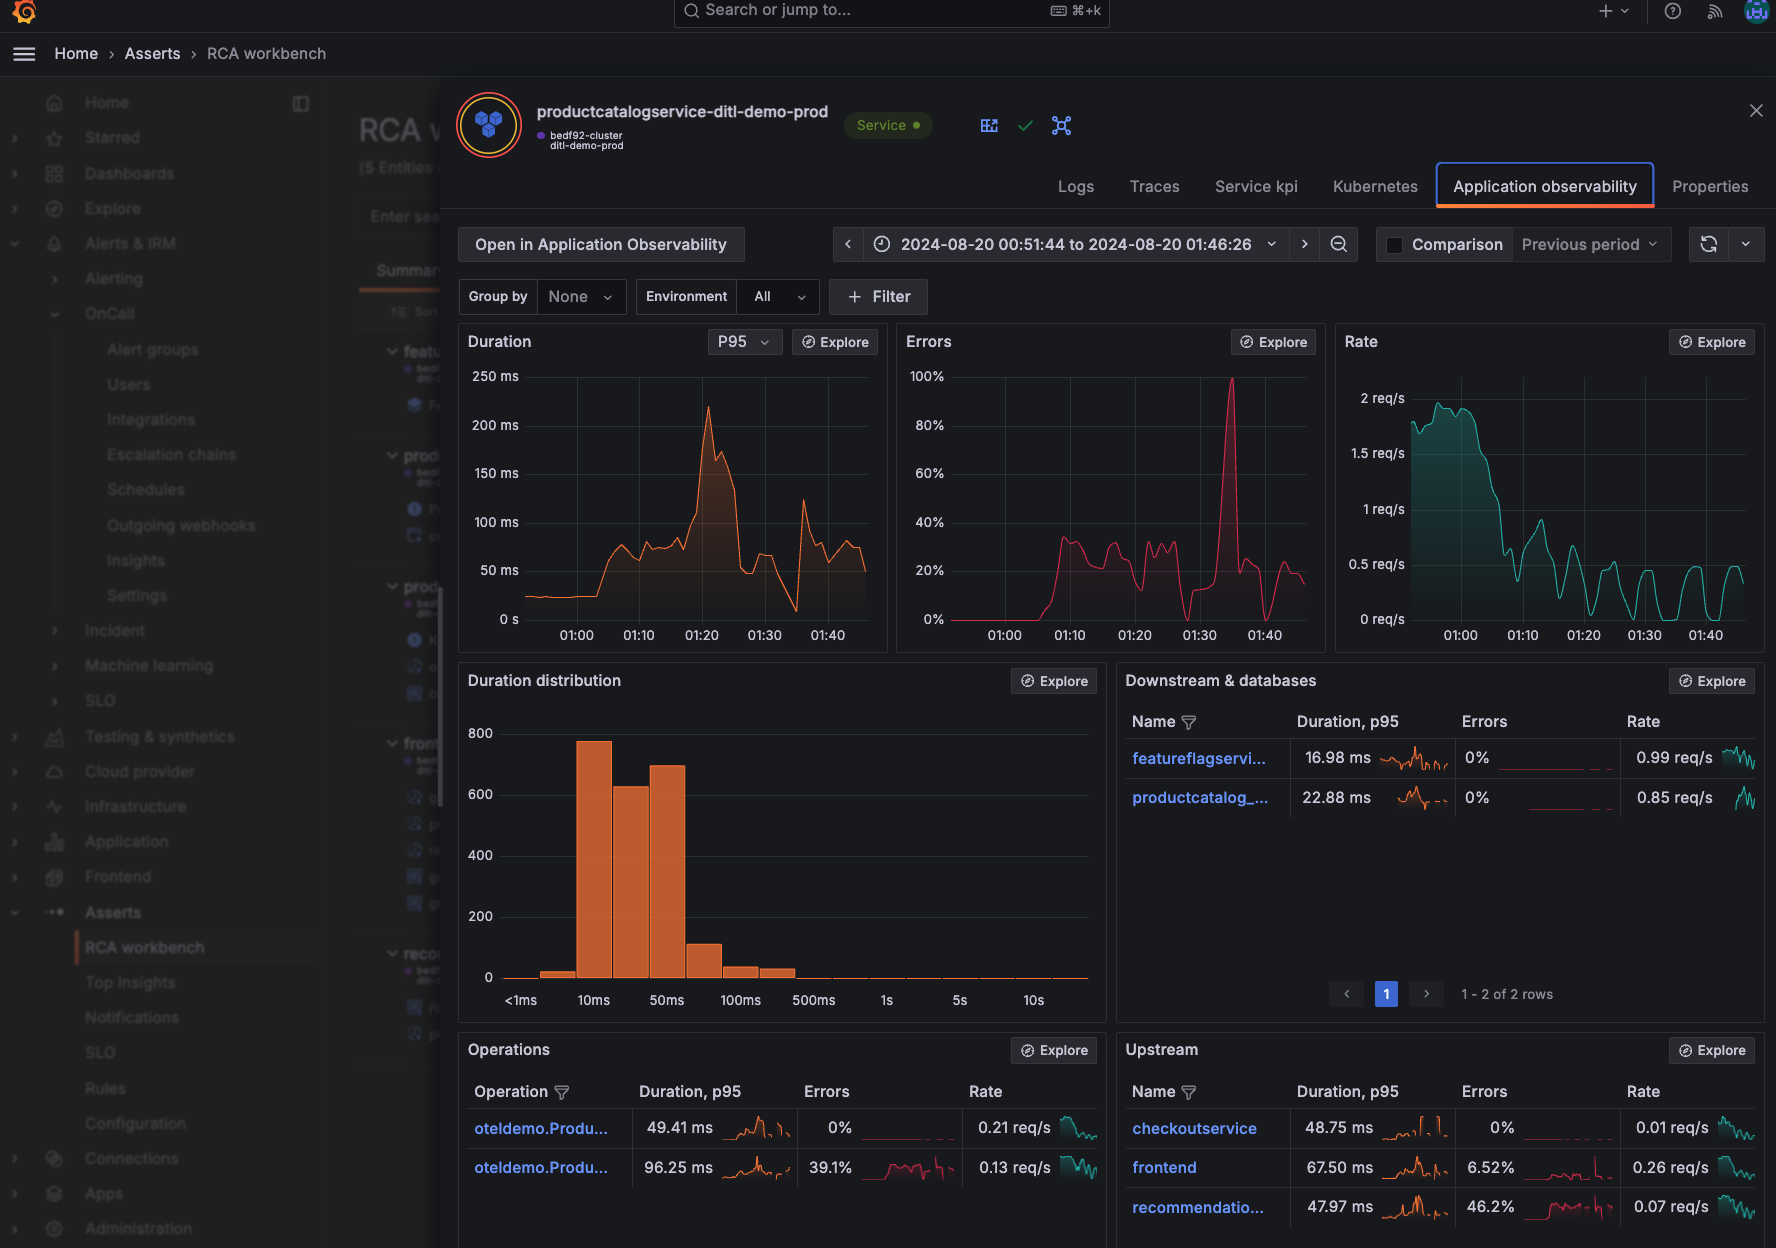
Access domain-specific dashboards and telemetry data powered by Grafana Cloud observability solutions to conduct comprehensive root cause investigations, with no PromQL queries required.
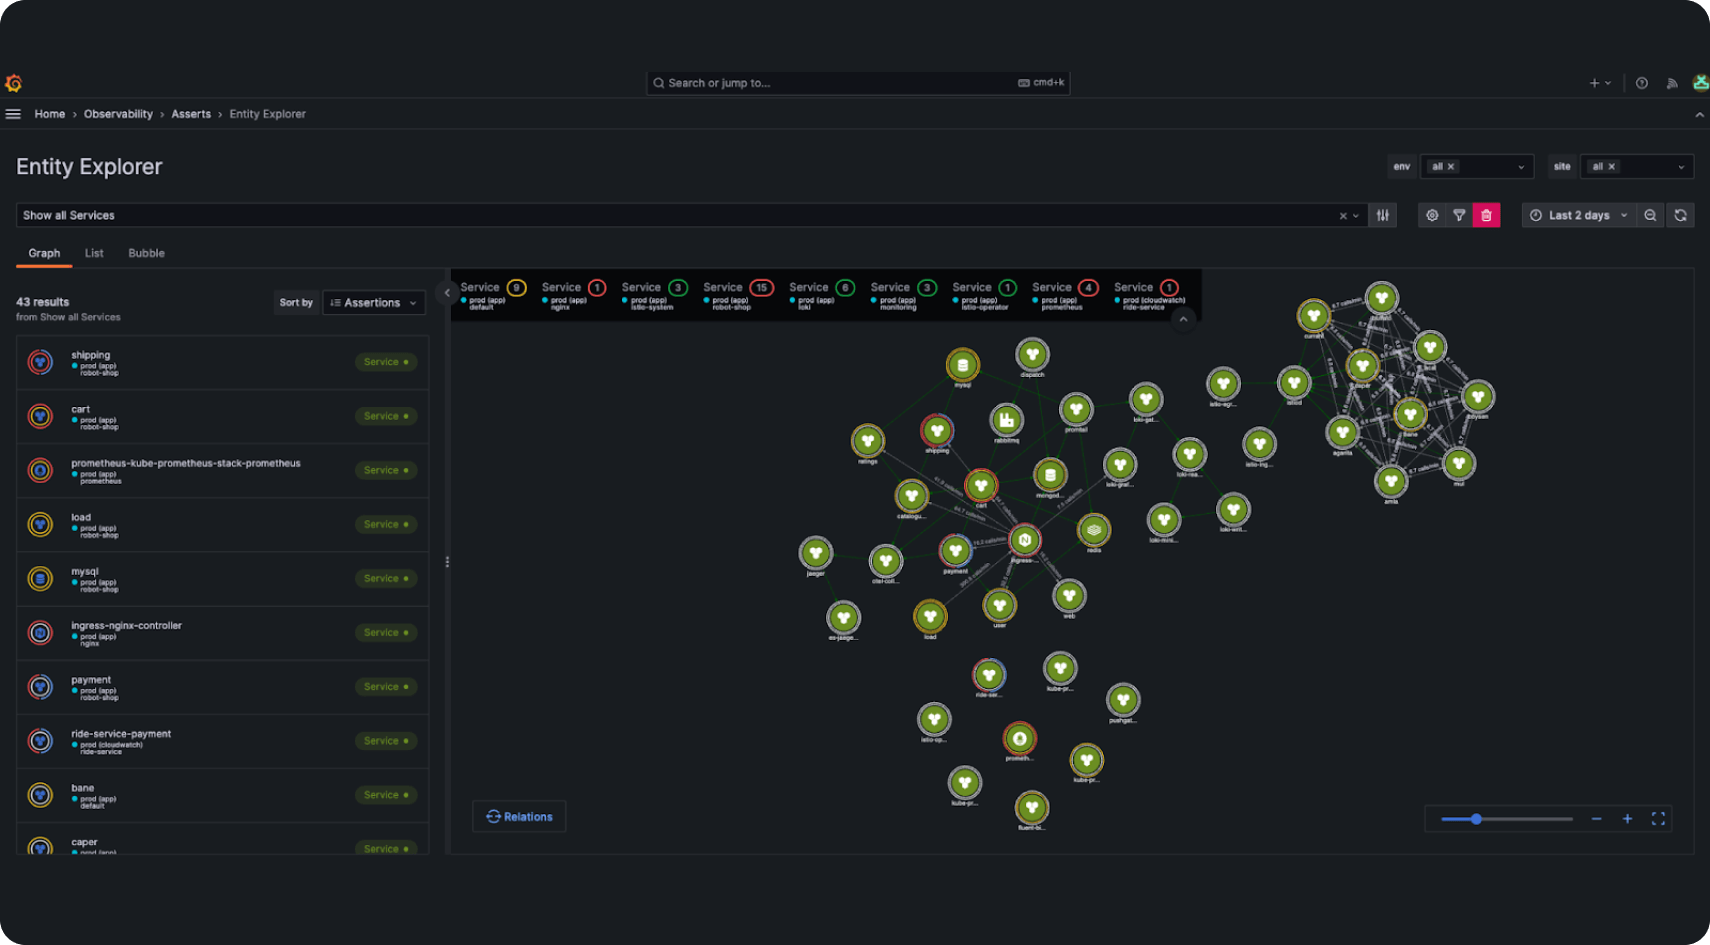
View all relevant data with the Entity Graph
- Asserts analyzes metric labels from Prometheus exporters, service meshes (Istio, Linkerd), eBPF-based auto-instrumentation (Grafana Beyla), and OpenTelemetry to build the Entity Graph.
- When an incident is triggered, the Entity Graph is used to collate all relevant components, ensuring all troubleshooting signals are just a click away.
Leverage a curated library of alert rules out of the box
- Utilizing normalized and baselined data, Asserts provides a comprehensive set of alert rules using the SAAFE model, covering all the golden signals.
- Asserts automates writing PromQL so you don’t have to.
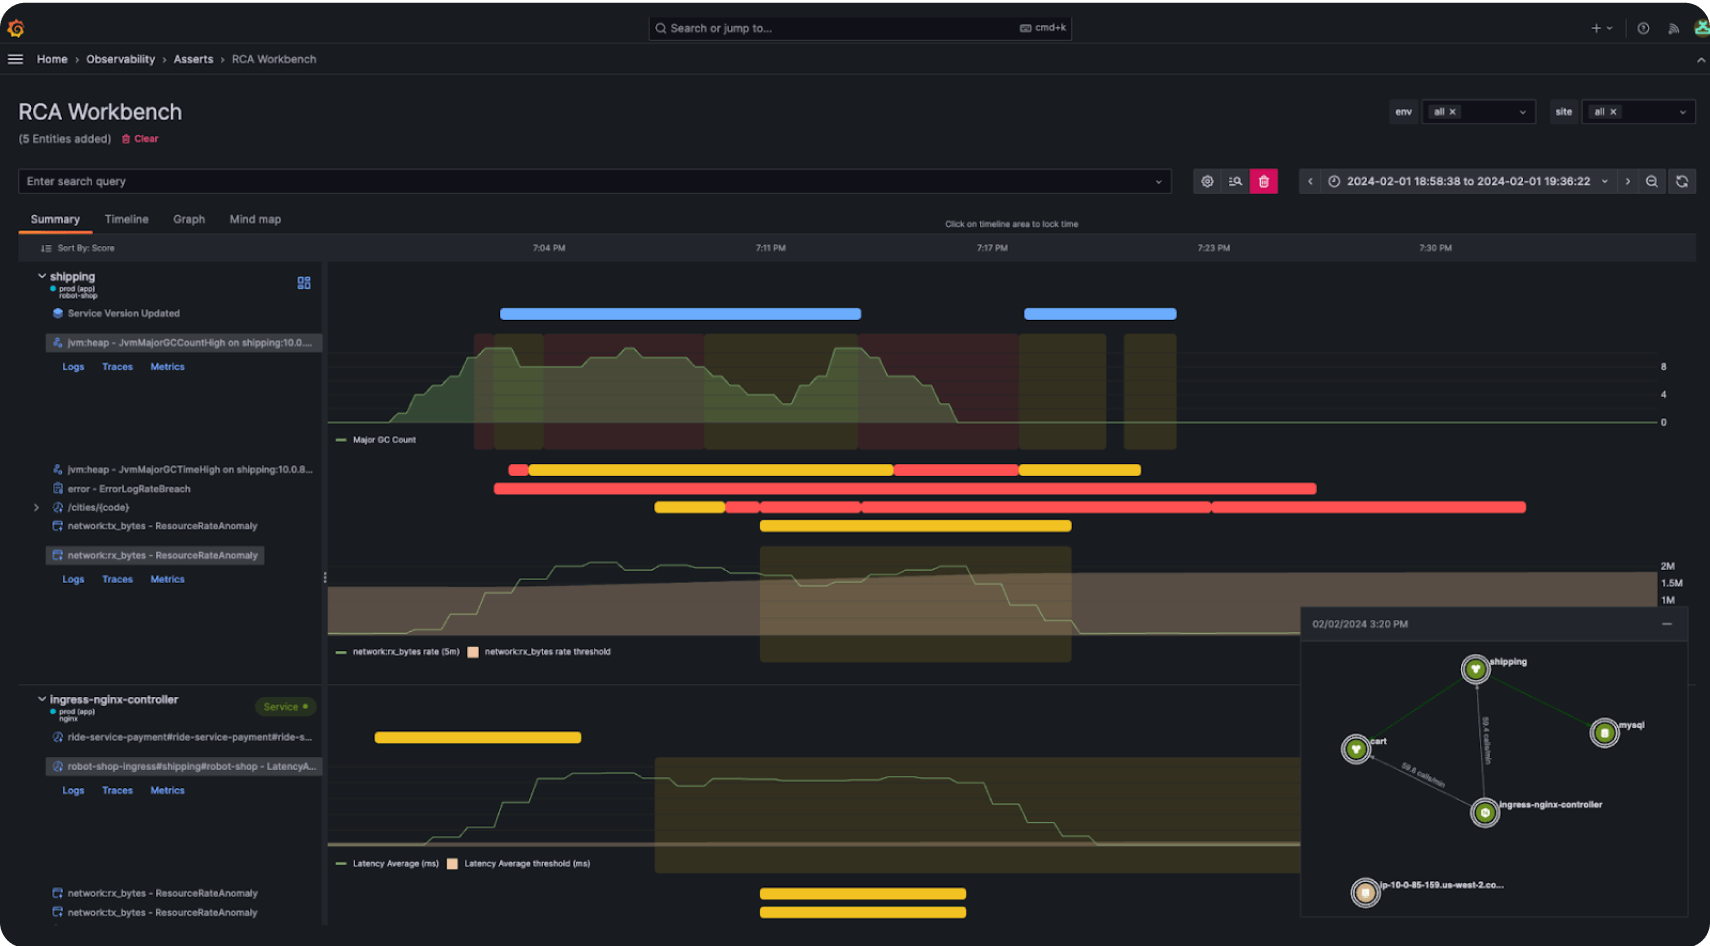
Spot issues faster with the RCA Workbench
- All components affected by an incident are automatically correlated in a single view.
- The relevant metrics, logs, and traces are right at your fingertips for root cause analysis.
- Quickly jump into logs and traces that correspond to the component and timeframe of the incident.
Asserts is available to all Grafana Cloud Advanced customers
Sign up
Create your Grafana Cloud Advanced account
Or contact us for volume discounts and expert support
Activate
Navigate to the Asserts section in the Grafana Cloud menu and follow the instructions provided.
Send the required metrics to unlock maximum value
Asserts provides the best experience when used with infrastructure metrics, RED (Rate, Errors, Duration) metrics, and service graph metrics. Learn more.
Our system will automatically analyze your setup and may prompt you to submit a support ticket if additional assistance is needed.


