What is Grafana Faro?
A project for frontend application observability, Grafana Faro includes a highly configurable web SDK for real user monitoring (RUM) that instruments browser frontend applications to capture observability signals. The frontend telemetry can then be correlated with backend and infrastructure data for seamless, full-stack observability.
Grafana Faro overview
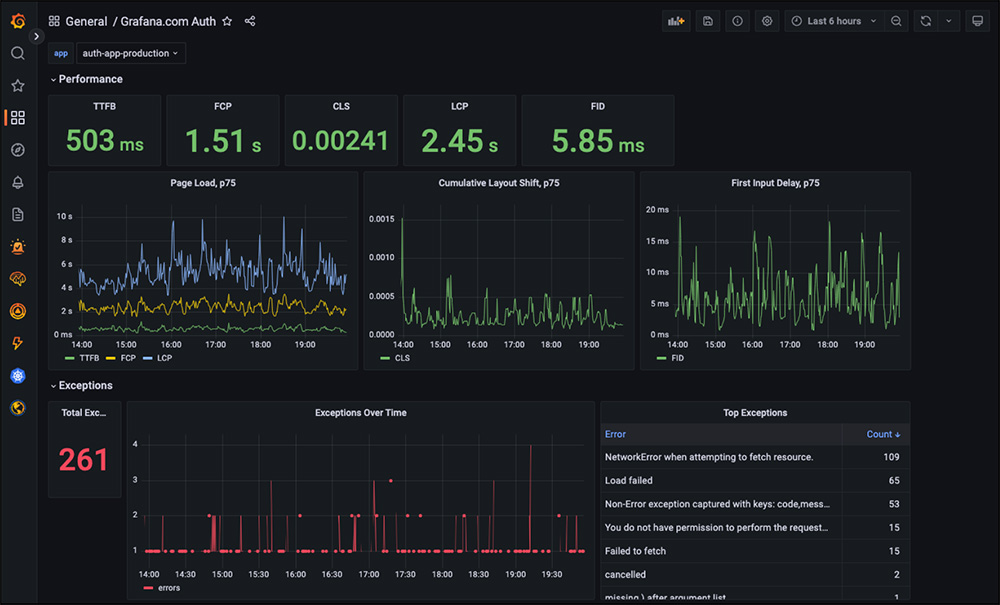
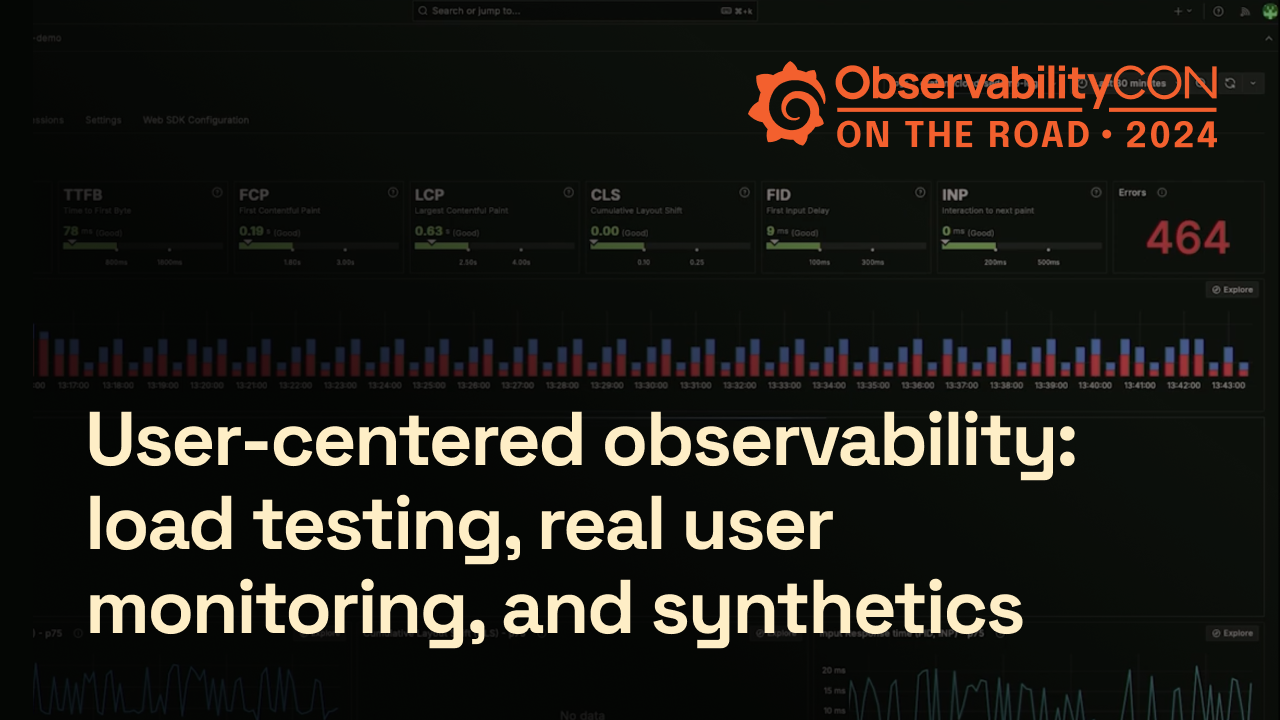
The Grafana Faro Web SDK is a highly configurable open source JavaScript agent that can easily be embedded in web applications to collect real user monitoring (RUM) data: performance metrics, logs, exceptions, events, and traces.
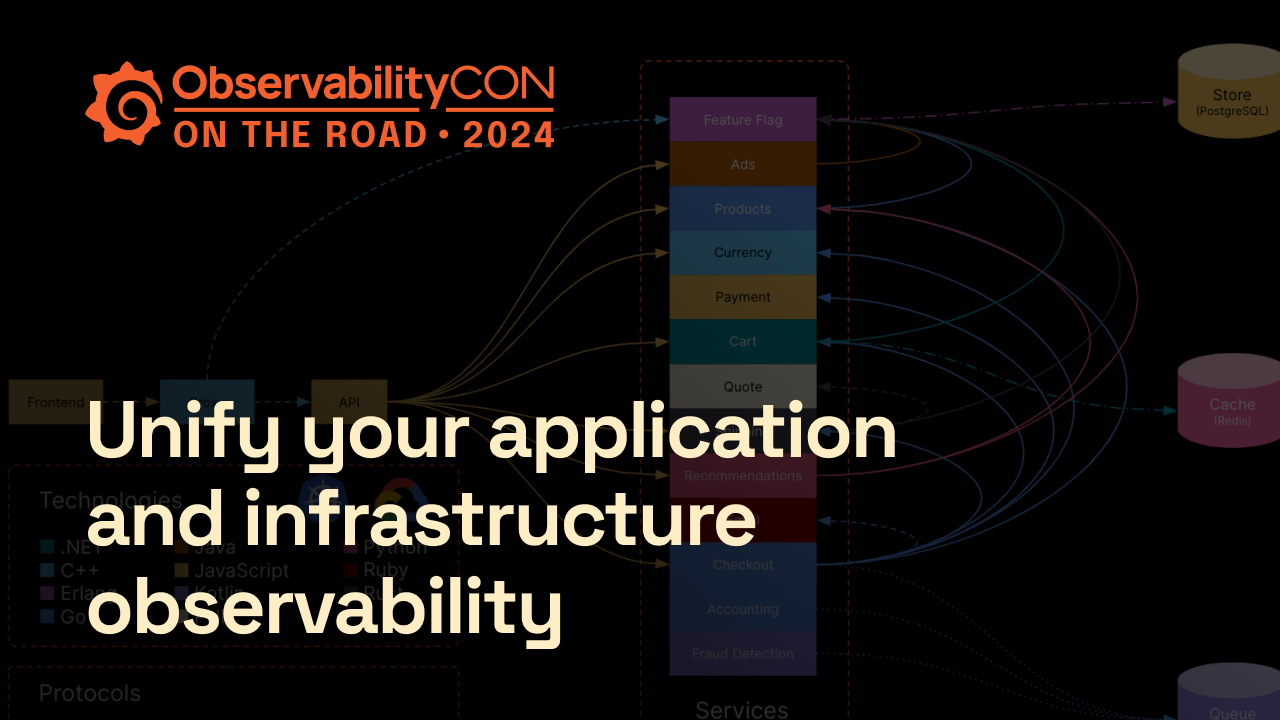
Faro was started at Grafana Labs and announced in 2022. The mission of the project is to help users monitor web application performance, discover frontend errors, and track user behavior to ease failure resolution. The collected frontend observability data can then be correlated with backend and infrastructure data in the Grafana Labs LGTM stack (Loki for logs, Grafana for visualization, Tempo for traces, Mimir for metrics) for a seamless, full-stack, open source observability solution.
Grafana Labs is proud to lead the development of the Grafana Faro project, building first-class support for Faro into Grafana, and ensuring Grafana Labs customers receive Faro support and frontend monitoring features as needed.
Why use Grafana Faro for frontend monitoring?
Built on open source, driven by the community
We’re excited to share our learnings and work with the open source community to build an easy-to-use frontend monitoring solution.


