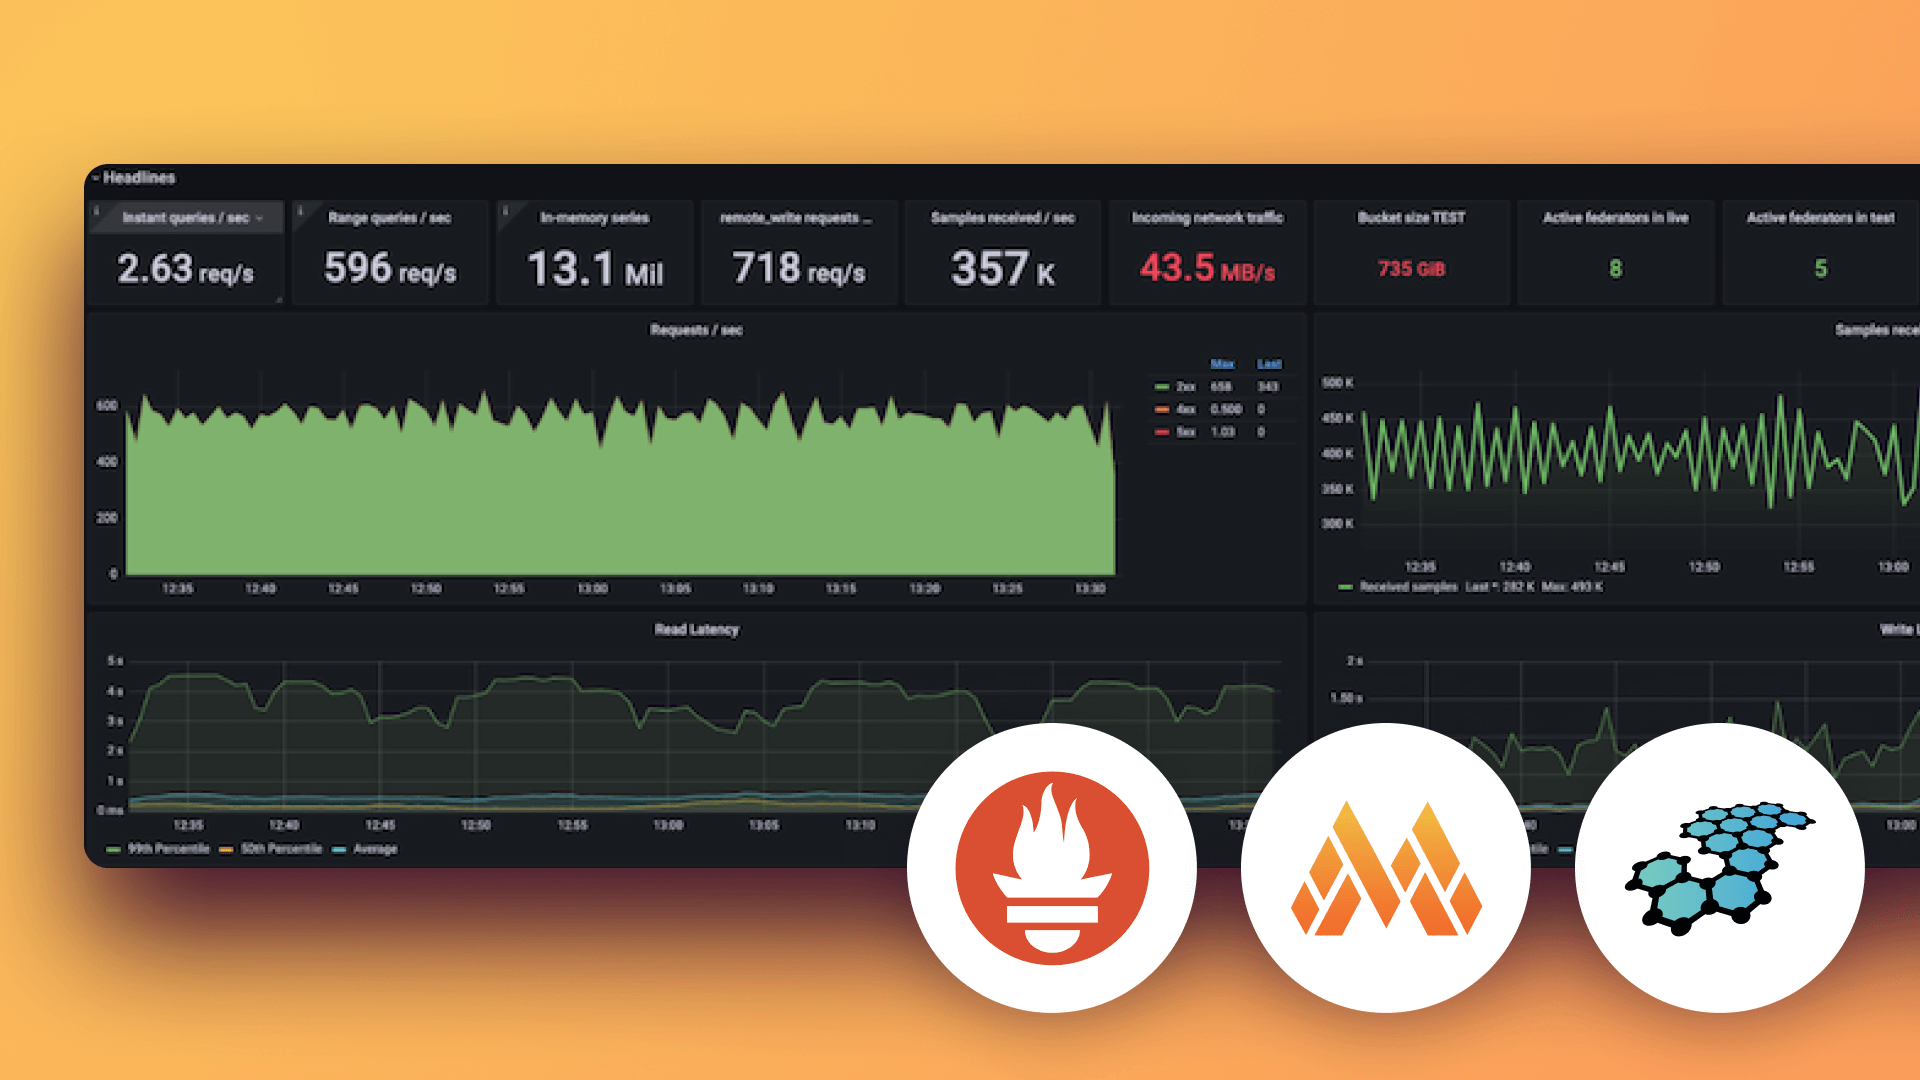
What is Grafana Mimir?
Mimir is an open source, horizontally scalable, highly available, multi-tenant TSDB for long-term storage for Prometheus.
Read the announcement blog post
Get Mimir up and running in 10 minutes:
Mimir overview
Mimir lets you scale metrics to 1 billion active series and beyond, with high availability, multi-tenancy, durable storage, and blazing fast query performance over long periods of time.
Mimir was started at Grafana Labs and announced in 2022. The mission for the project is to make it the most scalable, most performant open source time series database for metrics, by incorporating what Grafana Labs engineers have learned running Grafana Enterprise Metrics and Grafana Cloud Metrics at massive scale. Mimir is released under the AGPLv3 license.
Grafana Labs is proud to lead the development of the Mimir project, building first-class support for Mimir into Grafana, and ensuring Grafana Labs customers receive Mimir support and features they need.
Why use Mimir?
How does Mimir work?

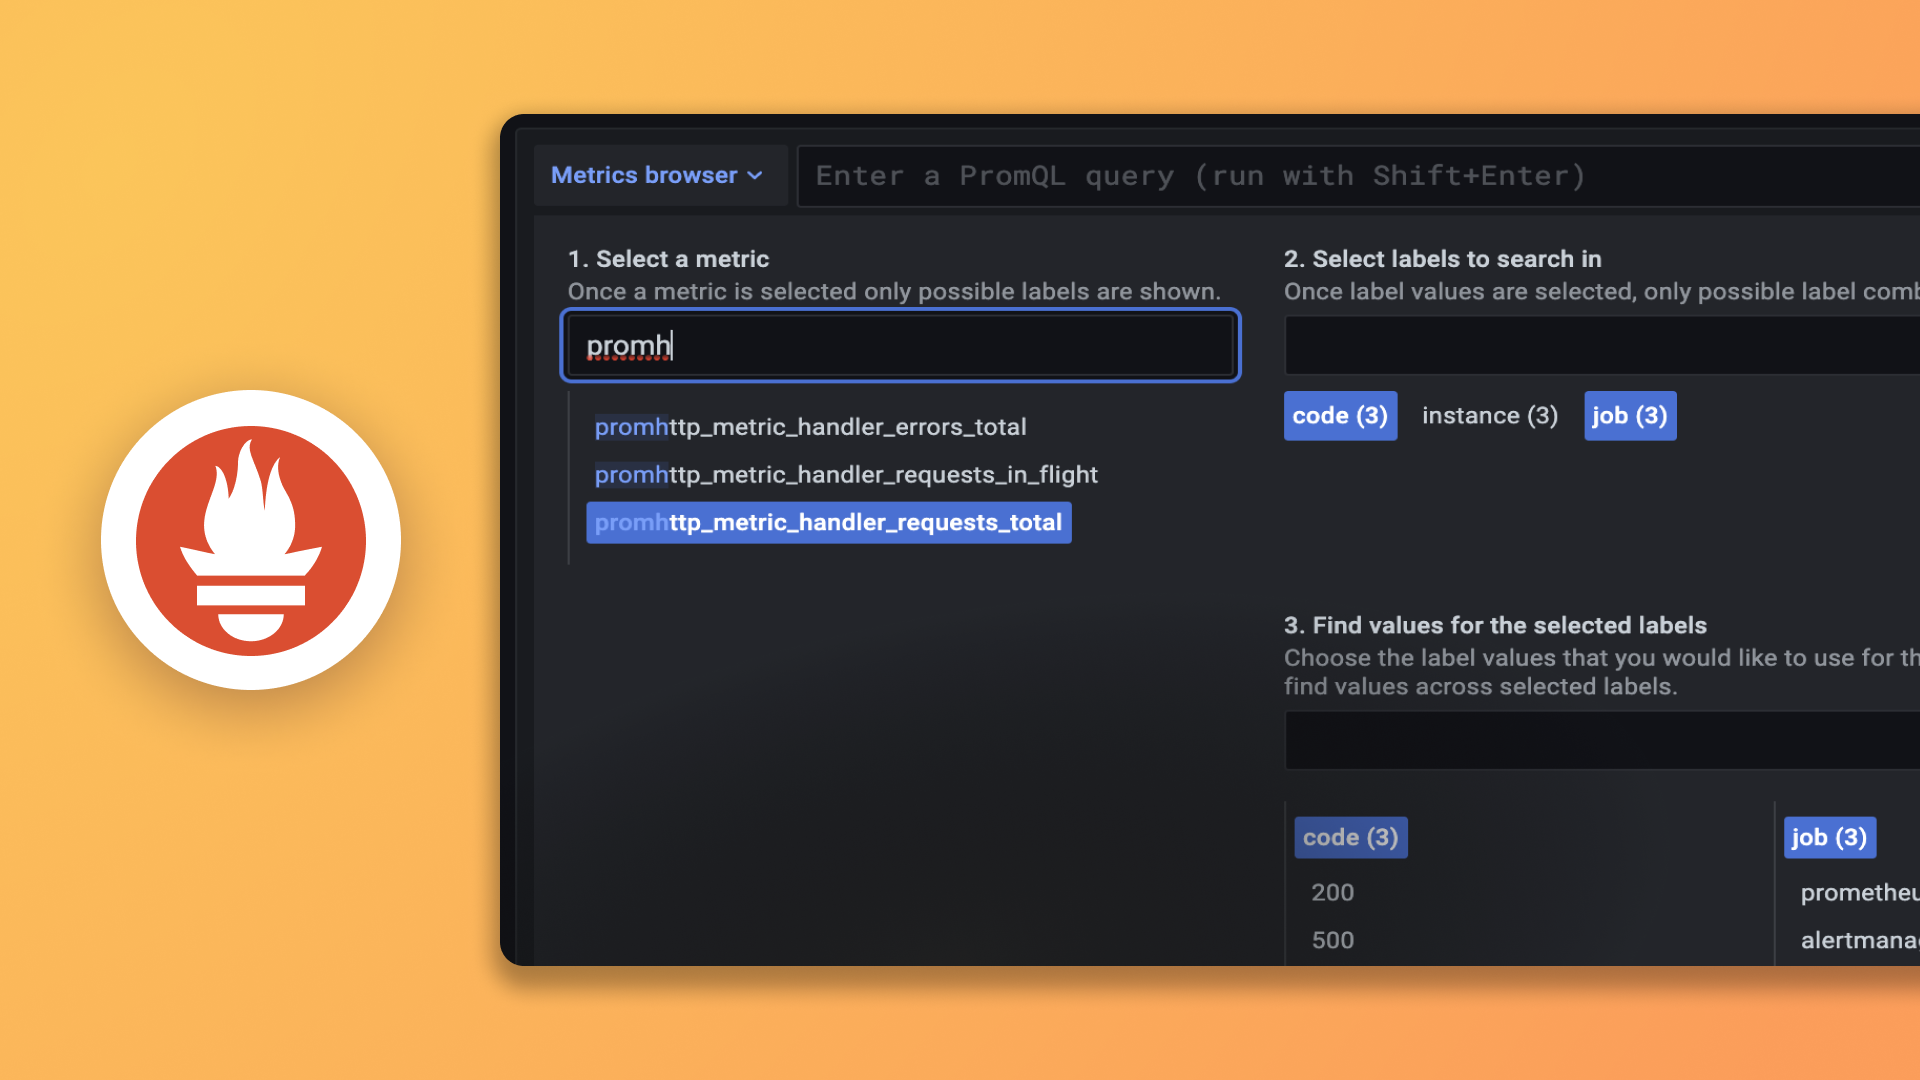
Store Prometheus metrics
Use Prometheus to scrape metrics from your applications and remote write these metrics to Mimir, or use the Grafana Agent, the Prometheus Agent, or other Prometheus remote write compatible software to send data directly.
Run it easily, without sacrificing scalability or reliability
Mimir clusters automatically; there’s no need to shard, replicate, or rebalance by hand. To increase capacity, just add new instances to the cluster. Mimir does the rest.
Visualize in Grafana
Mimir enables users to run queries, create new data via recording rules, and set up alerting rules across multiple tenants, leveraging tenant federation. All of this can be tied together with the Grafana dashboards and alerting you know and love.
Choose the version that’s best for you
Mimir
Highly scalable, performant metrics backend.
Install, administer, and maintain your own instance.
Cloud Metrics
Offered as a fully managed service, Grafana Cloud Metrics is a super fast, highly available Prometheus-compatible backend.
Managed and administered by Grafana Labs with free and paid options for individuals, teams, and large enterprises.
Get up to 10k metrics at no cost in the free tier of Grafana Cloud.
Enterprise Metrics
A self-managed Prometheus service that is seamless to use, simple to operate/maintain, and supported by Grafana Labs.
For organizations that have specific privacy, security, or compliance requirements and need a self-managed environment.
Built on open source, driven by the community
Mimir combines the best of the work Grafana Labs engineers contributed to the Cortex project and features developed by the company for customers running Prometheus at massive scale. We’re excited to share our learnings and work with the open source community.


