What is Grafana Beyla?
Grafana Beyla is an open source eBPF-based auto-instrumentation tool that helps you easily get started with application observability for Go, C/C++, Rust, Python, Ruby, Java, NodeJS, .NET, and more.
eBPF is used to capture RED metrics (Rate-Error-Duration) and basic trace spans for Linux HTTP/S and gRPC services – without any modifications to application code or configuration.
Grafana Beyla overview
Grafana Beyla is an OSS project that enables automatic instrumentation for HTTP/gRPC applications written in Go, C/C++, Rust, Python, Ruby, Java (including GraalVM Native), NodeJS, .NET, and more. It’s based on eBPF, which allows you to attach your own programs to different points of the Linux kernel.
Often, instrumenting an app for application observability requires adding a language agent to the deployment or package, manually adding tracepoints, and then redeploying. With Beyla, you can instrument all your services with a single command, without modifying source code.
Beyla was started at Grafana Labs and announced in 2023. The mission of the project is to help users get started quickly with application observability by leveraging eBPF. The collected telemetry data can then be correlated with backend and infrastructure data in the Grafana Labs LGTM stack (Loki for logs, Grafana for visualization, Tempo for traces, and Mimir for metrics) for a seamless, full-stack, open source observability solution.
Grafana Labs is proud to lead the development of the Grafana Beyla project, building first-class support for Beyla into Grafana, and ensuring Grafana Labs users receive Beyla support and application observability features as needed.
Why use Grafana Beyla?
How does Grafana Beyla work for eBPF auto-instrumentation?

What is eBPF?
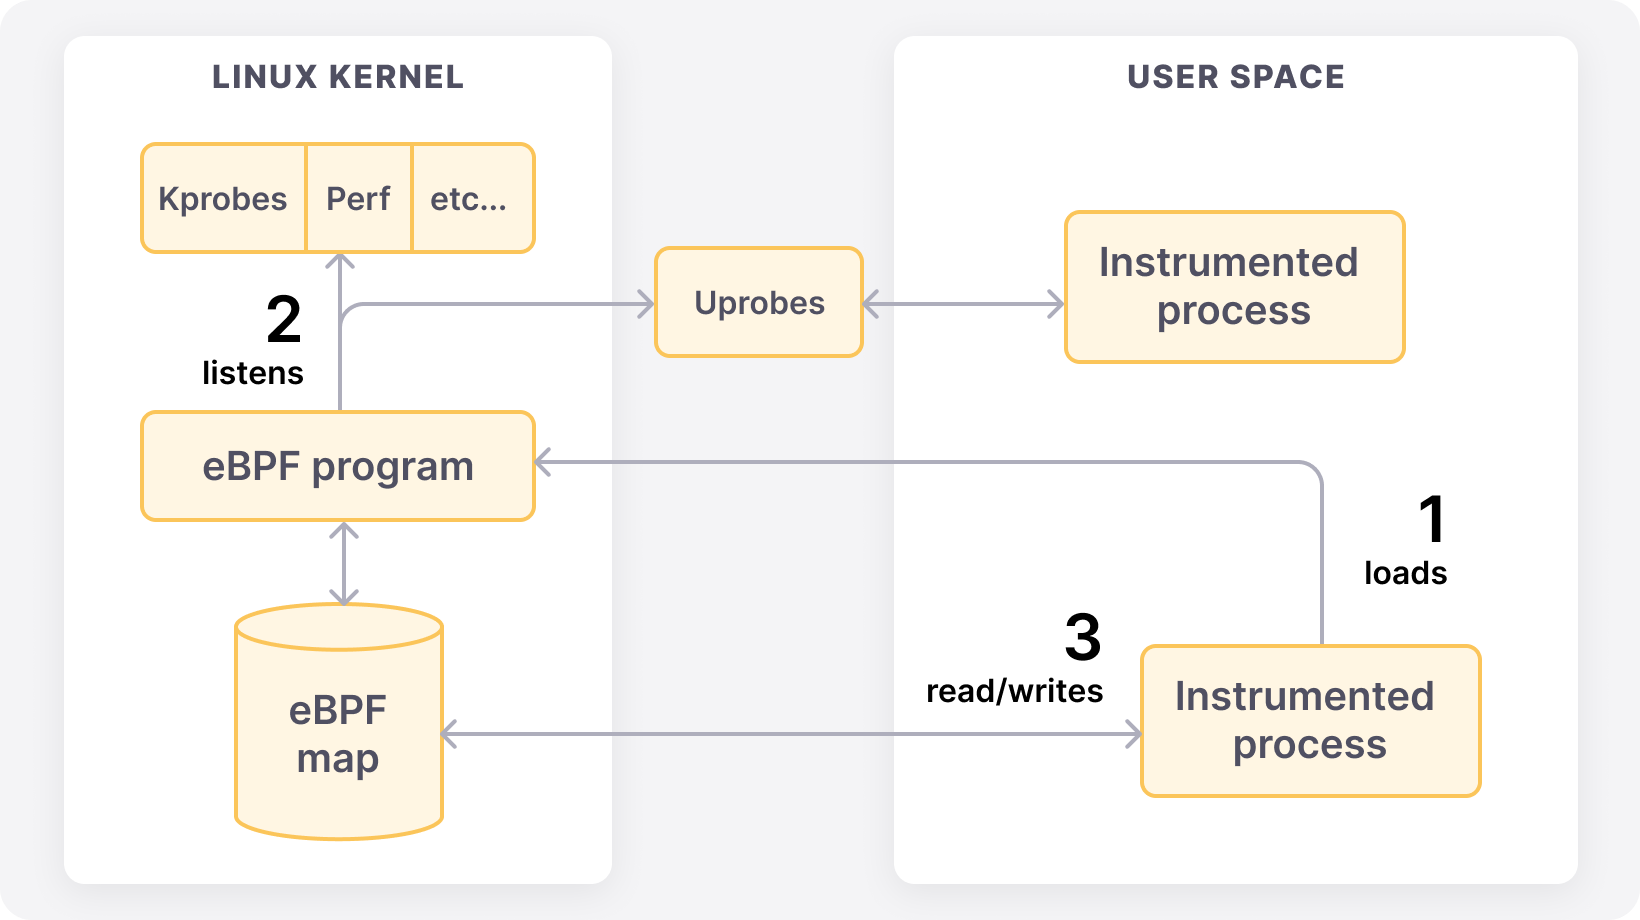
eBPF technology allows for attaching programs to different points of the Linux kernel. eBPF programs run in privileged mode to allow inspecting runtime information from different parts of your kernel: system calls, network stack, and even inserting probes in your user space programs.
The eBPF programs are safe, as they are compiled for their own Virtual Machine instruction set and then can run in a sandbox environment that pre-verifies each loaded program for safe memory access and finite execution time.
After being verified, the eBPF binaries are compiled Just-In-Time (JIT) to the host native architecture (x86-64, ARM64, etc.) for efficient and fast execution.
The eBPF code is loaded from ordinary programs running in the user space, and both kernel and user space programs can share information through a set of communication mechanisms that are provided by the eBPF specification: ring buffers, arrays, hash maps, etc.

Built on open source, driven by the community
We’re excited to share our learnings and work with the open source community on this easy-to-use auto-instrumentation application observability tool.

