OpenTelemetry, DevOps, and platform engineering
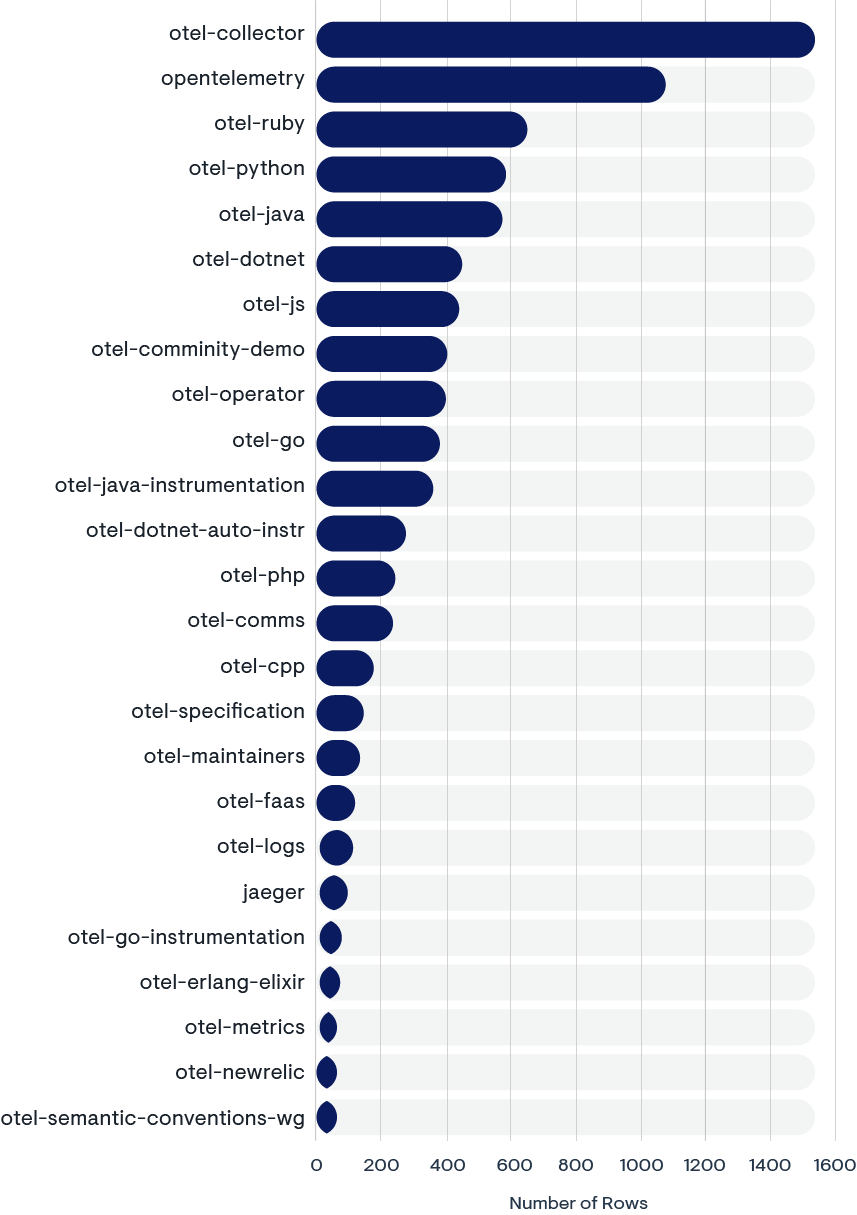
The bar chart visualizes the most popular CNCF Slack channels dedicated to OpenTelemetry topics, ranked by the frequency of messages (denoted as “Tokens”).
OpenTelemetry-related Slack channels by number of posts
Here’s what the data suggests are the topics of interest:
1. OTel Collector focus
The “otel-collector” channel is the most active, indicating that discussions around the OpenTelemetry Collector are particularly prevalent. This could encompass setup, configuration, and troubleshooting.
2. Language-specific channels
There are several language-specific channels, such as “otel-ruby,” “otel-python,” “otel-java,” “otel-dotnet,” and “otel-js,” suggesting a vibrant, language-centric OpenTelemetry community. This reflects active engagement on how OpenTelemetry is implemented and used within these different programming ecosystems.
3. Community and demos
The “otel-community-demo” channel’s activity level points to an interest in demonstrations and practical examples of OpenTelemetry in use, which can be crucial for community education and adoption.
4. Operator and infrastructure
The presence of channels like “otel-operator” and “otel-go” indicates discussions on operational aspects and specific implementations of OpenTelemetry in Go environments.
5. Instrumentation and auto-instrumentation.
Channels such as “otel-java-instrumentation” and “otel-dotnet-auto-instrument” show a focus on the instrumentation aspects of OpenTelemetry, including automated solutions for capturing telemetry data.
6. Diverse topics
The variety of channels, including those focusing on “otel-logs,” “otel-metrics,” and vendor-specific channels, like “otel-newrelic,” showcases the breadth of discussions from logging and metrics to how OpenTelemetry integrates with third-party monitoring services.
7. Specialized discussions
The existence of channels such as “otel-specification,” “otel-maintainers,” and “otel-semantic-conventions-wg” indicates that there are specialized discussions likely involving the development and governance of the OpenTelemetry specifications and their semantic conventions.
The chart indicates that the OpenTelemetry community on Slack is active across a wide range of topics, from general usage and implementation to in-depth technical specifications and language-specific concerns. This suggests a diverse and engaged community focused on leveraging OpenTelemetry to its fullest across various use cases and technology stacks.
Key OpenTelemetry topics for DevOps and platform engineering
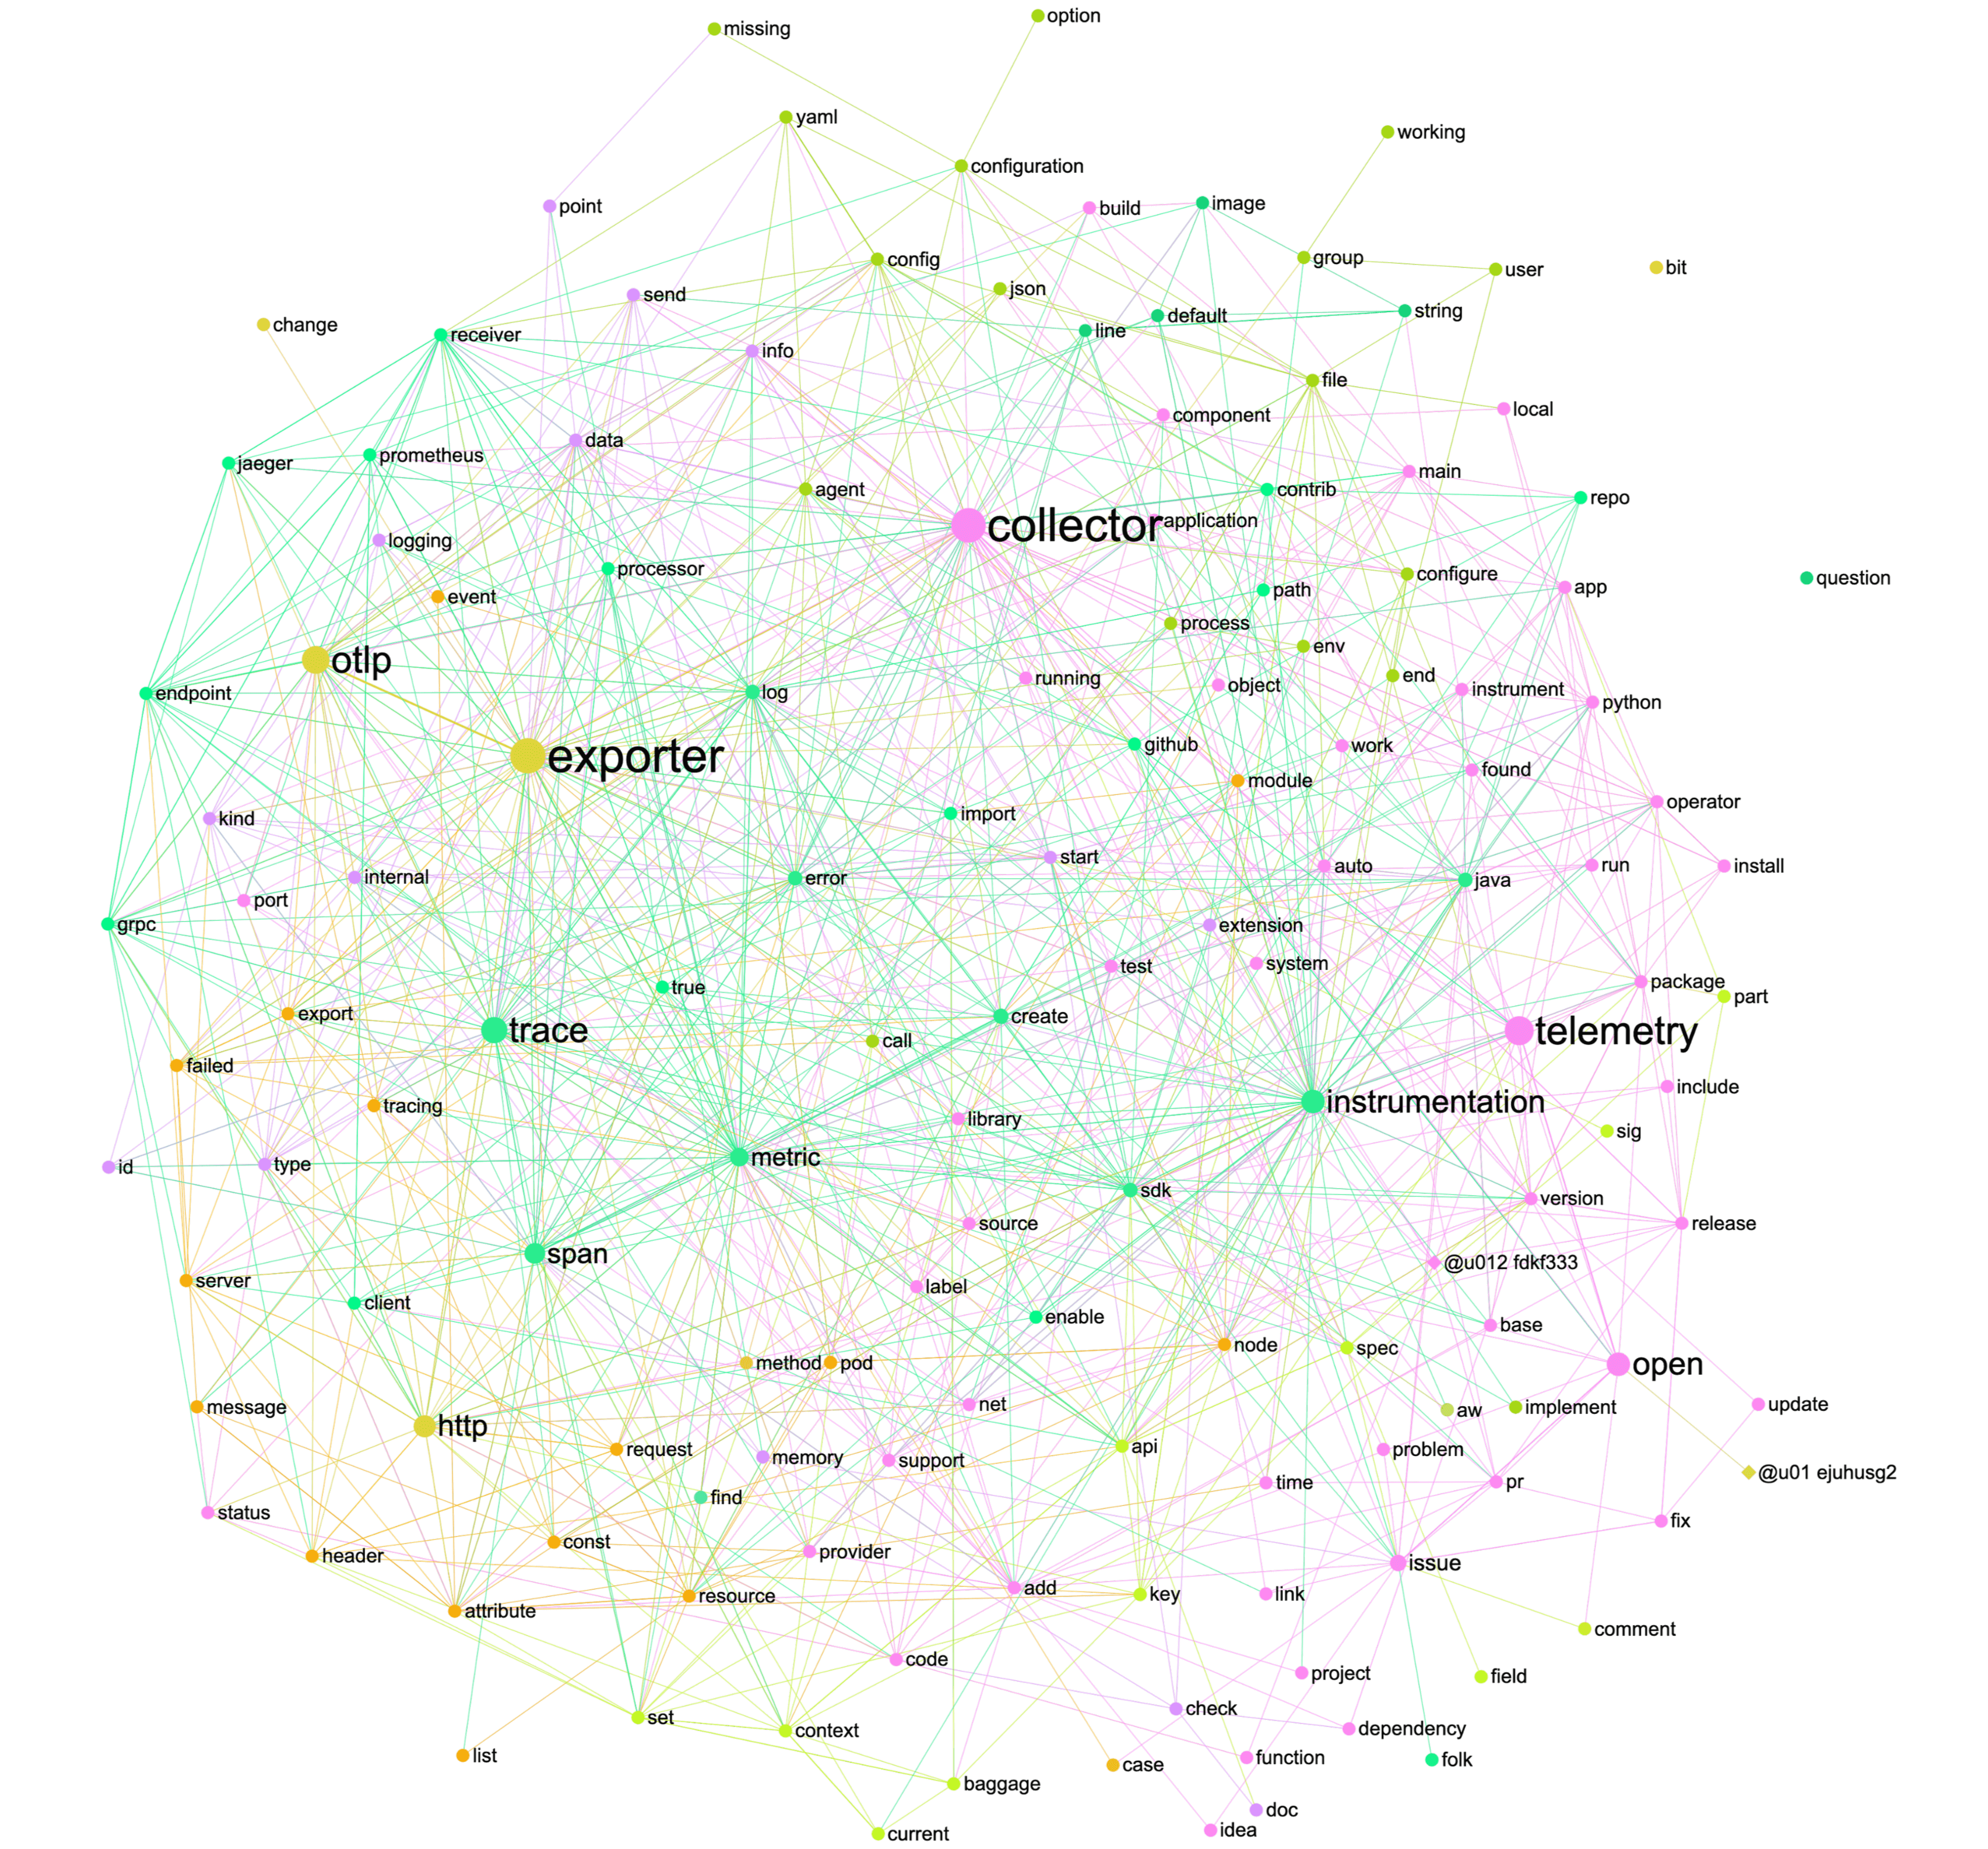
The chart below is a topic network visualization based on discussions from OpenTelemetry-related Slack posts.
OpenTelemetry-related posts on CNCF Slack
Here’s what we can infer from it:
1. Key components
The prominent nodes labeled as “collector,” “exporter,” “trace,” “telemetry,” and “instrumentation” indicate that these are central topics in OpenTelemetry discussions. This suggests that the collection and export of telemetry data, including traces, and the process of instrumentation are core to the community’s interests and challenges.
2. Integration and support
There are nodes for various technologies and protocols, like “grpc,” “http,” “otlp,” and “prometheus,” which shows that integrating OpenTelemetry with these protocols and tools is a significant point of conversation.
3. Implementation details
The presence of terms such as “config,” “agent,” “processor,” “metric,” “span,” and “log” points to in-depth discussions about the implementation specifics of OpenTelemetry, from configuration to data processing and logging.
4. Development workflow
The mention of “github,” “pull request (pr),” “issue,” “commit,” “merge,” and “build” suggests that the OpenTelemetry community is actively engaged in development workflows, including code management, build processes, and issue tracking.
5. Challenges and solutions
Words like “problem,” “failed,” “error,” and “fix” are indicative of the common challenges users face, as well as the community’s efforts to address and solve these issues.
6. Languages and frameworks
The network includes references to programming languages and frameworks, such as “java,” “python,” and “.net,” indicating discussions around OpenTelemetry’s use across diverse development ecosystems.
7. Community interaction
User handles like “@u01” and “@u02” suggest the data might include direct interactions or mentions of specific community members, pointing to an engaged and collaborative community.
8. Data Transmission and structure
The terms “endpoint,” “request,” “header,” and “attribute” point toward technical discussions on how telemetry data is structured and transmitted.
Overall, the chart depicts an active and interconnected community focused on developing, implementing, and optimizing OpenTelemetry, discussing a wide array of technical aspects from setup and configuration to error handling and integration with other tools and systems.
Top 6 OpenTelemetry challenges for DevOps
DevOps engineers, developers, platform engineers, and operators use Slack to receive technical support and advice on Slack. To learn about their current pain points and priorities, we analyzed 10,000 sequential posts to the CNCF Slack workspace that were related to #OpenTelemetry.
Top DevOps challenges based on CNCF Slack
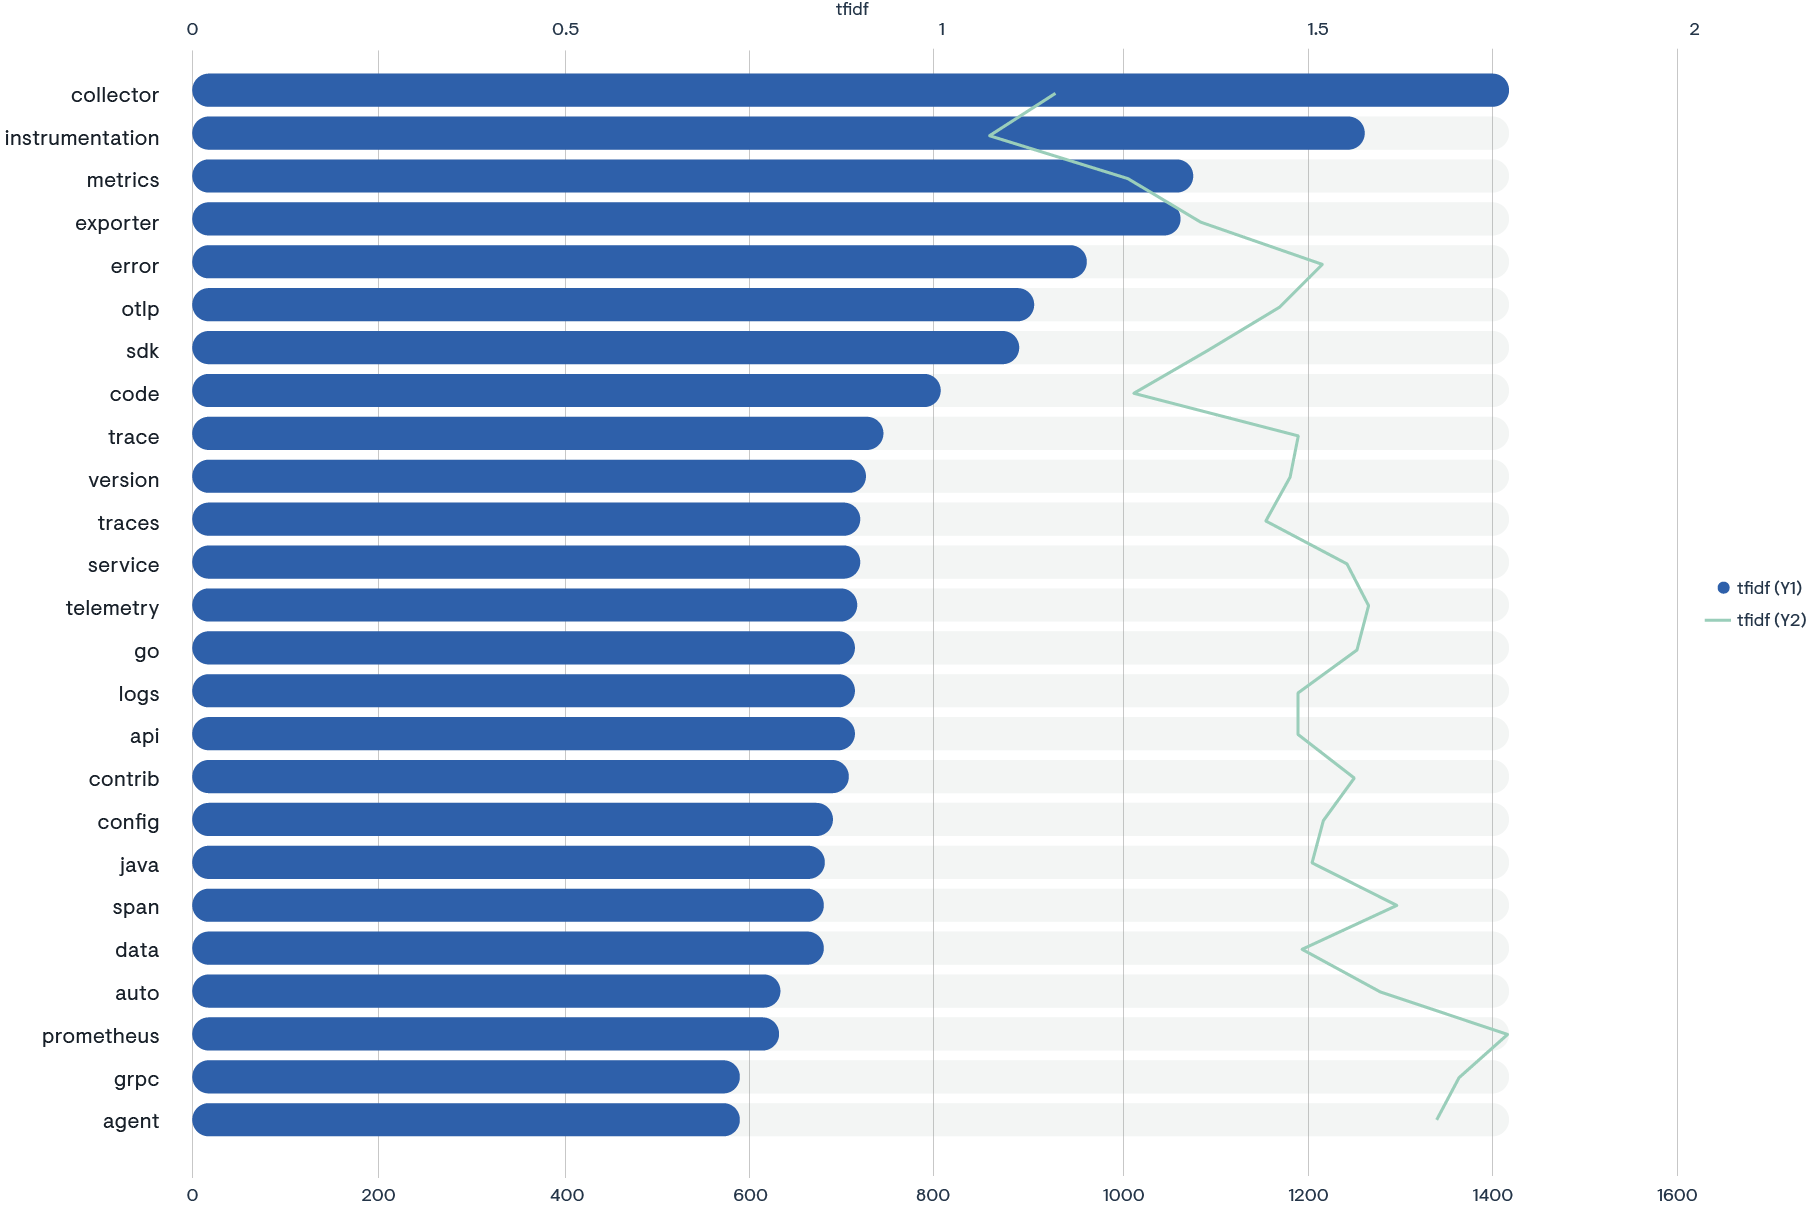
In the realm of cloud native applications and observability, discussions on Stack Overflow reveal a spectrum of challenges developers and operators face across various components of the OpenTelemetry ecosystem. These challenges span from the foundational setup of the OpenTelemetry Collector to the nuanced intricacies of gRPC communication, each presenting unique hurdles in the pursuit of seamless observability and monitoring.
1. Collector-related OpenTelemetry issues
The OpenTelemetry Collector, pivotal for data collection and export, often encounters configuration complexities, high-availability concerns, and storage management issues. For instance, configuring the Collector for high availability in Kubernetes can be daunting due to the need for persistent storage solutions and network configurations that ensure data integrity and availability.
2. Instrumentation issues
Instrumentation, crucial for generating telemetry data, poses challenges such as steep learning curves and difficulties in achieving high availability. A common scenario involves instrumenting .NET applications for tracing, where developers must navigate between different libraries and standards to ensure comprehensive data collection.
3. OpenTelemetry trace issues
Tracing, a key aspect of observability, is fraught with issues like language support discrepancies and visualization challenges. An example includes integrating OpenTelemetry tracing with languages that have limited support or libraries, complicating the process of achieving end-to-end trace visibility.
4. OpenTelemetry exporter issues
Exporters, which send telemetry data to various backends, face setup and data export challenges. A real-world example is configuring the Jaeger exporter in a microservices architecture, where ensuring that traces are correctly routed and visualized in Jaeger’s UI requires precise configuration and understanding of Jaeger’s data model.
5. OTLP issues
The OpenTelemetry Protocol (OTLP), designed for unified telemetry data export, sometimes struggles with setup and connectivity issues. For example, connecting services across different environments using OTLP can result in timeouts or data loss if network configurations and security policies are not correctly aligned.
6. SDK Issues
The OpenTelemetry SDK, which provides APIs and libraries for telemetry data generation and export, can be challenging to use and configure. Developers often seek clearer documentation and examples when trying to create custom spans or metrics, reflecting the need for more accessible SDK resources.
These discussions underscore the complexity of implementing and managing observability in modern software systems. Developers and operators are in constant search of solutions that simplify configuration, improve integration with existing tools, and offer robust support for the diverse challenges encountered in the OpenTelemetry ecosystem.
OpenTelemetry and language-specific challenges
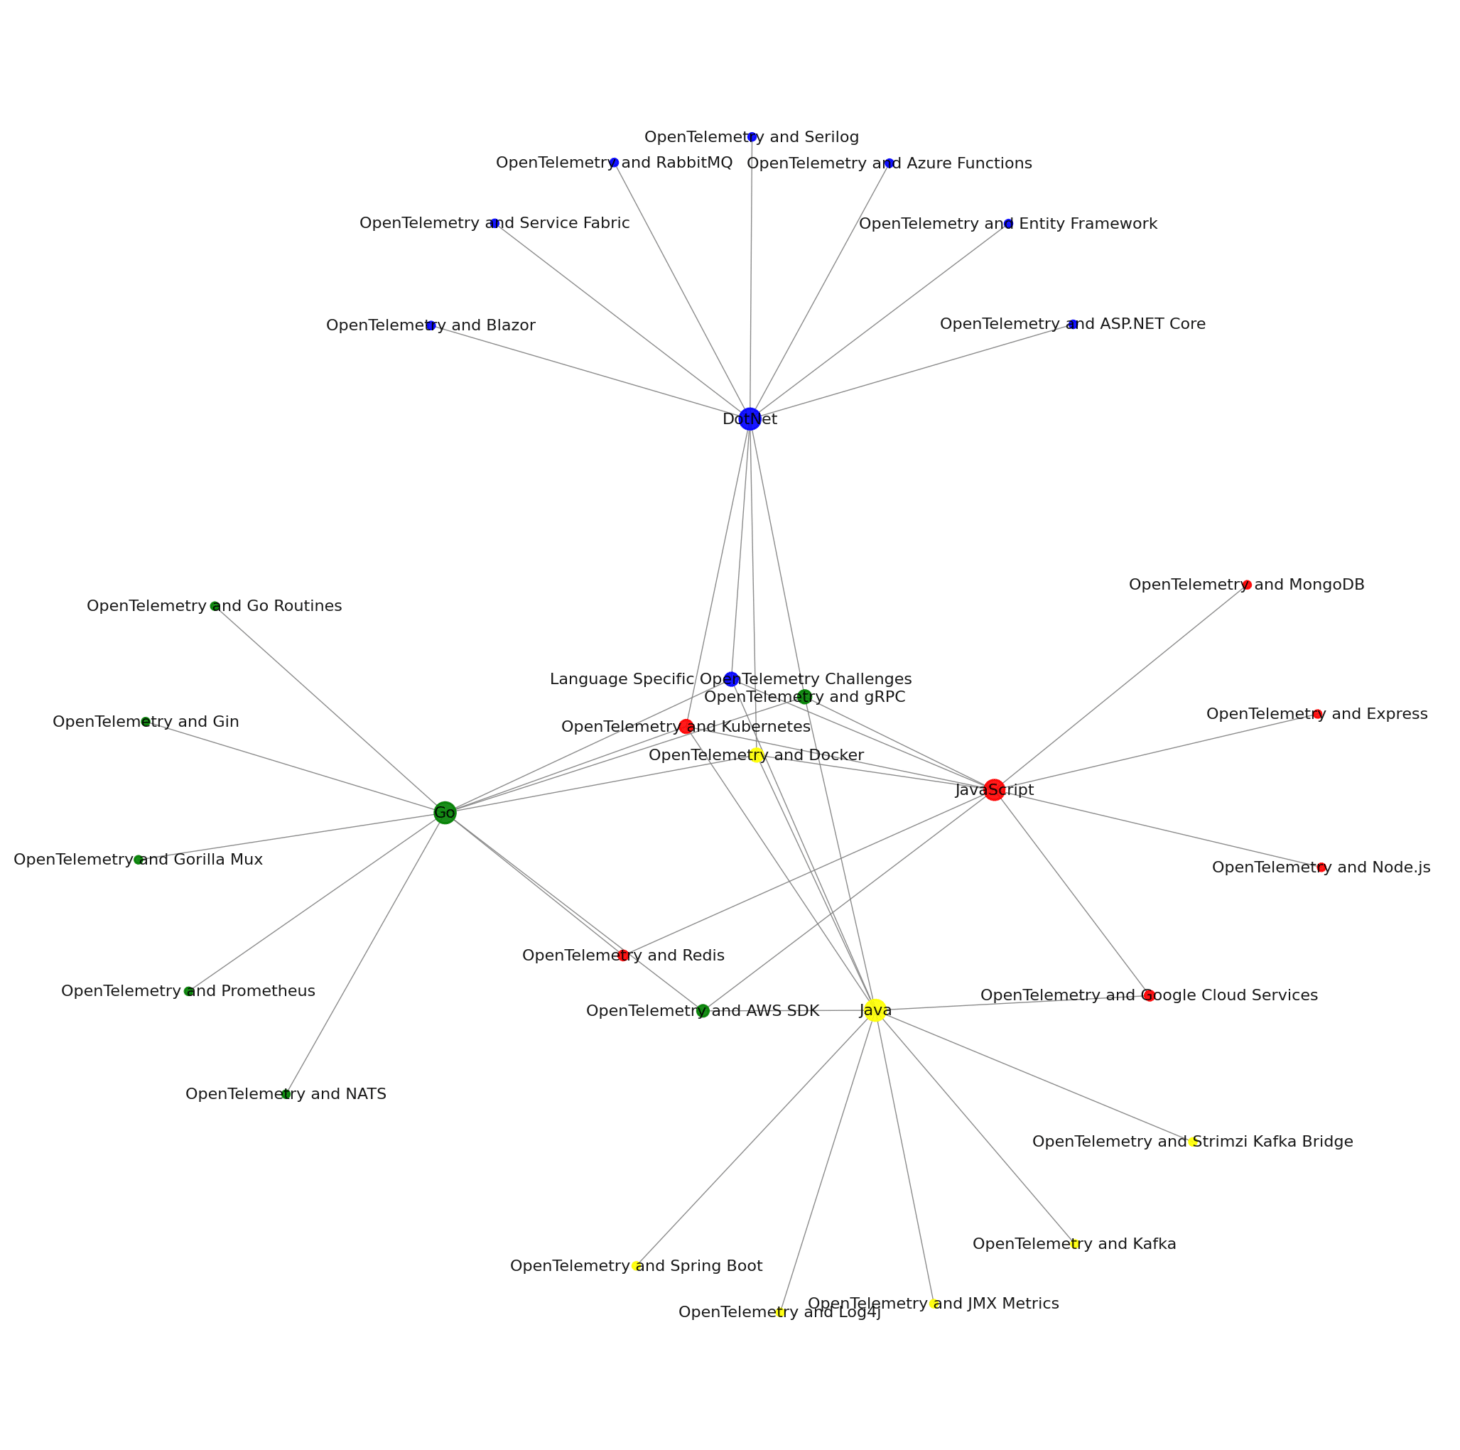
At a strategic business level, the integration of OpenTelemetry across various technology stacks presents a series of operational challenges that are critical for organizations to address for efficient system monitoring and observability.
Enterprises employing .NET technologies are navigating complexities around core application frameworks, database interactions, and cloud service monitoring, with a significant focus on ensuring seamless functionality in containerized environments, like Docker, and orchestration systems, such as Kubernetes. Similarly, organizations leveraging Go are concentrating efforts on optimizing performance monitoring within key web frameworks and ensuring reliable messaging and cloud interactions, which are pivotal for real-time data processing and analytics.
Java-centric businesses are targeting enhanced application performance through better integration with established frameworks and are keenly focused onstreamlining telemetry data collection across distributed systems. For JavaScript environments, the focus is on bolstering backend services and cloud communications to ensure robust and scalable web applications.
Across all platforms, the necessity to maintain high observability standards while managing resource constraints is prompting businesses to seek more streamlined, effective solutions for tracing and metrics collection, reinforcing the need for sophisticated yet user-friendly observability tooling.
OpenTelemetry challenges related to metrics, logs, traces, and events
From a business perspective, organizations face a multifaceted challenge when integrating OpenTelemetry for logs, metrics, and traces. The top ten issues reflect a blend of technical complexity, cost implications, and the need for a comprehensive strategy.
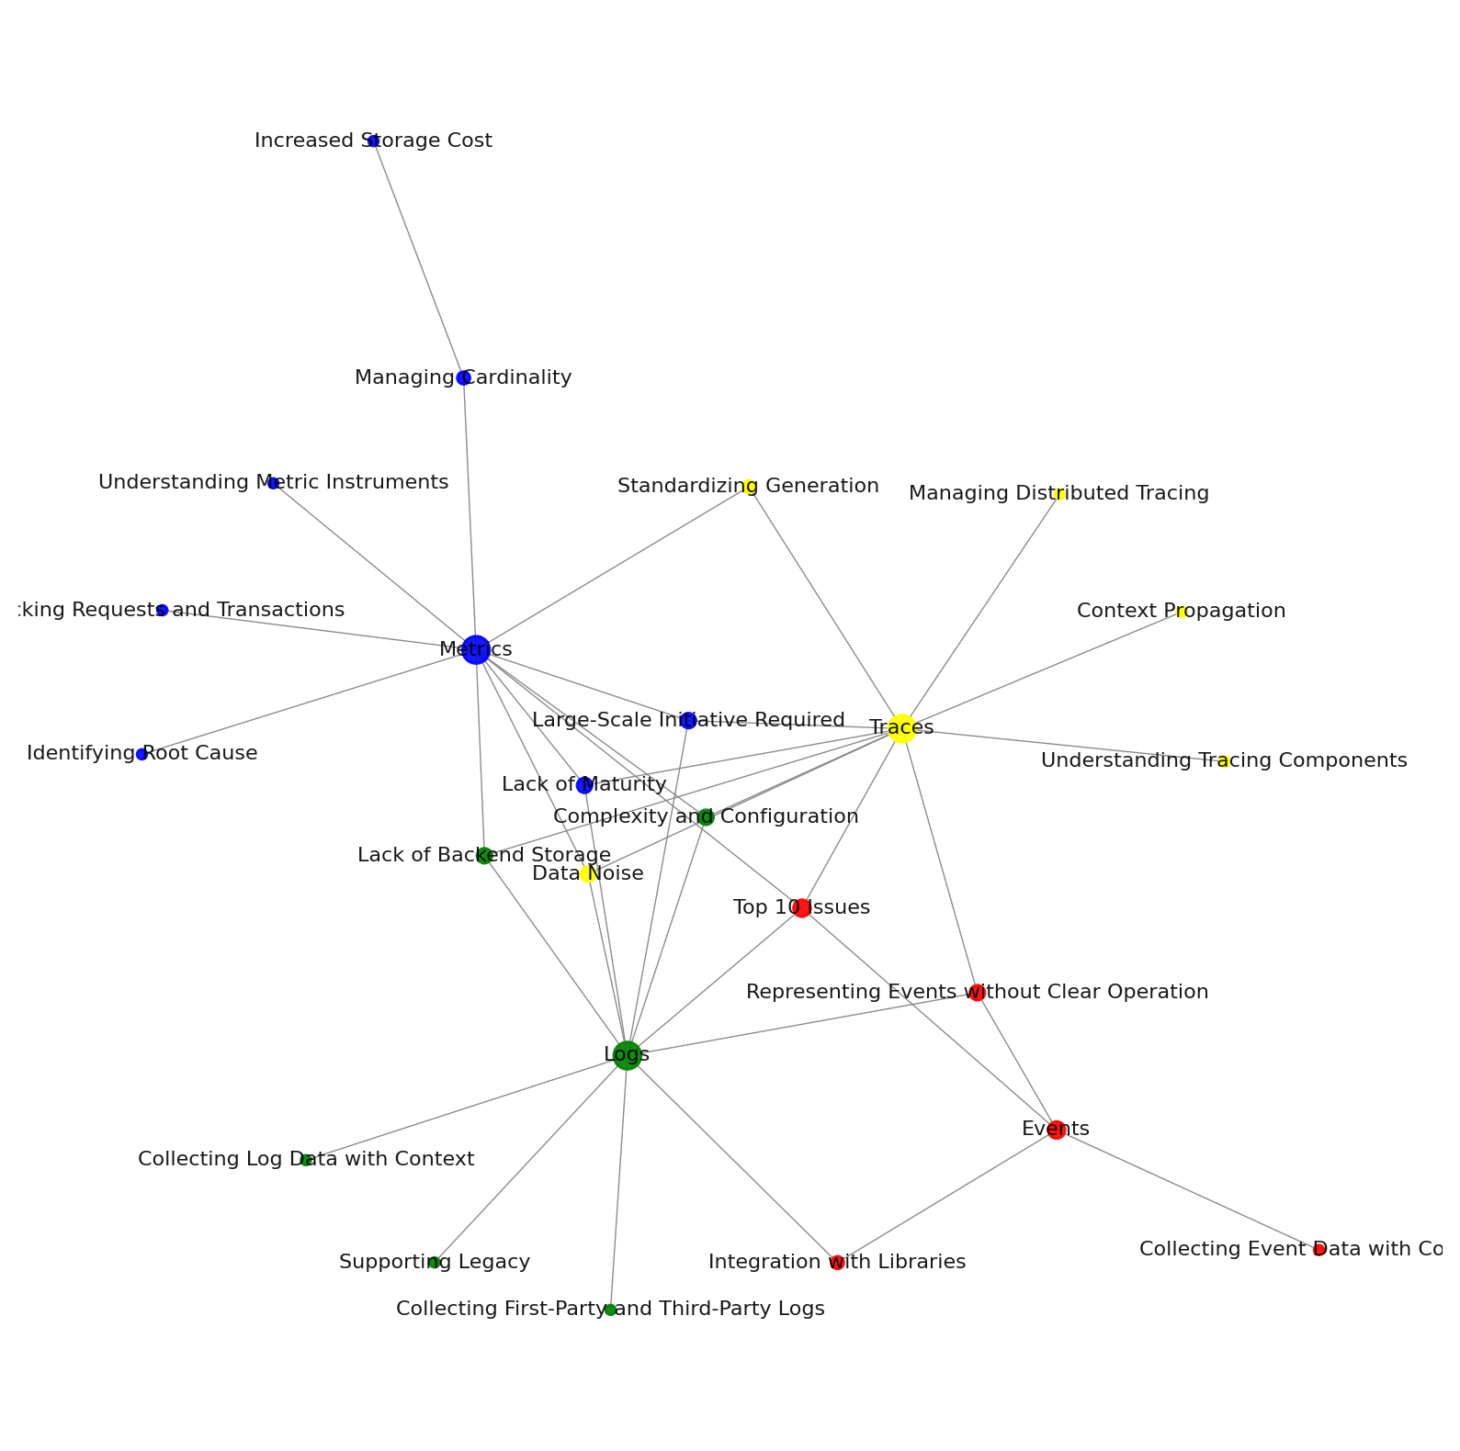
Metrics: Businesses must address the financial impact of high cardinality in metrics, which increases storage costs. There’s also the necessity to comprehend and utilize metric instruments for enhanced data collection, all while grappling with the emerging nature of OpenTelemetry’s metrics component. Implementing OpenTelemetry is not a trivial change; it demands significant organizational commitment and resources. The complexities of configuring OpenTelemetry will likely grow, demanding sophisticated management to maintain efficiency at scale. There is a gap in backend solutions for storage, analysis, and visualization, requiring integration with third-party tools. Data noise remains a challenge, complicating the extraction of actionable insights. Standardizing the generation and collection of telemetry data is critical, as is the ability to track requests and transactions effectively to expedite issue resolution.
Logs: Seamless integration with existing log libraries is crucial for consistent observability, alongside the collection of contextual log data. Supporting a legacy system of logs while transitioning to OpenTelemetry requires careful planning and support for legacy and third-party logging mechanisms. As with metrics, the maturity of logging components is still in development.
Traces: Understanding the intricacies of tracing components is vital, particularly the management of context propagation across different formats. Distributed tracing management is a complex task that allows for the tracking of requests and transactions through services, which is essential for identifying bottlenecks and optimizing performance.
Events: Challenges include representing events without clear operation spans and integrating OpenTelemetry with existing event libraries. Collecting event data with context is necessary for a holistic observability strategy.
In summary, organizations must navigate the intricacies of OpenTelemetry’s evolving landscape, requiring a dedicated effort to manage the associated complexities and to integrate OpenTelemetry with the existing technology stack effectively. The need for large-scale initiatives, coupled with the complexity of implementation and management, necessitates a proactive approach to ensure the successful adoption of OpenTelemetry, which is crucial for the observability and operational resilience of modern applications.
OpenTelemetry on Reddit
Implementing OpenTelemetry within a DevOps framework presents complex challenges for businesses, including establishing a robust infrastructure to handle intensive resource demands for telemetry data collection and observability tool hosting. Seamless integration with varied technology stacks, ensuring data security and privacy, automating secure deployments, maintaining consistency across divergent production and pre-production environments, and managing the high volume of generated data all demand strategic planning and resource optimization. Addressing these challenges is pivotal for organizations to harness the full potential of OpenTelemetry, necessitating a combination of strong infrastructural foundations, meticulous resource management, and adherence to stringent security protocols.
1. Infrastructure and hosting challenges
OpenTelemetry requires a robust infrastructure to collect, process, and export telemetry data. This can be a challenge, especially in self-hosted environments where resources may be limited. For instance, you may need to self-host instances of Kibana, Zipkin, Prometheus, and Grafana for observability. This can be resource-intensive and may require significant computational power and storage capacity.
2. Integration and compatibility issues
OpenTelemetry needs to be integrated with various parts of your tech stack, including your service mesh (like Istio), CI/CD pipeline, and container registry. Ensuring compatibility and seamless integration can be a complex task, especially in a microservices architecture where there are numerous independent services.
3. Data security and privacy concerns
OpenTelemetry collects a vast amount of data, some of which may be sensitive. Ensuring the security of this data is paramount. For instance, if you’re using Terraform for infrastructure management, you’ll need to encrypt secrets in the Terraform files using tools like git-crypt.
4. Automating deployments and testing
Automating the deployment of changes to the pre-production environment and running integration tests can be challenging. If you’re using a GitOps workflow, you’ll need to ensure that deployments can only happen on protected branches to prevent unauthorized changes.
5. Managing divergent environments
If you have separate Kubernetes clusters for production and pre-production environments, keeping these environments in sync can be a challenge. Changes in one environment can potentially affect the other, leading to inconsistencies and potential issues.
6. Resource management
OpenTelemetry can generate a large volume of data, which can put a strain on your resources. Managing these resources effectively, especially in a self-hosted environment, can be a significant challenge. To overcome these challenges, it’s crucial to have a well-thought-out implementation plan, robust infrastructure, and effective resource management strategies. Additionally, using automation tools and following best practices for data security can help mitigate some of these issues.
Connecting the dots between OpenTelemetry-related Subreddits
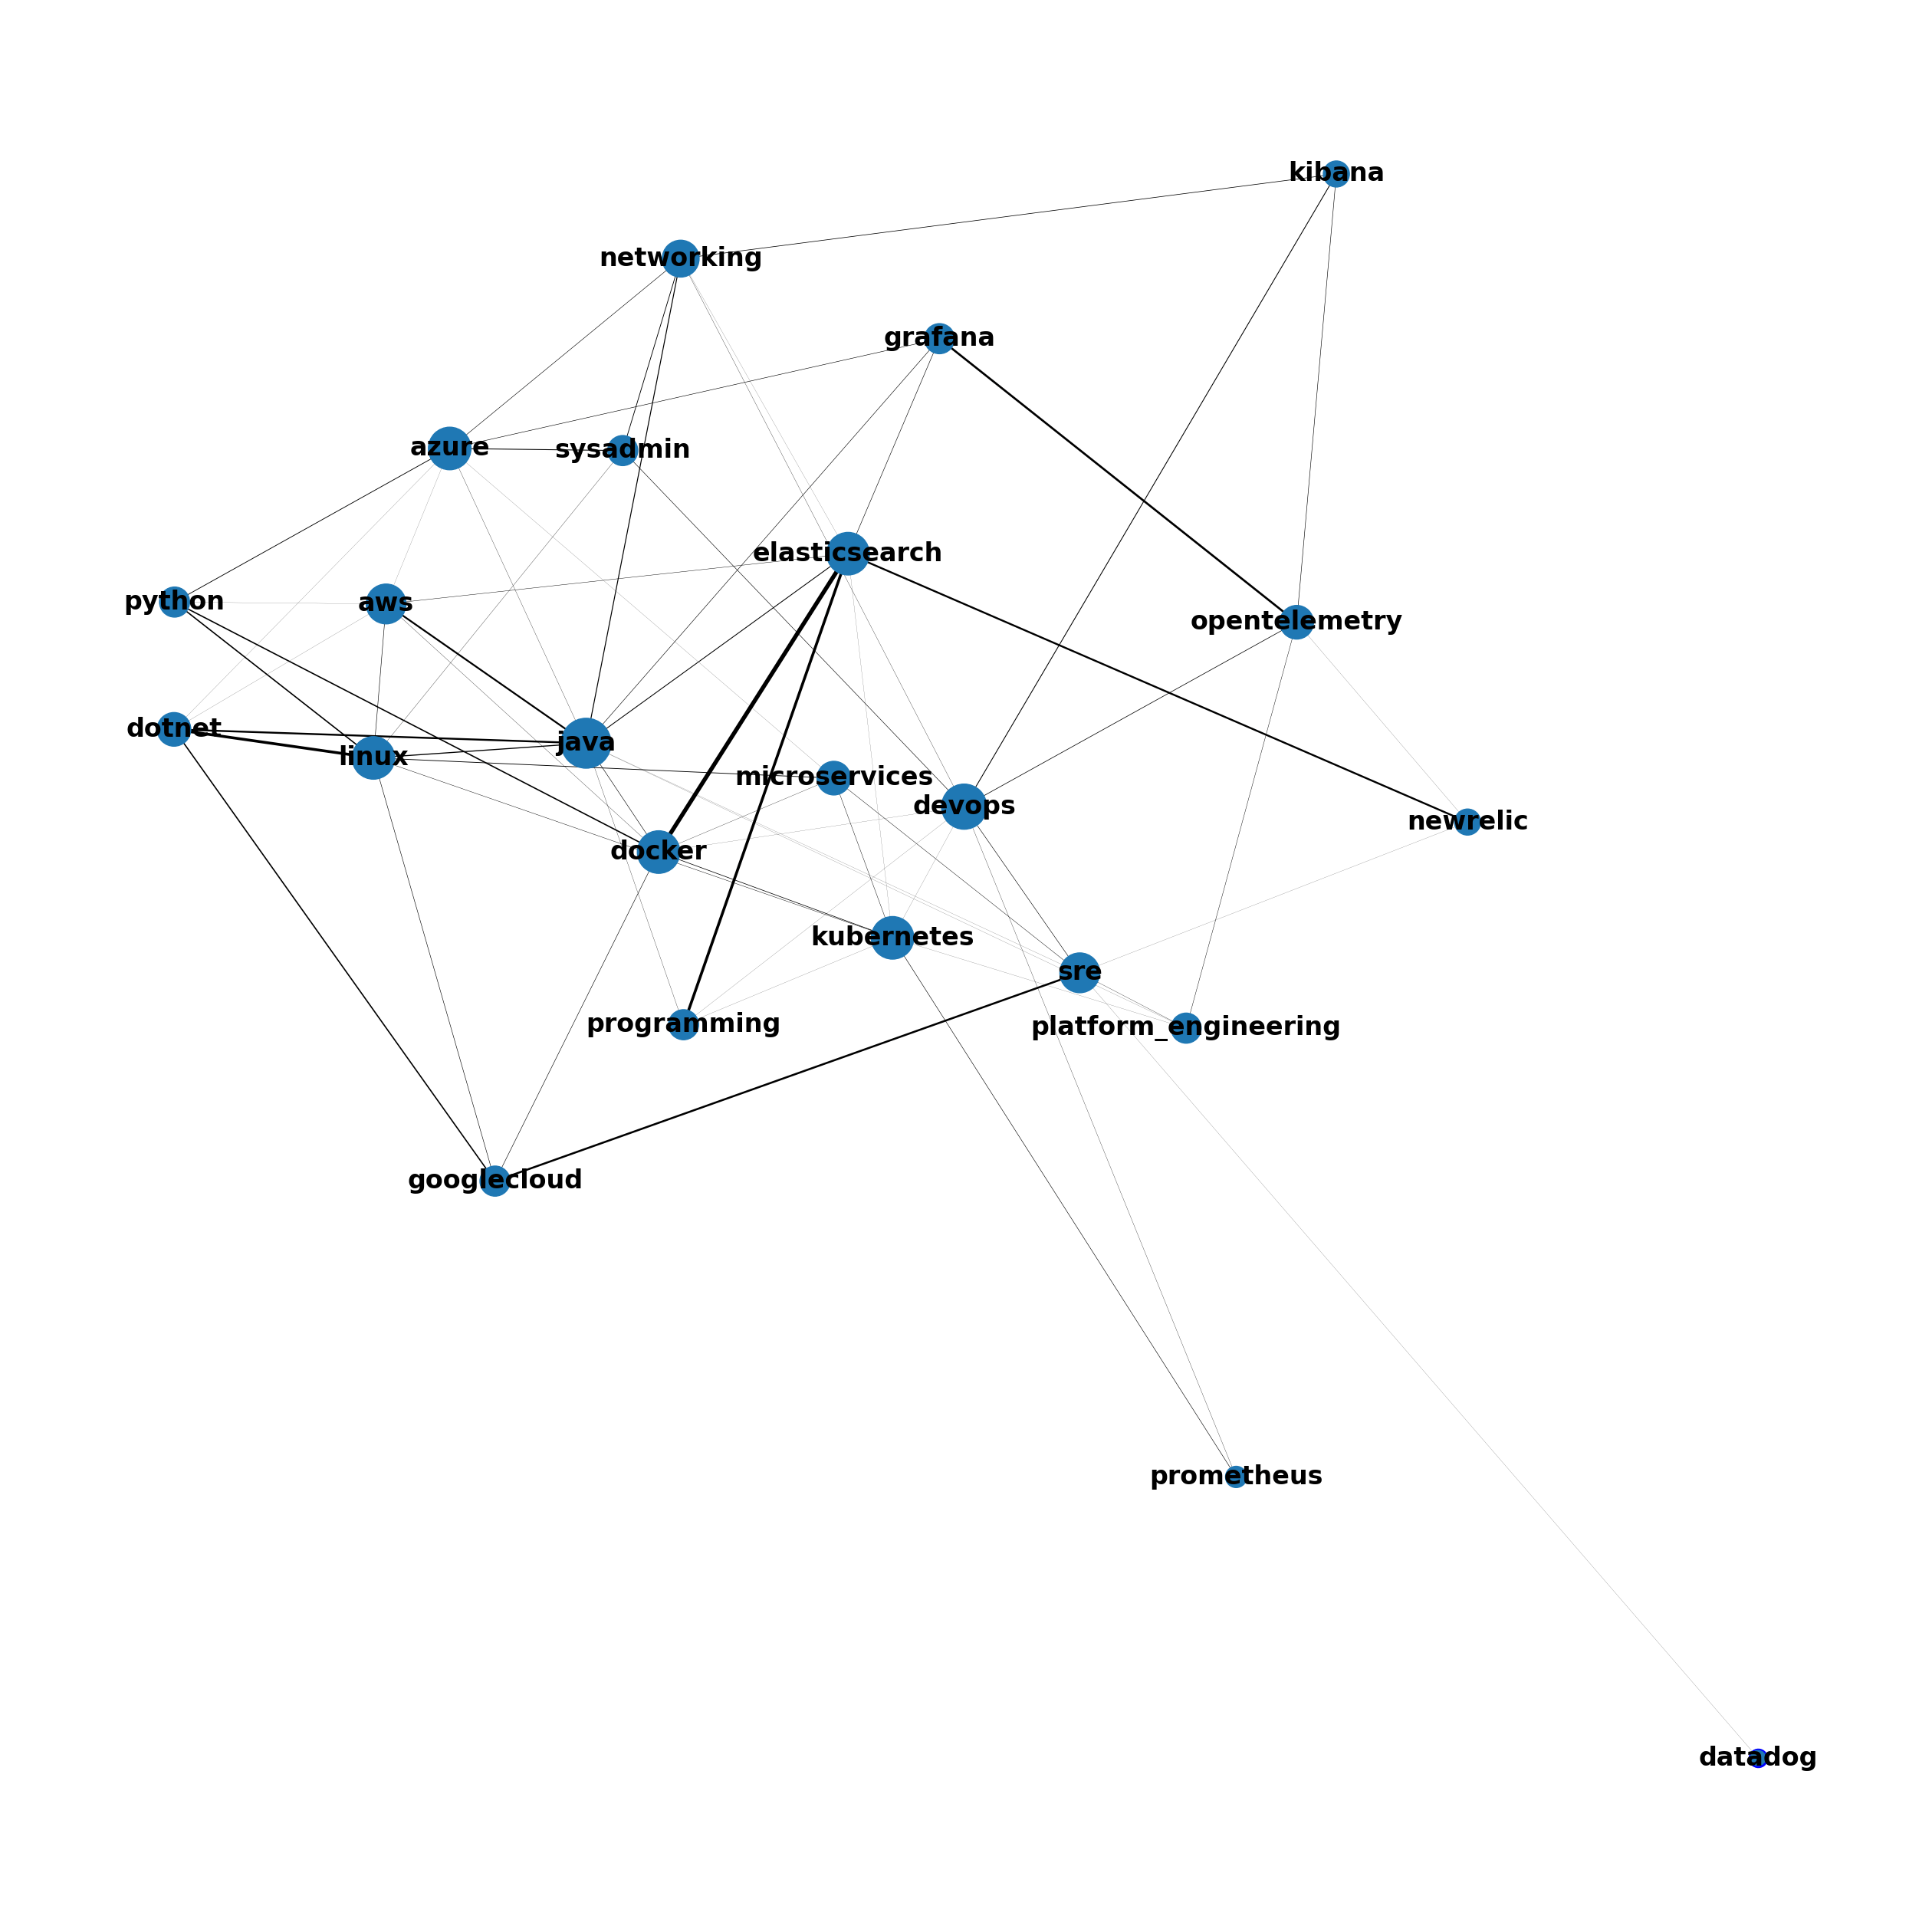
1. Community intersection: There is a significant overlap between users active in the OpenTelemetry subreddit and those in subreddits focused on related DevOps tools and practices, such as Kubernetes, Grafana, Elasticsearch, and programming. This indicates a shared interest or user base among these communities.
2. Relevance of observability: Subreddits for specific observability tools, like Grafana, Elasticsearch, Kibana, New Relic, and Datadog, are connected to the OpenTelemetry subreddit, highlighting OpenTelemetry’s relevance in the observability space.
3. Broader DevOps ecosystem: The presence of connections to broader categories, like “devops,” “microservice,” “kubernetes,” and “programming” suggests that discussions around OpenTelemetry are part of a larger conversation about DevOps practices, microservices architecture, container orchestration, and software development in general.
4. Specific tool integrations: The graph shows that users are likely discussing how OpenTelemetry integrates with other popular DevOps and observability tools, as evidenced by the connections to tool-specific subreddits.
5. Role of OpenTelemetry in monitoring and site reliability: Connections to “SRE’” (Site Reliability Engineering) indicate that OpenTelemetry is a topic of interest in discussions around site reliability and system monitoring.
6. Vendor presence: The visibility of vendor-specific subreddits, like “datadog” and “newrelic,” connected to OpenTelemetry suggests that users may be comparing or integrating OpenTelemetry with these commercial monitoring solutions.
OpenTelemetry, DevOps, and platform engineering: Key takeaways
1. Active and growing community
OpenTelemetry has a vibrant and expanding developer community, as evidenced by the increasing number of unique contributors and total commits per year. This active engagement reflects the project’s importance and value in the observability space.
2. Integration and cross-language applicability
OpenTelemetry is designed to seamlessly integrate with various technologies, programming languages, and cloud platforms. It supports integration with popular tools like Docker, Kubernetes, Prometheus, and observability stacks. This cross-language applicability makes it relevant for full-stack development.
3. Focus on instrumentation and data flow
The OpenTelemetry community places significant emphasis on instrumentation, ensuring accurate data capture for effective observability. There is also a strong focus on optimizing data flow within observability tools, enhancing components and extensions, and ensuring seamless integration across diverse platforms.
4. Community discussions and challenges
The OpenTelemetry community actively discusses and addresses challenges related to integrating OpenTelemetry in different environments, adapting it with various cloud services, configuring complex systems, optimizing performance, and implementing advanced instrumentation techniques. These discussions reflect the community’s commitment to continuous improvement and knowledge sharing.
5. Relevance in observability space
OpenTelemetry plays a crucial role in the observability domain, providing critical visibility through metrics, traces, and logs. It is widely adopted and endorsed by the broader developer community, as indicated by its popularity on platforms like GitHub and Stack Overflow. OpenTelemetry’s influence extends beyond its immediate community, impacting the entire software development landscape.
These key learnings highlight the significance of OpenTelemetry as a powerful framework for observability, its growing community, and its relevance in diverse technology ecosystems.
