Introduction
With the shift from monoliths to microservices, today’s infrastructure and applications are complex, making them increasingly difficult to build and manage. It’s why people with SRE or DevOps experience have become crucial to organizations. It’s also why observability — once a term derided as monitoring rebranded — has come to the forefront as organizations struggle to gain visibility into their systems and understand the unexpected events that arise with this growing complexity.
To better understand the state of observability, we solicited input from industry practitioners for the Grafana Labs Observability Survey 2023. Hundreds of people responded, helping to paint a better picture of where companies are in their adoption journey, the challenges they face, and the myriad benefits uncovered by those that have made the move to centralized observability.
After compiling and analyzing the survey responses, we also conducted in-depth interviews with six Grafana Labs customers to get more granular information about the impact observability has had at their organizations.
In this report, you’ll get a window into where the industry is today and where it’s headed in the future. Survey respondents — 94% of whom use Grafana — have experience working on container-based architectures that necessitate this type of approach to maintaining the health of complex systems. They’re bullish on the corresponding tools and techniques, and many are actively using observability to save money and effort. Still, nearly one-third haven’t centralized observability, and many respondents say they’re eager for the continued growth and maturation of the market.

5 key takeaways
Companies are juggling lots of tools and data sources.
More than two-thirds of active Grafana users are pulling four or more data sources into Grafana. In addition, most teams are using at least four observability tools, while some organizations are using dozens.
Organizations are at different stages in their observability journey.
Most respondents have centralized observability, but nearly one-third still haven’t; some industries are further along than others.
Consolidated observability saves time and money.
Among companies that have centralized observability, 83% have saved time or money; many of those who haven’t jumped on board say they are eager to do the same.
Accountability and market maturity come to observability.
Most companies are using or considering service level indicators (SLIs) or service level objectives (SLOs), and respondents are eager to see the observability market continue to grow and mature.
Not all ROI is the same.
Different organizations have different objectives with their observability strategies. Yes, saving money is the overarching goal, but there are multiple paths to get there, including MTTx improvements, less toil and infrastructure maintenance, better adoption, a consistent developer experience, less complexity, SLOs, better capacity planning, and better alerting and visibility.
Centralized observability saves other teams from having to build their own monitoring infrastructure.
— Respondent from a financial services organization with more than 5,000 employees and that actively uses SLOs/SLIs
Observability overload: tools and data sources
With myriad data sources, environments, and observability and monitoring tools under their purview, survey respondents indicate that they’re working with lots of different resources these days.
Data sources
Among active Grafana users, 68% say they have at least 4 data sources configured in Grafana, with 28% of those pulling data from 10 or more sources. Larger organizations tend to use more data sources: 41% of companies with more than 1,000 employees pull in 10+ data sources, compared to just 7% for companies with 100 employees or fewer.
Number of tools in use
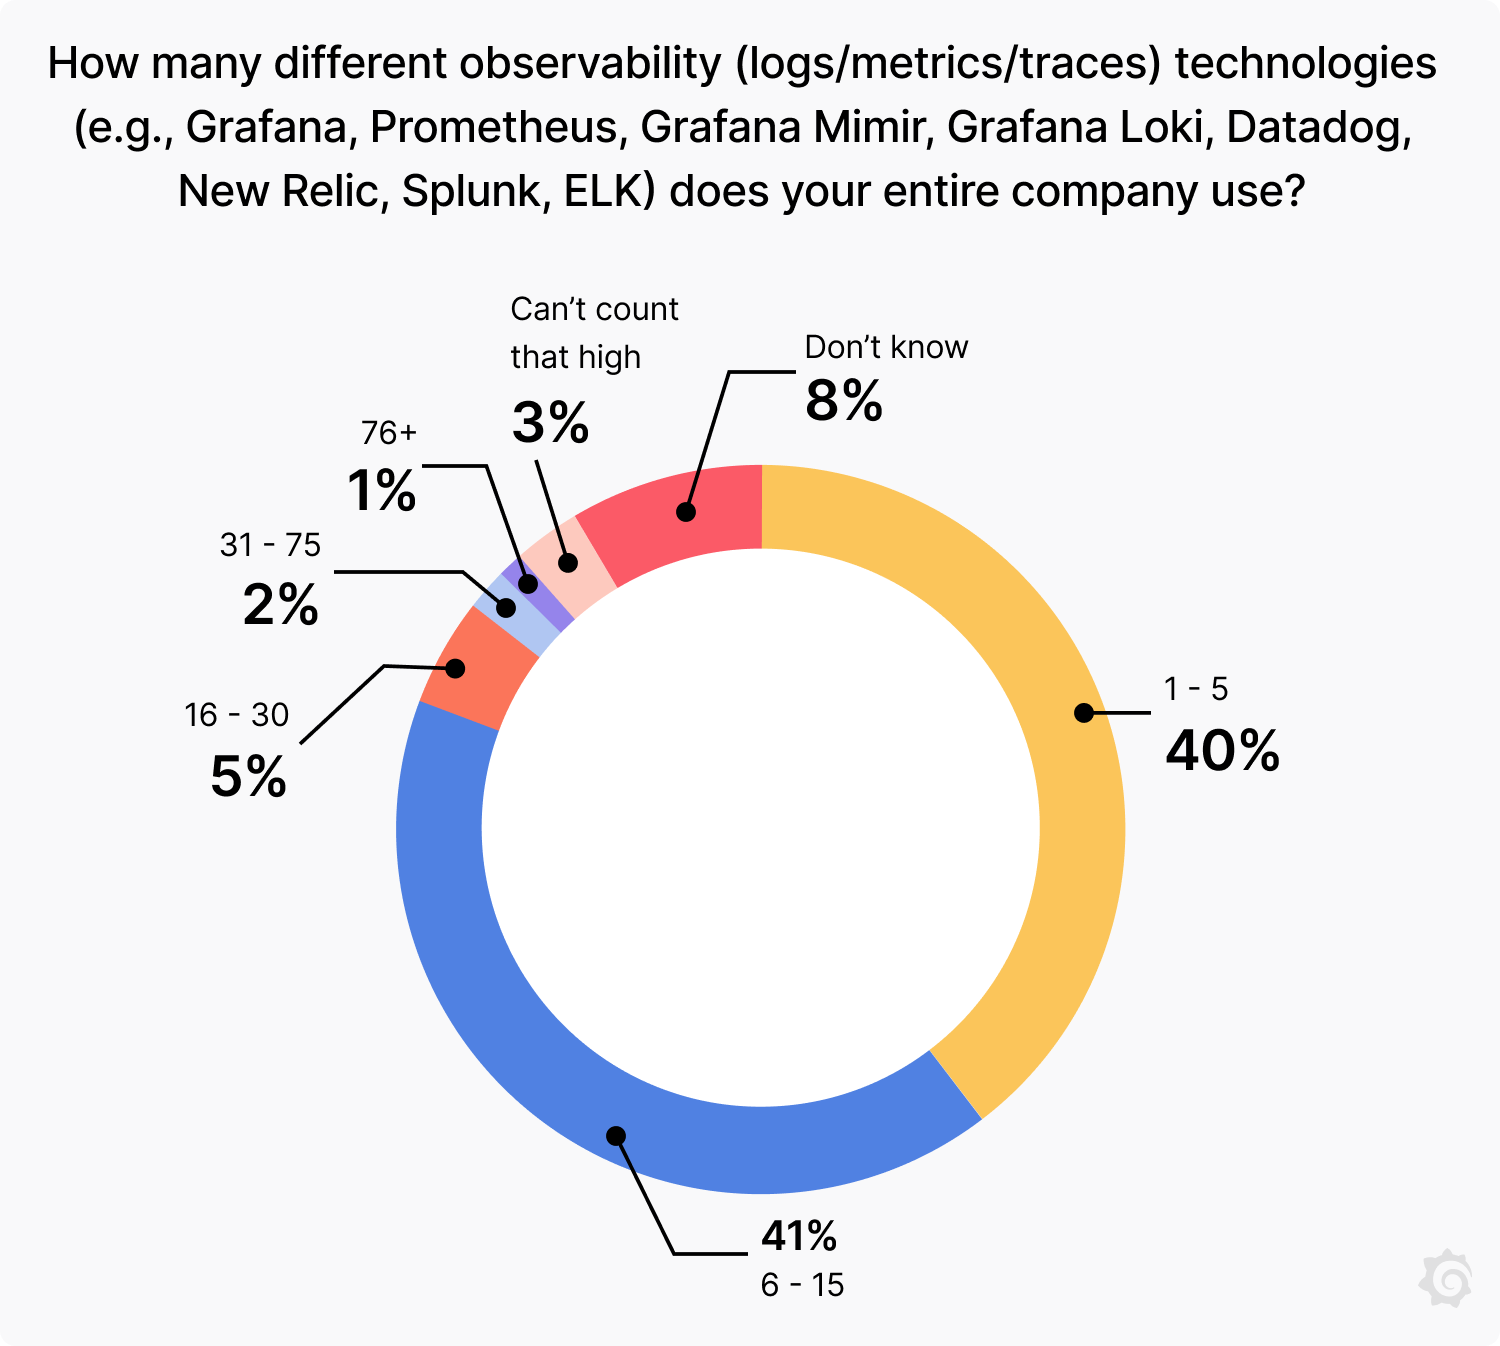
66% of respondents use 4 or more observability tools within their group, while 52% say their company uses 6 or more, including 11% that say their company uses 16 or more observability tools.
Tools by industry
The number of tools in use, in many cases, varies by industry. A higher percentage of respondents in the financial sector (31%) and government (27%) use 10 or more observability tools in their group (compared to 7% overall), while those in healthcare (44%) and energy and utilities (40%) tend to use between 1 and 3 tools (compared to 34% overall).
Number of environments
Most respondents (66%) have focused their observability efforts on a single environment (managed cloud, self-managed cloud infrastructure, or self-managed on-premises), while the remainder are using observability across at least two environments, including 9% that are deploying it across all three. Most companies also have some cloud native footprint, with only 24% operating exclusively on premises.
Commonly used tools
Grafana (94%) and Prometheus (79%) were by far the most commonly used observability tools, which points to heavy Kubernetes usage. But respondents listed more than 20 others in active use, including established products like Elastic (44%), Datadog (19%), and Splunk (22%), as well as emerging tools like Grafana Loki (44%).


Centralized logs greatly improved our time to resolution of any production error.
— Respondent from a financial services organization that runs self-managed, SaaS, and cloud environments
Time, money, perspectives, and priorities
The ultimate goal of observability is to ensure your systems are reliable and scalable, which in turn helps the business operate better. Respondents say observability saves time and money, but that means different things to different organizations.
Centralization
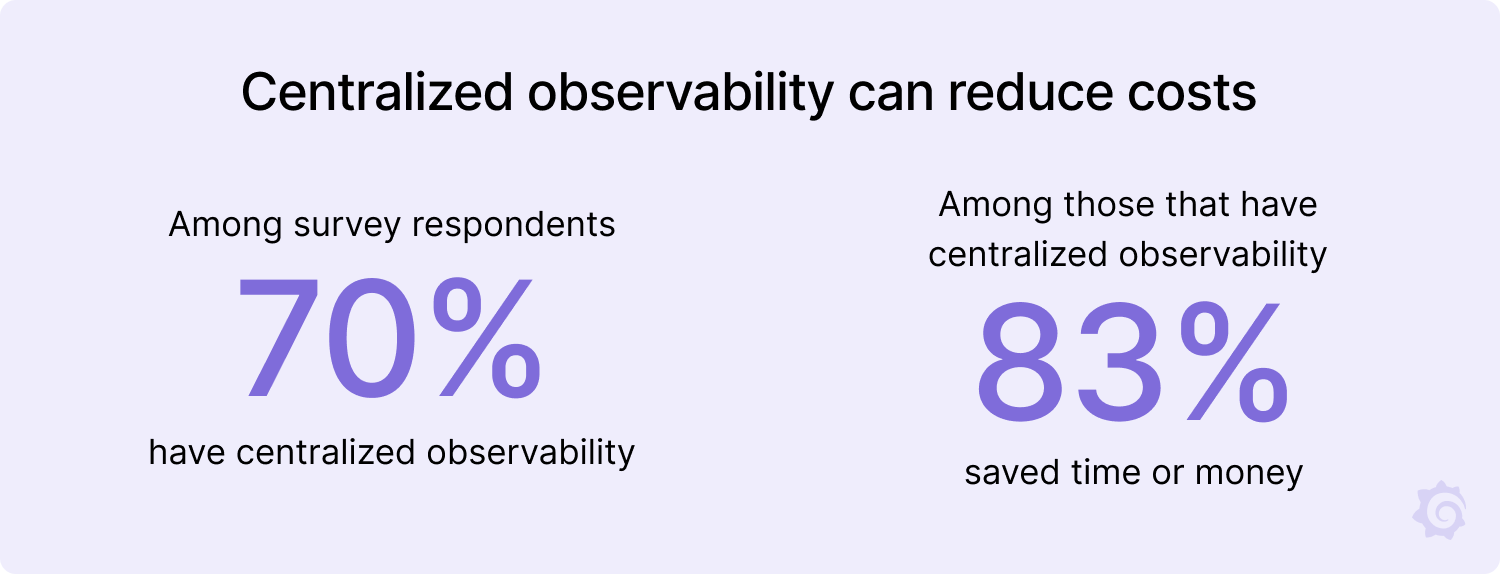
70% of respondents have centralized observability. Among those, 83% have saved time or money.
Industries diverge
Different industries appear to be at different stages of adoption. For example, less than half of those in retail or media and entertainment have centralized observability. Meanwhile, 70% of all financial sector companies have adopted centralized observability and saved time and money as a result, compared to 58% across all sectors.
Myriad benefits
Participants cited a host of benefits and use cases associated with centralized observability, including better adoption, less toil, MTTx improvements, a consistent developer experience, less complexity, SLOs, less infrastructure maintenance, better capacity planning, and better alerting and visibility.
Observability by department
Different organizations focus their observability strategies on different parts of their businesses. For example, when asked which departments are most important for data correlation, engineering and operations were by far the top answers (each 80%+), but other departments, including marketing, sales, and support, were also cited.
Different financial priorities
Among all respondents, 37% say they prioritize capacity planning when correlating data, 25% prioritize cost control, and 9% prioritize profitability and margin calculation. These figures occasionally vary by industry. For example, 50% of those in travel and transportation and media and entertainment prioritize data correlation for cost control. Also, 18% of software and technology companies prioritize data correlation for profitability and margin calculations, compared to 5% of all other respondents.


MTTR improved by 80% in 6 months.
— Respondent from a software and technology organization with centralized observability, using 7 to 9 tools within their group
SLOs, market maturity, and what comes next
Even though the survey respondents are likely more progressive when it comes to observability, there’s still room for growth in this emerging space — by practitioners and vendors.
The SLIs/SLOs spectrum
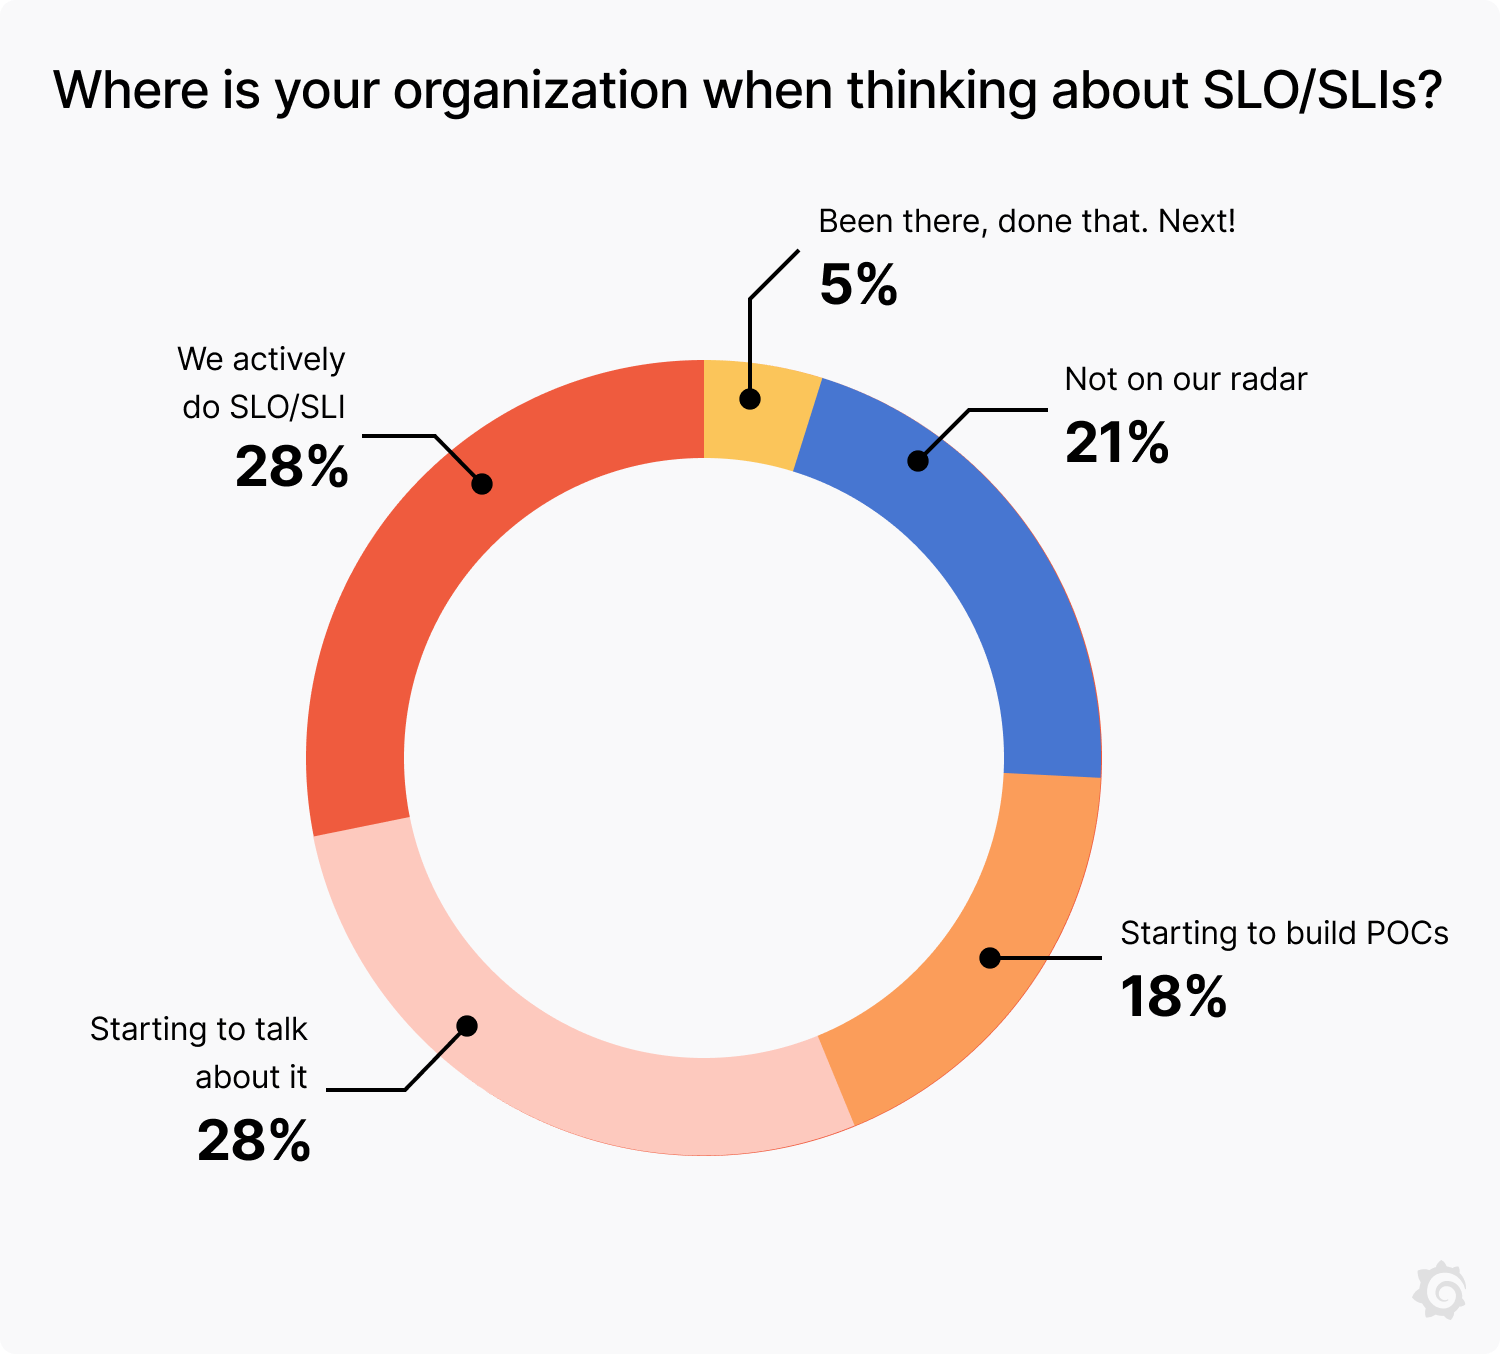
The proper execution of SLOs is a good sign of a mature observability strategy. Most respondents say they are using or moving in that direction, but they’re not all at the same stage. Moreover, only slightly more are actively using SLIs/SLOs (28%) than those that don’t have them on their radar (21%).
Biggest and smallest diverge
Companies with more than 5,000 employees are the farthest along with SLOs, with 40% actively using them. Conversely, only 15% of companies with 10 or fewer employees use SLOs, while 53% say they’re not on their radar.
Industry split
Some industries are quicker to adopt SLOs than others. Only 7% of media and entertainment companies — and 0% of automotive companies — say they use them today. Meanwhile, 38% of retail/e-commerce companies use SLOs.
On the horizon
We posed an open-ended question about what people were most excited about in this space, and it’s clear respondents are keen to see the market’s continued maturation. Some of the top items cited were continued centralization, improved ease of use, and greater data correlation. Several OSS tools also made the list, including OpenTelemetry and Grafana Loki.


Consistent and delightful developer experience; ease of access to important metrics, logs, and traces; faster debugging; better alerting; faster upgradability to newer versions of the stack.
— Respondent from a software and technology organization on improvements from introducing centralized observability into their self-managed stack and cloud infrastructure
About the respondents
Observability isn’t a new term, but it can mean different things to different people amid an evolving IT landscape. As such, we think it’s important to provide some context about the people who participated in this survey so you can compare our findings to where your organization is in its observability journey. For starters, we can make several inferences about how they operate:
They’re building containerized, distributed applications.
79% use Prometheus, which suggests that many are running their workloads on Kubernetes.
They like open source.
OSS projects like the Grafana LGTM Stack, InfluxDB, Jaeger, Prometheus, and Thanos are commonly in use.
They most likely work at large orgs.
Respondents come from companies of all sizes, but 47% work for companies with more than 1,000 employees.
They most likely work in tech.
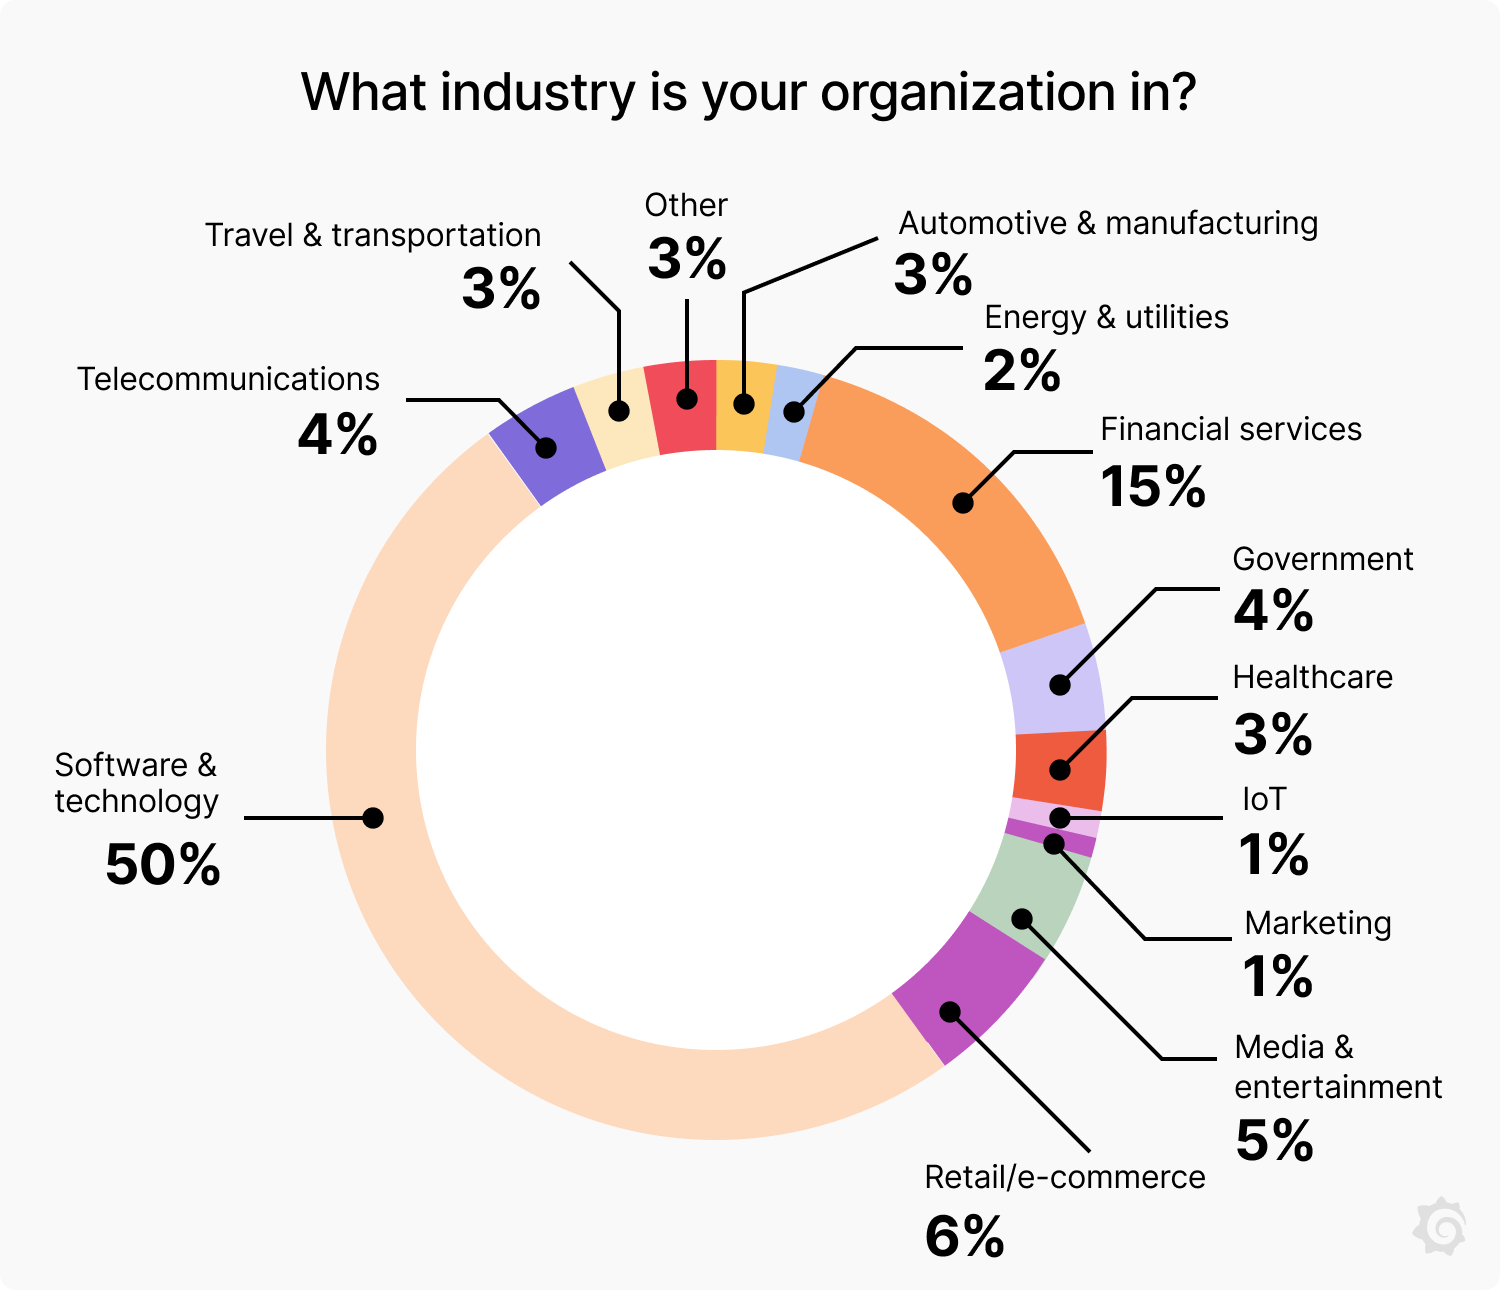
Survey participants came from more than 20 industries, but half work in software and technology. The next closest industry is financial services, which represented 15% of respondents.
In total, 268 individuals participated in the survey between September 2022 and January 2023. Grafana Labs developed the survey and solicited responses through newsletters, live events, social media, and its own website.


We have always tried to tie all solutions up in single views. I would say this approach has led to great reductions in MTTR. But, so far, overhead reduction is slow as the solutions mature. Adoption will pick up the more we invest in and refine the solutions.
— Respondent from a software and technology organization that uses 7 observability technologies for its self-managed stack and cloud infrastructure
A closer look at the
Quantifiable impact of observability
Interviews with six Grafana Labs customers offered a fuller picture of their observability journey
Once we collected the survey responses and analyzed the data, we decided to add another dimension to this report by conducting interviews with observability practitioners about how their companies are addressing some of the benefits and challenges presented in our key findings.
In order to get this level of access and discussion, we turned to our customers, sitting down with tech leads from six different companies to get a fuller picture of their priorities and how they’re internalizing observability best practices to achieve those goals. More specifically, we asked them how they’ve used Grafana Labs solutions to decrease MTTR, improve developer productivity, and save money through those investments.
We have anonymized the companies and the individual respondents in order to let them speak freely about their usage and strategy. We hope you find these snapshots beneficial and can use them as guideposts for your company in your journey to centralized observability.
Multinational software company
This company, which has tens of thousands of employees and generates billions in revenue every year, has cut its observability costs by roughly one-third by switching from Datadog to Grafana Labs solutions. Beyond the costs, they also appreciate the hands-on support and the relationship of mutual trust they’ve built — or, as this senior manager for observability put it, “What has attracted us to Grafana is the non-selling part.”
Still, observability hasn’t always been an easy sell. Company executives expect observability to make up 10% or less of their cloud spend, which is something the observability team has struggled to achieve. What’s ultimately won them over is the realization that they’ll never have just one observability tool, and Grafana’s “big tent” philosophy allows them to support many different data sources, which has translated to better results.
Measuring reliability comes down to KPIs focused on reducing MTTR. At the same time, they’ve improved developer productivity by tracking how much time those teams spend on critical service updates. They’ve also begun to measure the four DORA metrics — deployment frequency, mean lead time for changes, mean lead time to recover, and change failure rate — and hope to see the benefits of those efforts next year.
Enterprise telecommunications provider
This company, which provides customer experience (CX) services to global organizations, needs to prioritize observability because it is committed to providing five 9s of availability (99.999% uptime). To meet that commitment, it tracks resilience and reliability metrics, as well as DORA metrics. Every week, they also review the number of incidents incurred, metrics tied to their SLOs, outage minutes, and customer impact minutes.
And while OpEx savings is an outcome of observability, the priority for this company is building customer trust through better observability practices. These “costs” are looked at in three buckets:
- Resiliency, scalability, performance. They see erosion of trust as an opportunity cost. They’re able to measure this impact through their net promoter score (NPS), which has risen from the 50s to the 60s+ thanks to their high resiliency.
- ROI on spend. By investing in observability, they’re able to decrease the signal-to-noise ratio and reduce cardinality.
- Staffing allocations. The shift to observability with Grafana Labs, which has led to more automation and maturity, has enabled this company to shift FTE staffing to higher value projects for the business.
Going forward, they’re eager to continue promoting the capabilities of their observability tools internally, in an effort to advocate for prevention over remediation across the org.
Mortgage lender
This company, which has facilitated hundreds of thousands of home loans, defines its success metrics by system uptime and the response times of its platform. So far, this focus has been on internal benchmarks, rather than UX.
The lender reviews ROI against business goals, paying particularly close attention when it comes time for contract renewals with vendors. They look at FTE savings, vendor costs, hardware savings, payback periods, and more.
One of the ancillary benefits they have cited after working with Grafana Labs has been how the partnership has allowed employees to add observability to their skill sets, which in turn boosts the overall team’s efforts. This has also helped the organization attract new employees who want to work with the best technologies.
Gaming company
The engineering manager for this gaming provider says customer feedback can be a good place to start when analyzing site reliability, because their users will quickly point out when something goes wrong. However, relying solely on feedback only goes so far. For example, what about the problems customers don’t tell them about? Moreover, when a user can’t log in to their account, that doesn’t automatically provide answers about what part of the application isn’t working right.
To get the best coverage possible, the observability team focuses on measuring anything that could impact the user journey. They also track incidents that won’t necessarily impact users’ in-app experience but still pose risks, including anything related to security.
They’ve also started tracking DORA metrics as they seek to improve their observability strategy, but work remains. They still struggle with discoverability across a fragmented set of tools. Each team at the company manages observability on their own, which prevents the company from having a holistic view of system health. They are also looking for more application performance monitoring (APM) capabilities to get deeper insight into the health of specific services.
Fortune 100 healthcare company
Since they switched to Grafana, the engineers at this large healthcare and wellness company have reported that centralized observability has provided value, improved MTTx, and increased revenue. And that starts with practical, financial improvements.
While the organization called out cost savings as a benefit of working with Grafana Labs, the team that manages the observability platform is looking beyond the bottom line: They’re also using Grafana to outline how the team’s work impacts business outcomes.
Company executives get regular reports that show a direct link between the steps the observability team has taken with implementing Grafana and the improvements in the company’s net promoter scores (NPS). There are also indirect benefits, like a 40% spike in usage of the company’s mobile app and other portals, thanks in part to faster load times and an on-page error rate as low as 1%.
And when things do go wrong, they don’t panic. They know they can quickly surface the root cause of any issue with Grafana, which helps them get back to normal operations faster. For example, page load times had been a systemic issue that flew under the radar because the corresponding data wasn’t being surfaced. They were able to fix that with Grafana; today, they have enough visibility into anomalous data that they’ve changed their approach to root cause analysis. Instead of bunkering in war rooms for extended, investigative periods, now they simply address the issues with a 30-second Slack chat, sent directly to the responsible teams, with Grafana dashboard references.
The company even uses insights generated by working with Grafana in investor meetings to give stakeholders confidence in the actions they’re taking. Essentially, the data they’re collecting is finally getting the attention it deserves at the highest levels — and there is even a demand to expand the breadth of reporting at the executive level — because it can be presented in easily digestible formats.
Going forward, they want to help their customers begin tracking these measurements, too. The observability team would still do the heavy lifting, but by providing users with some observability basics, it could jump-start conversations about evaluating the metrics that factor into the success of a given project.
E-commerce company
This company has been incredibly successful in the D2C space. Their observability journey, on the other hand, is just getting started. They’ve established a goal of being able to monitor end-to-end business processes, but so far their monitoring has been somewhat random, according to the company’s hosting services engineering manager.
And getting this right is a major priority since system outages lead to major losses in revenue. They have the data sources they need to address those problems more quickly, and now it comes down to tying it all together. That means tracking upstream and downstream data trends to see what business processes are being affected. They’ve also set up dashboards for developers, but they want to do more to give them increased visibility into system health.
Despite being early in the transition, they’ve already made incremental improvements to developer productivity and costs. But they’re also focused on the bigger picture. Ultimately, their observability strategy comes down to providing value back to the business. So they see more ROI in investing the time to configure, compose, and customize their Grafana setup versus relying on a more expensive turnkey solution that isn’t actually tailored to their specific needs.
Conclusion
On behalf of Grafana Labs, we want to thank those who participated in the survey as well as those who took the time to view the results. The open source community, our customers, our contributors, and our users are all integral to everything we do here, and your input shapes how we operate and improve our projects and products on a daily basis.
We’re excited to see how far observability has come and how organizations are putting these tools and techniques into practice around the globe and across different industries and organizations of all sizes.
About Grafana Labs
Grafana Labs provides an open and composable monitoring and observability stack built around Grafana, the leading open source technology for dashboards and visualization. There are more than 2,000 Grafana Labs customers, including Bloomberg, Citigroup, Dell Technologies, Salesforce, and TomTom, and more than 1M active instances of Grafana around the world. Grafana Labs helps companies manage their observability strategies with the LGTM Stack, which can be run fully managed with Grafana Cloud or self-managed with the Grafana Enterprise offerings, both featuring scalable metrics (Grafana Mimir), logs (Grafana Loki), and traces (Grafana Tempo) as well as extensive enterprise data source plugins, dashboard management, alerting, reporting, and security. Grafana Labs is backed by leading investors Lightspeed Venture Partners, Lead Edge Capital, GIC, Sequoia Capital, Coatue, and J.P. Morgan.

