
Plugins 〉VictoriaMetrics


VictoriaMetrics


VictoriaMetrics datasource for Grafana
The VictoriaMetrics Grafana plugin allows Grafana to query, visualize, and interact with VictoriaMetrics, a high-performance metrics storage and processing system.
Capabilities
- Use MetricsQL to query metrics in Grafana.
- Use Explore mode with Grafana.
- Build dashboards and setup alerts.
- Use Ad Hoc filters.
- Template queries and expressions.
- Get insights about query execution bottlenecks via tracing.
- Automatically format queries via
Prettifybutton.
Try it at VictoriaMetrics playground!
Installation
For detailed instructions on how to install the plugin on Grafana Cloud or locally, please checkout the Plugin installation docs.
Manual configuration via UI
Once the plugin is installed on your Grafana instance, follow these instructions to add a new VictoriaMetrics data source, and enter configuration options.
Configuration via file
Provision of Grafana plugin requires to create datasource config file:
apiVersion: 1
datasources:
- name: VictoriaMetrics
type: victoriametrics-metrics-datasource
access: proxy
url: http://victoriametrics:8428
isDefault: true
- name: VictoriaMetrics - cluster
type: victoriametrics-metrics-datasource
access: proxy
url: http://vmselect:8481/select/0/prometheus
isDefault: false
Building queries
VictoriaMetrics query language is MetricsQL - query language inspired by PromQL. MetricsQL is backwards-compatible with PromQL, so Grafana dashboards backed by Prometheus datasource should work the same after switching from Prometheus to VictoriaMetrics. However, there are some intentional differences between these two languages.
Queries can be built using raw MetricsQL or via QueryBuilder. Overall, dashboarding experience is the same as with Prometheus datasource.
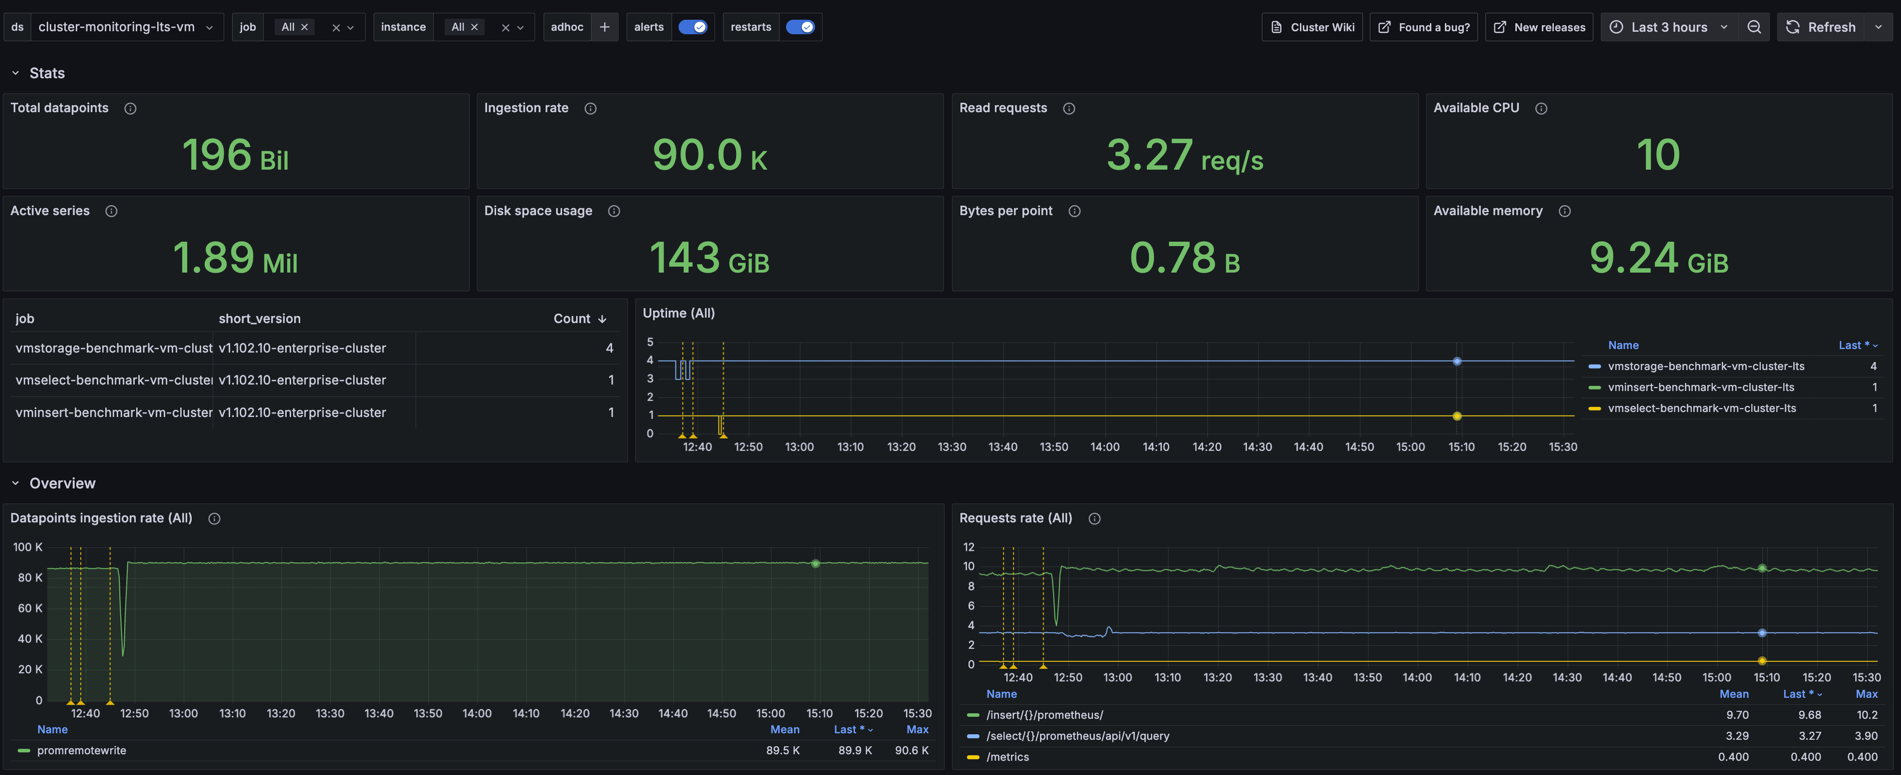
See panels examples at VictoriaMetrics playground.
How to use WITH templates
The WITH templates feature simplifies the construction and management of complex queries. You can try this feature in the WITH templates playground.
The "WITH templates" section allows you to create expressions with templates that can be used in dashboards.
WITH expressions are stored in the datasource object. If the dashboard gets exported, the associated WITH templates will not be included in the resulting JSON (due to technical limitations) and need to be migrated separately.
Defining WITH Expressions
- Navigate to the dashboard where you want to add a template.
Note: templates are available within the dashboard scope. - Click the
WITH templatesbutton. - Enter the expression in the input field. Once done, press the
Savebutton to apply the changes. For example:
commonFilters = {instance=~"$node:$port",job=~"$job"},
# cpuCount is the number of CPUs on the node
cpuCount = count(count(node_cpu_seconds_total{commonFilters}) by (cpu)),
# cpuIdle is the sum of idle CPU cores
cpuIdle = sum(rate(node_cpu_seconds_total{mode=‘idle’,commonFilters}[5m]))
You can specify a comment before the variable and use markdown in it. The comment will be displayed as a hint during auto-completion. The comment can span multiple lines.
Using WITH Expressions
After saving the template, you can enter it into the query editor field:
((cpuCount - cpuIdle) * 100) / cpuCount
Thus, the entire query will look as follows:
WITH (
 commonFilters = {instance=~"$node:$port",job=~"$job"},
 cpuCount = count(count(node_cpu_seconds_total{commonFilters}) by (cpu)),
 cpuIdle = sum(rate(node_cpu_seconds_total{mode='idle',commonFilters}[5m]))
)
((cpuCount - cpuIdle) * 100) / cpuCount
To view the raw query in the interface, enable the Raw toggle.
FAQ
How to convert dashboard from Prometheus to VictoriaMetrics datasource?
Make sure that VictoriaMetrics datasource plugin is installed, and a new datasource is created from the plugin.
Each panel in Grafana dashboard has a datasource dropdown when in Edit mode. Just choose the VictoriaMetrics datasource instead of Prometheus datasource in dropdown.
If datasource is configured via Grafana variable, then change variable to VictoriaMetrics datasource type.
Why VictoriaMetrics datasource doesn't support alerting?
Grafana doesn't allow forwarding Alert requests to alerting API /api/v1/rules for plugins which are not of Prometheus or Loki type.
See more details here.
License
This project is licensed under the AGPL-3.0-only.
Grafana Cloud Free
- Free tier: Limited to 3 users
- Paid plans: $55 / user / month above included usage
- Access to all Enterprise Plugins
- Fully managed service (not available to self-manage)
Self-hosted Grafana Enterprise
- Access to all Enterprise plugins
- All Grafana Enterprise features
- Self-manage on your own infrastructure
Installing VictoriaMetrics on Grafana Cloud:
Installing plugins on a Grafana Cloud instance is a one-click install; same with updates. Cool, right?
Note that it could take up to 1 minute to see the plugin show up in your Grafana.
Installing plugins on a Grafana Cloud instance is a one-click install; same with updates. Cool, right?
Note that it could take up to 1 minute to see the plugin show up in your Grafana.
Installing plugins on a Grafana Cloud instance is a one-click install; same with updates. Cool, right?
Note that it could take up to 1 minute to see the plugin show up in your Grafana.
Installing plugins on a Grafana Cloud instance is a one-click install; same with updates. Cool, right?
Note that it could take up to 1 minute to see the plugin show up in your Grafana.
Installing plugins on a Grafana Cloud instance is a one-click install; same with updates. Cool, right?
Note that it could take up to 1 minute to see the plugin show up in your Grafana.
Installing plugins on a Grafana Cloud instance is a one-click install; same with updates. Cool, right?
Note that it could take up to 1 minute to see the plugin show up in your Grafana.
Installing plugins on a Grafana Cloud instance is a one-click install; same with updates. Cool, right?
Note that it could take up to 1 minute to see the plugin show up in your Grafana.
For more information, visit the docs on plugin installation.
Installing on a local Grafana:
For local instances, plugins are installed and updated via a simple CLI command. Plugins are not updated automatically, however you will be notified when updates are available right within your Grafana.
1. Install the Data Source
Use the grafana-cli tool to install VictoriaMetrics from the commandline:
grafana-cli plugins install The plugin will be installed into your grafana plugins directory; the default is /var/lib/grafana/plugins. More information on the cli tool.
Alternatively, you can manually download the .zip file for your architecture below and unpack it into your grafana plugins directory.
Alternatively, you can manually download the .zip file and unpack it into your grafana plugins directory.
2. Configure the Data Source
Accessed from the Grafana main menu, newly installed data sources can be added immediately within the Data Sources section.
Next, click the Add data source button in the upper right. The data source will be available for selection in the Type select box.
To see a list of installed data sources, click the Plugins item in the main menu. Both core data sources and installed data sources will appear.
Changelog
tip
v0.13.3
- BUGFIX: correctly calculate step for the instant query, use
5mstep for the alerting queries if interval wasn't explicitly set by user. This change reduces alerts flapping for Grafana managed alerts. See this issue.
v0.13.2
- BUGFIX: use
5mstep for the alerting queries if interval wasn't explicitly set by user. This change reduces alerts flapping for Grafana managed alerts. See this issue.
v0.13.1
- BUGFIX: cleanup README.md for the plugin. Clarify how to make release. See this PR.
v0.13.0
v0.12.2
FEATURE: change
localStoragekey names to avoid collisions with other systems. See this PR.BUGFIX: clean up the plugin codebase after the plugin verification procedure. See this PR and this PR.
v0.12.1
- BUGFIX: fix issue with including the lezer-metricsql package to the build and fix public folder. See this PR.
- BUGFIX: fix plugin loading for query formatting in the editor. See this issue.
- BUGFIX: fix issue with "Prettify query" functionality corrupting dashboard JSON model. See this issue.
v0.12.0
⚠️ Breaking Change: Plugin ID Updated
Update Note 1:
In the new version of the plugin, the plugin ID has been updated. The new plugin ID is victoriametrics-metrics-datasource. This is a breaking change: Grafana will treat this as a new plugin.
- You must update the
allow_loading_unsigned_pluginsfield in thegrafana.iniordefaults.iniconfiguration file.
Example:allow_loading_unsigned_plugins = victoriametrics-metrics-datasource - If you are using provisioning, update the
typefield tovictoriametrics-metrics-datasourcein your provisioning configuration. - After making these changes, you must restart the Grafana server for the updates to take effect.
- FEATURE: update plugin id name to
victoriametrics-metrics-datasourceafter the review while sign procedure. See this issue.
v0.11.1
- BUGFIX: fix checksum calculation for release files.
v0.11.0
FEATURE: include request url in the
got unexpected response status codeerror message for troubleshooting. Thanks to @chenlujjj for the pull request.BUGFIX: fix issue with variables not working in adhoc filters. See this issue.
BUGFIX: fix query type switching when creating alerts in Grafana. See this issue
v0.10.3
- BUGFIX: fix query loading when using multiple visible queries in a panel. See this issue.
- BUGFIX: fix escaping when selecting metrics in the metrics browser. See this issue.
- BUGFIX: fix incorrect step calculation in annotation queries. See this issue.
v0.10.2
BUGFIX: fix the inspector query while press on refresh button. See this issue. Thanks to @yincongcyincong for the pull request.
BUGFIX: fix shows the value after prettified request in the table view. See this issue. Thanks to @yincongcyincong for the pull request.
v0.10.1
- BUGFIX: fixed healthcheck
v0.10.0
FEATURE: set the default query type to
instantwhen creating alerting rules. See this issue.BUGFIX: removed
/select/-prefixed part of path for /health endpoint requests. See this issue.
v0.9.1
- BUGFIX: fix parsing dots in the the
label_valuesfunction in the query builder. See this issue. Thanks to @yincongcyincong for the pull request.
v0.9.0
- FEATURE: make retry attempt for datasource requests if returned error is a temporary network error. See this issue
v0.8.5
- BUGFIX: restore support for Grafana versions below
10.0.0. See this issue. - BUGFIX: fix issue with forwarding headers from datasource to the backend or proxy. It might be helpful if a user wants to use some kind of authentication. See this issue.
v0.8.4
- BUGFIX: fix label join function in builder mode. See this issue. Thanks to @yincongcyincong for the pull request.
- BUGFIX: add missing rollup functions to the builder suggestion list. See this issue. Thanks to @yincongcyincong for the pull request.
- BUGFIX: properly apply ad-hoc filters for some rollup functions. See this issue. Thanks to @yincongcyincong for the pull request.
v0.8.3
- BUGFIX: fix an issue with prettify query if the query includes Grafana variables in the lookbehind window. See this issue.
- BUGFIX: fix an issue with ad-hoc filters applied to variables in query. See this issue. Thanks to @yincongcyincong for the pull request.
v0.8.2
- BUGFIX: fix parsing of label names with special characters for the query builder. See this issue.
v0.8.1
- BUGFIX: fix an issue in the template variable service where accessing the
datasourceproperty ofundefinedcaused a failure. See this issue.
v0.8.0
FEATURE: add variable type selector to optimize API usage, favoring /api/v1/labels and /api/v1/label/.../values over /api/v1/series. See this issue
BUGFIX: correct parsing the Annotations queries when template variables are used. See this issue
v0.7.0
FEATURE: add visually highlight partial responses. See this issue
BUGFIX: correct the queries for
Label FiltersandMetrics Browserfor metrics with special characters. See this issue
v0.6.0
FEATURE: add support metrics with special characters in query builder. See this issue
BUGFIX: fix the default link to vmui. See this issue
BUGFIX: fix the parsing logic in
renderLegendFormatto correctly replace legend label names. See this issueBUGFIX: fix query editor which produce a lot of requests for alerting rule evaluation. See this issue
v0.5.1
- BUGFIX: fix query builder logic to correctly parse metric names with dots. See this issue
v0.5.0
FEATURE: add Windows support for backend plugin. See how to build backend plugin for various platforms here. See this issue.
FEATURE: migrate to React to prevent warnings about the discontinuation of Angular support. See this issue.
FEATURE: add
--versionflag for backend datasource binary. See this issue.FEATURE: add a warning window about using
WITH templatesfor not yet created dashboards. See this issue.FEATURE: add a separate scope for storing
WITH templatesfor the Explore tab.BUGFIX: fix incorrect parsing when switching between code/builder modes in query editor. See this issue
v0.4.0
FEATURE: add datasource settings for limiting the number of metrics during discovery. The proper limits should protect users from slowing down the browser when datasource returns big amounts of discovered metrics in response. See this issue.
FEATURE: add a
prettify queryicon, which when clicked, formats the query. See this issue.FEATURE: change the style of the buttons
WITH templatesandRun in vmuito icons.BUGFIX: correctly handle custom query parameters in annotation queries. See this issue
BUGFIX: fix the duplication of labels in the legend when using expressions. See this issue
BUGFIX: fix the loading of metrics in the
metrics browser. See this issueBUGFIX: fix an issue where
metricsqlfunctions were not properly processed. See this issue
v0.3.0
- FEATURE: Improvements to WITH Templates (see this comment):
- The management of
WITH templateshas been transferred from datasource settings to the panel editing page; - Improved display of templates in auto-complete hints;
- Enabled auto-complete within curly braces for filters defined in templates;
- Added support for Grafana variables such as
$__interval,$__rate_interval, etc. in WITH expression validation; - Fixed the link to
vmuiwhen usingWITH templates.
- The management of
v0.2.1
- BUGFIX: respect the time filter change on updating dashboard variables. See this issue
v0.2.0
FEATURE: add the ability to define expressions for each panel so that users can define WITH templates once and then reuse them. See this issue.
FEATURE: add support MetricsQL to query builder. See this issue.
FEATURE: add the ability to change the link for Run in VMUI button. See this issue.
BUGFIX: fix the tracing display for Grafana version 9.4.
BUGFIX: support label with dots in names for template function
label_values(). See this issue.
v0.1.3
Released at 08-03-2022
FEATURE: Add links to VMUI from the query panel. See this issue.
FEATURE: Add option to show query trace from the query panel. See this issue and this issue.
FEATURE: Change license to AGPLv3. See this issue.
BUGFIX: respect time filter for variables update. See this issue
v0.1.2
Released at 21-12-2022
- FEATURE: add annotation support
- FEATURE: add datasource backend
v0.1.1
Released at 17-11-2022
- BUGFIX: Add enum
AbstractLabelOperator. See this issue
v0.1.0
Released at 11-11-2022