Plugins 〉Mapgl
Mapgl
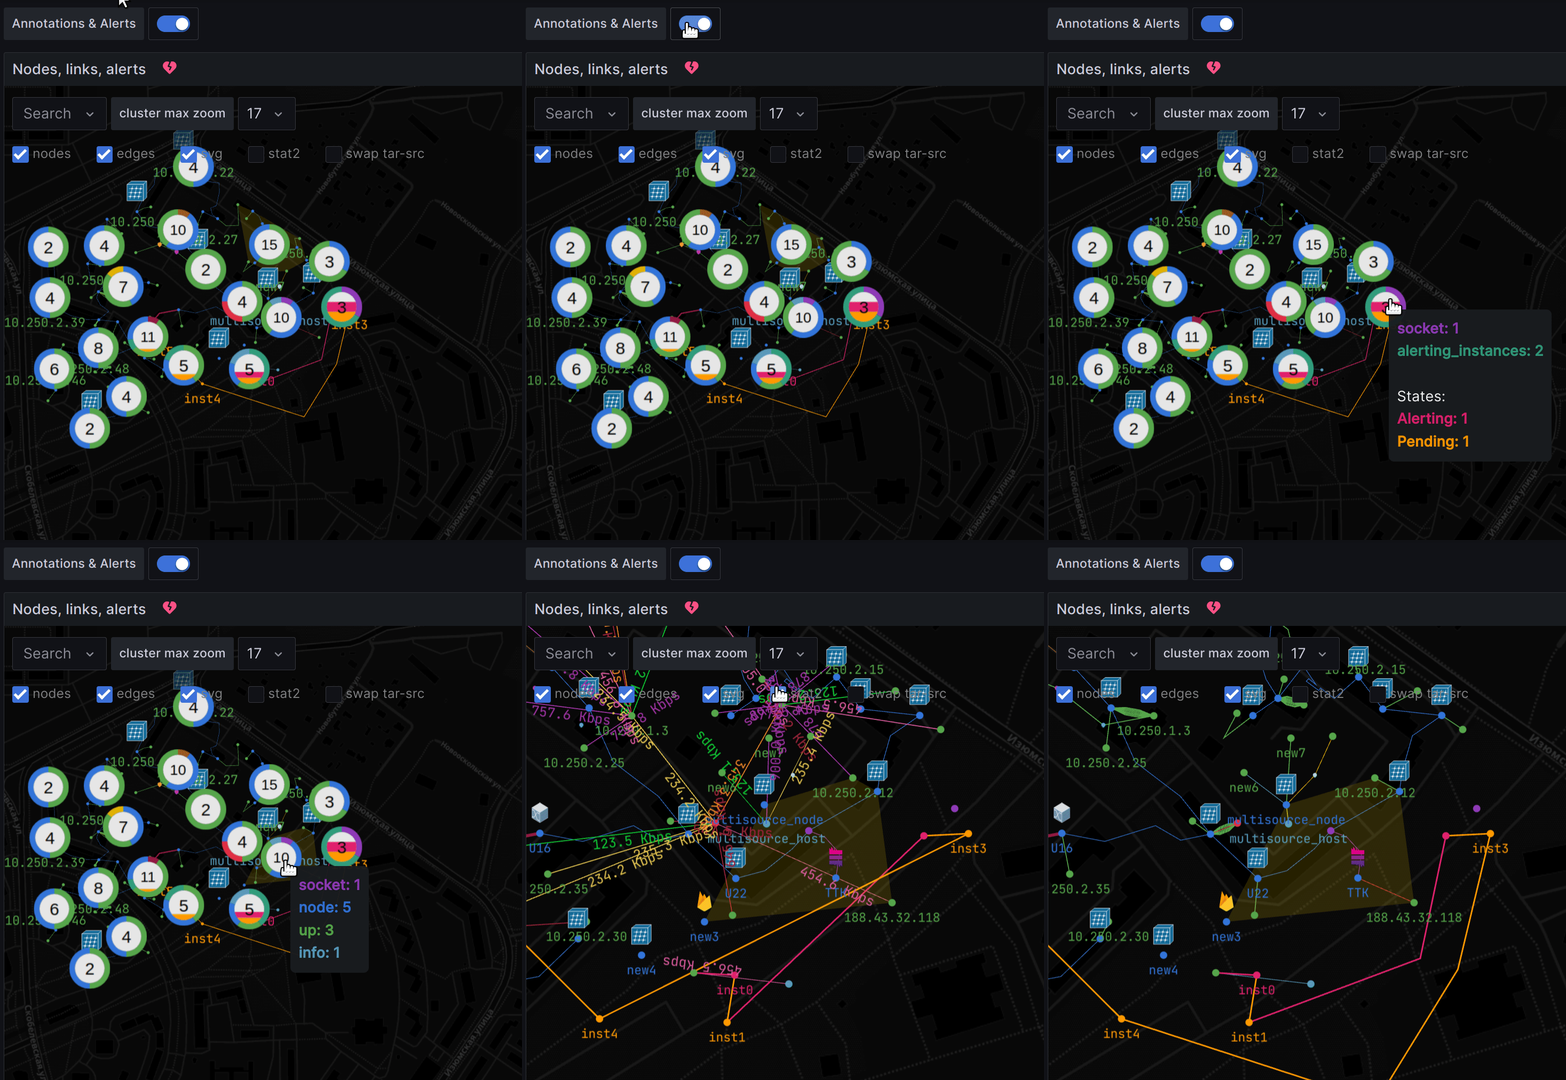
Nodes and edges geomap with metrics & alert states
extends base config options of Grafana Geomap with Deck.gl rendering and other features:
- network topology with nodes, links and metrics
- plot alert states from built-in Grafana alert rules
- path (multipaths) to source as an array of coordinates or refs to intermediate locations
- list paths for selected node in both directions (tar-src). Declare dashboard variable 'locRole' to save state
- extended thresholds processor for metric values with overrides
- donut chart icon for clusters listing color labels by thresholds
- svg icons, text labels with collision filter
- data-links: icon button in tooltip sets values for 'target' and 'source' dashboard variables to show charts dynamically in other panels.
- comment icons for intermediate coordinates from inlined text and color (ex.: [37.560447,55.550818, 0, "comment", "green"])
- aggregation typed nodes and offset for overlapping lines.
- stat1/stat2 switch to show straight path with secondary metric as a label
- optimized rendering of large datasets using WebGL
- multi layers support of Polygon, GeoJson from url, LineString layers
- tooltips with customizable fields
- customizable nodes search
Explore panel and datasource config examples at the Playground
Tutorial: Observing Zabbix events on a geospatial map
Required datasource fields:
- Coordinates for points in geojson, lon / lat or geohash format
- Metric field for color thresholds or link your panel to Grafana alerting rules


Grafana Cloud Free
- Free tier: Limited to 3 users
- Paid plans: $55 / user / month above included usage
- Access to all Enterprise Plugins
- Fully managed service (not available to self-manage)
Self-hosted Grafana Enterprise
- Access to all Enterprise plugins
- All Grafana Enterprise features
- Self-manage on your own infrastructure
Installing Mapgl on Grafana Cloud:
Installing plugins on a Grafana Cloud instance is a one-click install; same with updates. Cool, right?
Note that it could take up to 1 minute to see the plugin show up in your Grafana.
Installing plugins on a Grafana Cloud instance is a one-click install; same with updates. Cool, right?
Note that it could take up to 1 minute to see the plugin show up in your Grafana.
Installing plugins on a Grafana Cloud instance is a one-click install; same with updates. Cool, right?
Note that it could take up to 1 minute to see the plugin show up in your Grafana.
Installing plugins on a Grafana Cloud instance is a one-click install; same with updates. Cool, right?
Note that it could take up to 1 minute to see the plugin show up in your Grafana.
Installing plugins on a Grafana Cloud instance is a one-click install; same with updates. Cool, right?
Note that it could take up to 1 minute to see the plugin show up in your Grafana.
Installing plugins on a Grafana Cloud instance is a one-click install; same with updates. Cool, right?
Note that it could take up to 1 minute to see the plugin show up in your Grafana.
Installing plugins on a Grafana Cloud instance is a one-click install; same with updates. Cool, right?
Note that it could take up to 1 minute to see the plugin show up in your Grafana.
For more information, visit the docs on plugin installation.
Installing on a local Grafana:
For local instances, plugins are installed and updated via a simple CLI command. Plugins are not updated automatically, however you will be notified when updates are available right within your Grafana.
1. Install the Panel
Use the grafana-cli tool to install Mapgl from the commandline:
grafana-cli plugins install The plugin will be installed into your grafana plugins directory; the default is /var/lib/grafana/plugins. More information on the cli tool.
Alternatively, you can manually download the .zip file for your architecture below and unpack it into your grafana plugins directory.
Alternatively, you can manually download the .zip file and unpack it into your grafana plugins directory.
2. Add the Panel to a Dashboard
Installed panels are available immediately in the Dashboards section in your Grafana main menu, and can be added like any other core panel in Grafana.
To see a list of installed panels, click the Plugins item in the main menu. Both core panels and installed panels will appear.
Changelog
1.6.1
- fix cluster labels edit in thresholds to comply with braking < Tooltip > component since Grafana 10.3.0
- fix tooltip css classes for pointerEvents:all
- ncu u: bump deck.gl & luma.gl versions
1.6.0
- cluster legend-filter
- fullscreen and compass widgets
- migrate to deck.gl 9 (with WebGPU support in the near future)
1.5.0
- point circle and text label dimensions
- svg icon rules collapsible + resource picker
- bugfix: cluster hull polygon onHover doesn't lag on large datasets
1.4.0
- alerting states from built-in Grafana annotations query. State colors for nodes and clusters
- see-through convex hull polygon for cluster area
1.3.0
- cluster max zoom menu select to control clusterization
- convex hull polygon shows cluster boundaries, cluster expansion zoom on click
- restore Grafana >=9.2.5 support
- fix performance issues that occured on large datasets because of composite cluster+circles+icons+text layer with sublayers constantly recalculating. Now that IconGeoJsonLayer (circles+icons+text) is separated from IconClusterLayer, deck.gl has less to render
1.2.0
- svg icons for nodes
- text labels with collision filter.
- bug fixes: allow lineWidth custom size, no min/max
1.1.0
- Multi-source, multi-target support
- Switch path direction by declaring dashboard variable 'locRole'.
- Data-links: icon in tooltip to sets values for 'target' and 'source' dashboard variables. This lets you show charts dynamically in other panels.
- Comment icons for intermediate locations from text and color inlined in coordinates (ex.: [37.560447,55.550818, 0, "comment", "green"])
- Aggregation nodes and offset for overlapping lines.
- stat1/stat2 switch to disable offset and show secondary metric
- edge labels in stat2 mode , aggregation nodes labels.
1.0.2
- New: support for parent path as an array of coordinates or location names
- New: aggregation nodes and offset for overlapping lines in parent path.
- Parent line style improvements: -Extended path to root as a separate dotted line.
- Bug fixes:
- isolate config options for different layers;
1.0.1
- Multi layers support
- PolygonsLayer, Path (LineStrings) layer from frames datasource
- Static GeoJson layer with FeatureCollection support from GeoJson file (url)
- Advanced thresholds processor for metrics. Set specific color for any set of parameters describing group of features.
- Points show toggle
1.0.0
Initial release. Repository has a demo provisioned dashboard with mock datasource


