Plugins 〉Radar Graph
The Radar Graph plugin has been deprecated and is no longer maintained.
Radar Graph
Description
This grafana panel displays radar graphs using the Chart.JS library. (http://www.chartjs.org/)
The plugin was tested with:
- Elastic Search 5.5 as data source.
- InfluxDB 1.3.6
- PostGreSQL
- MariaDB
Installation
Copy the dist folder in your grafana plugin directory and rename it to radarpanel.
Compile
Run
- npm i
- grunt
Screenshots
Showcase
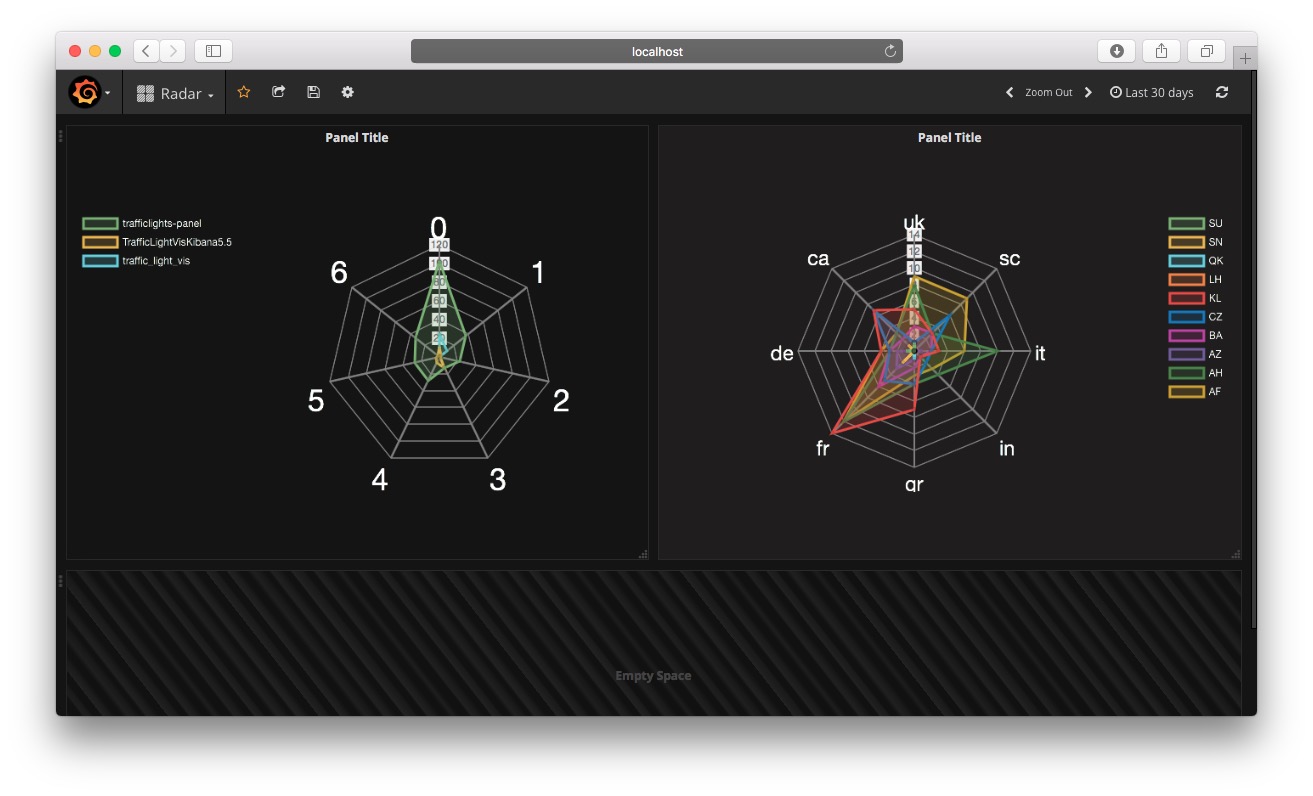
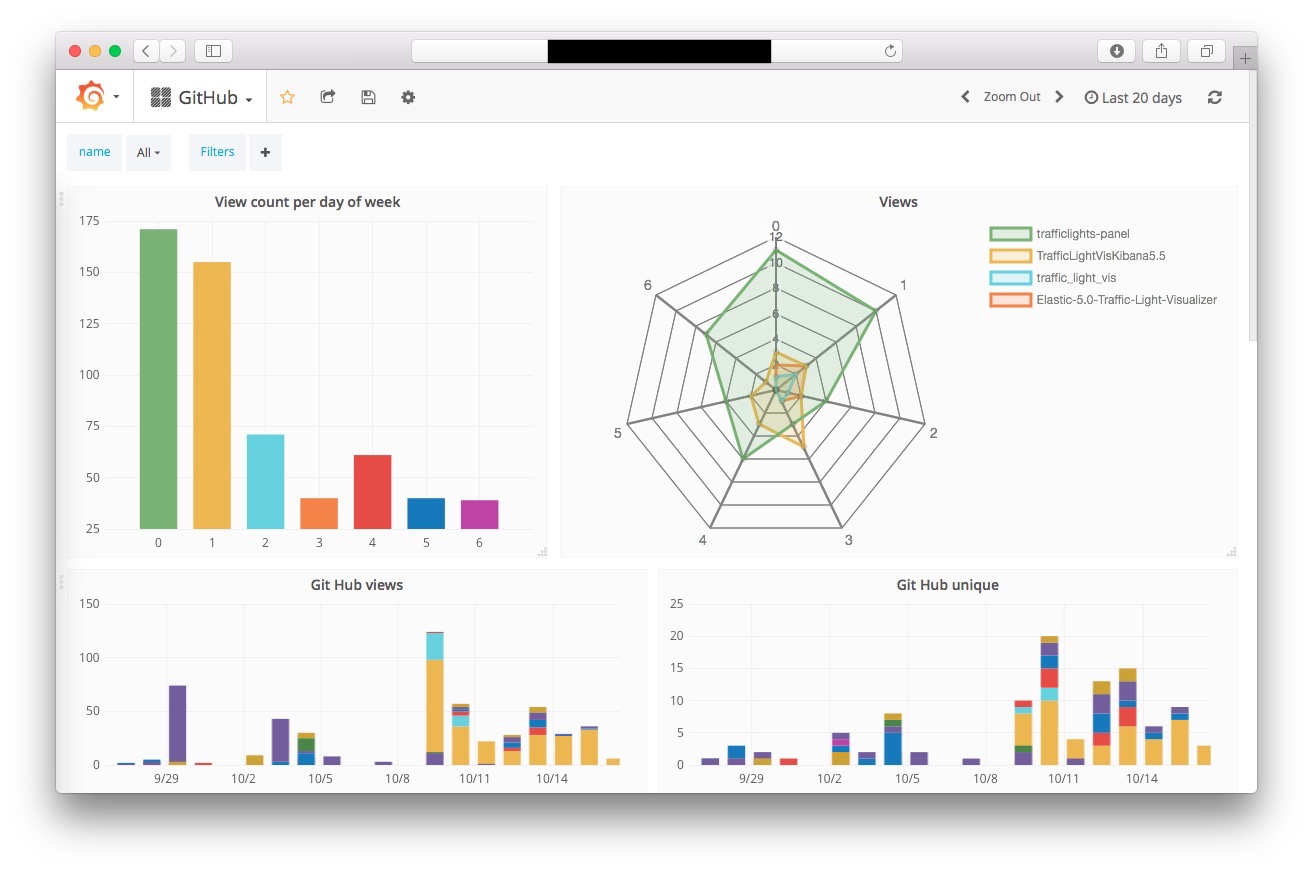
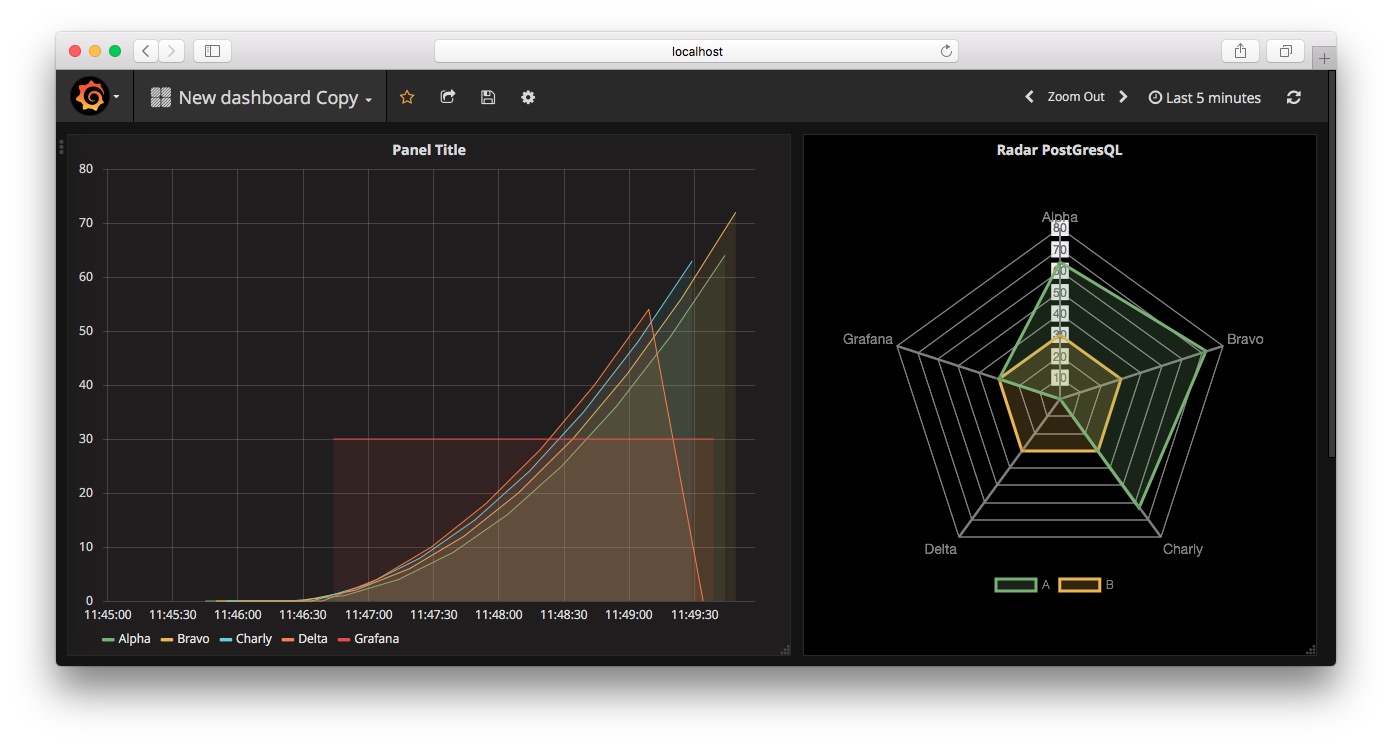
Metrics Configuration
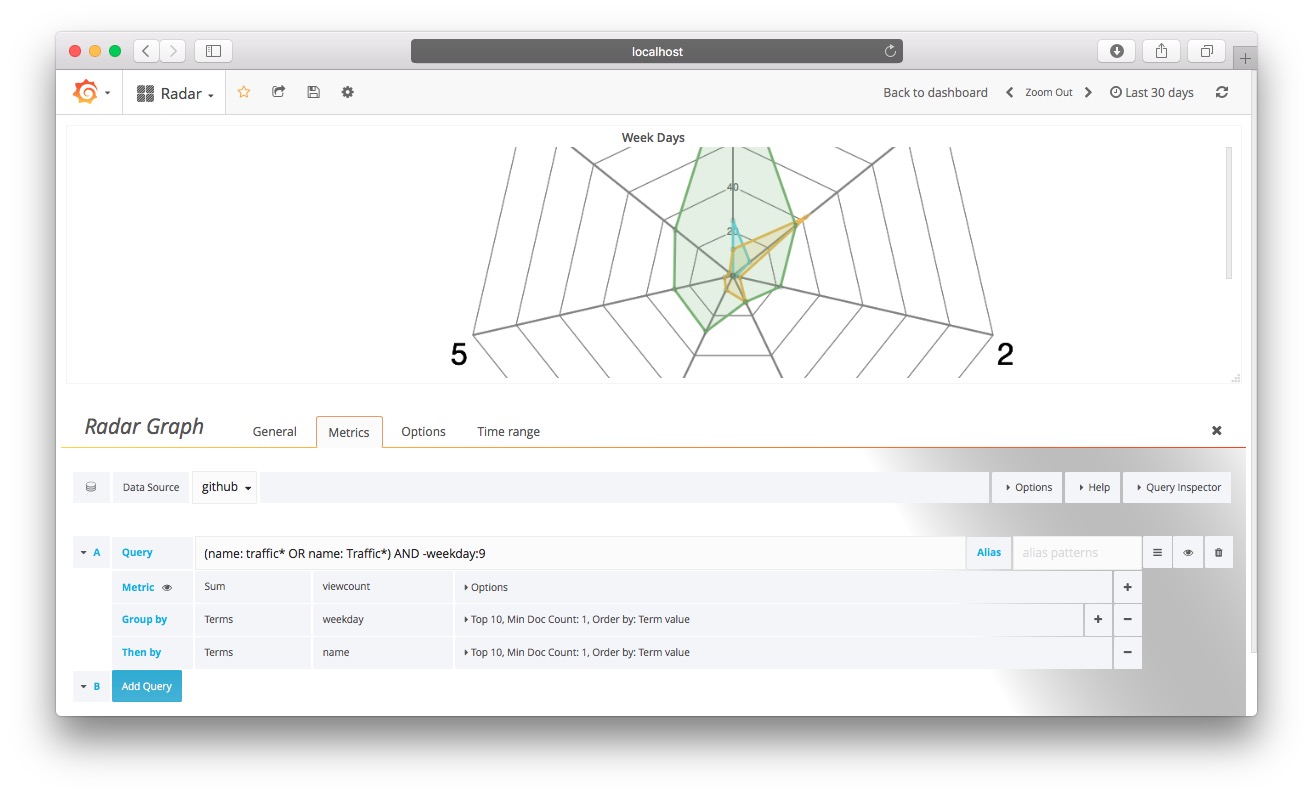
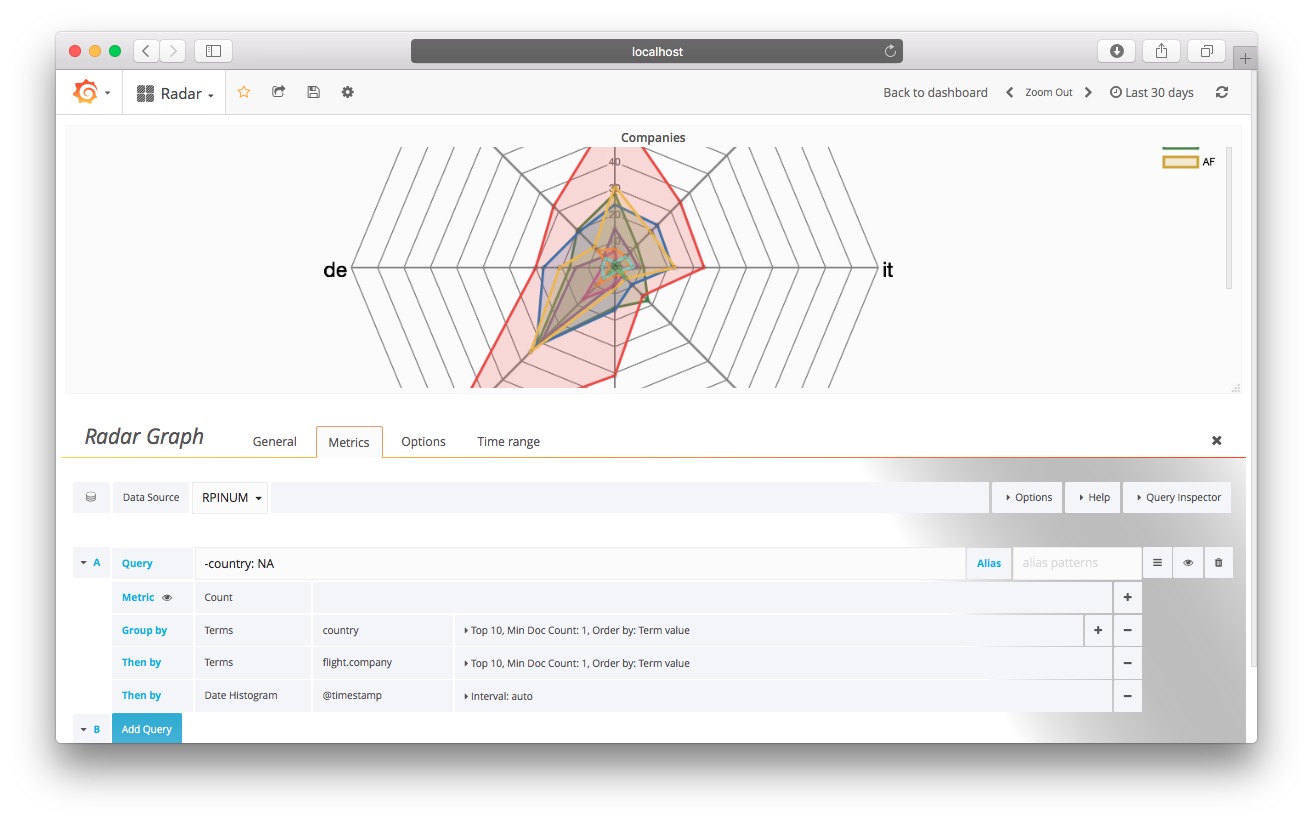
Elastic Search Configuration
The panel datasource must include a single query having the following characteristics:
- A single group (No date histogram)
- Two groups (No date histogram)
- Three groups. In this case the last group is a date histogram (As shown in the following screenshot) The value used is the last time serie point of the aggregation.
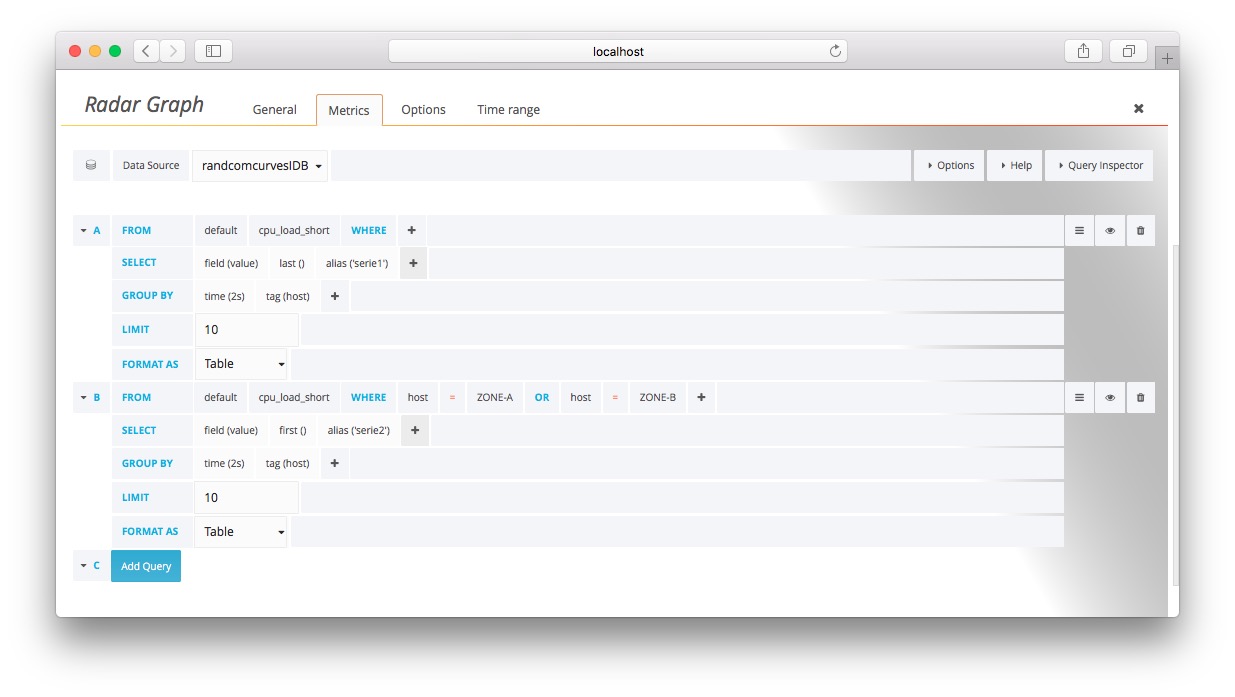
Influx DB Configuration
Note that the checkbox Ingnore TIME (InfluxDB) checkbox must be checked in the Options panel.
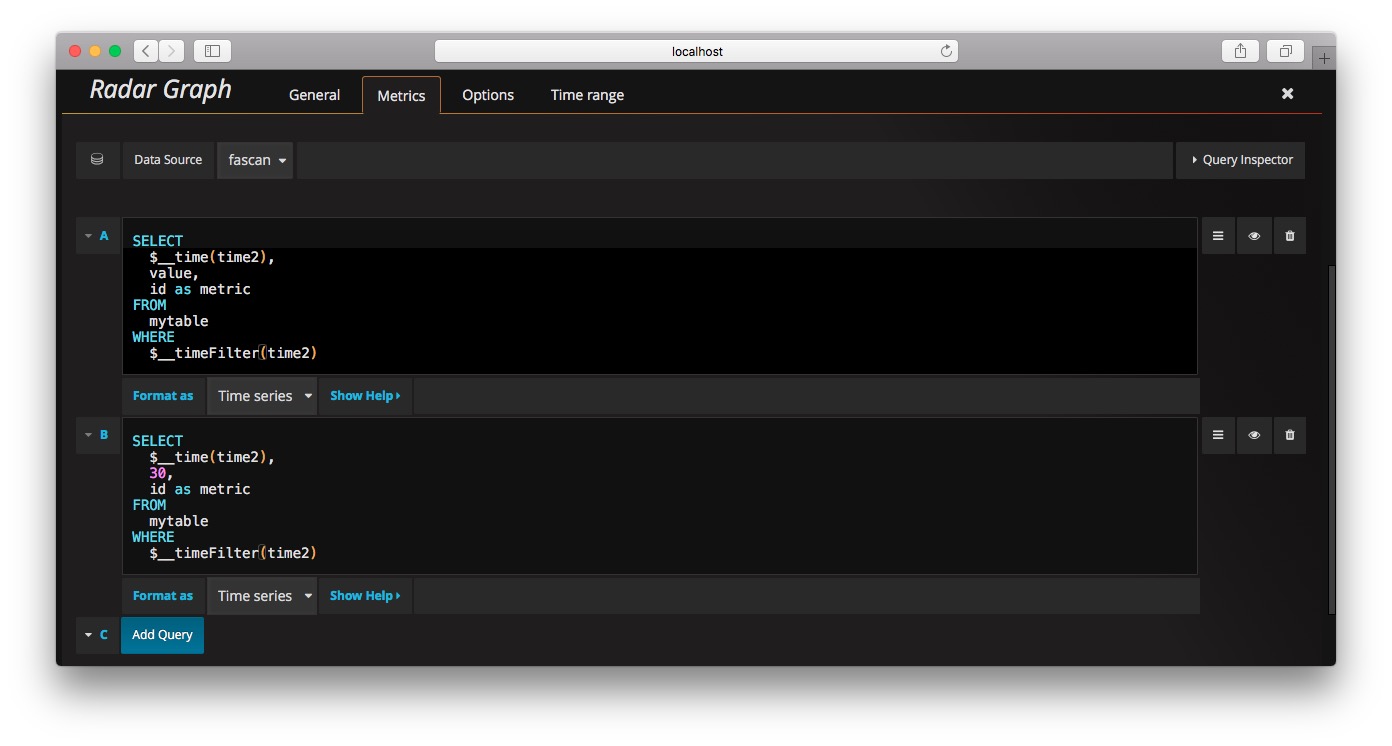
PostGreSQL configuration
Note the graph displays the last value of each time serie.
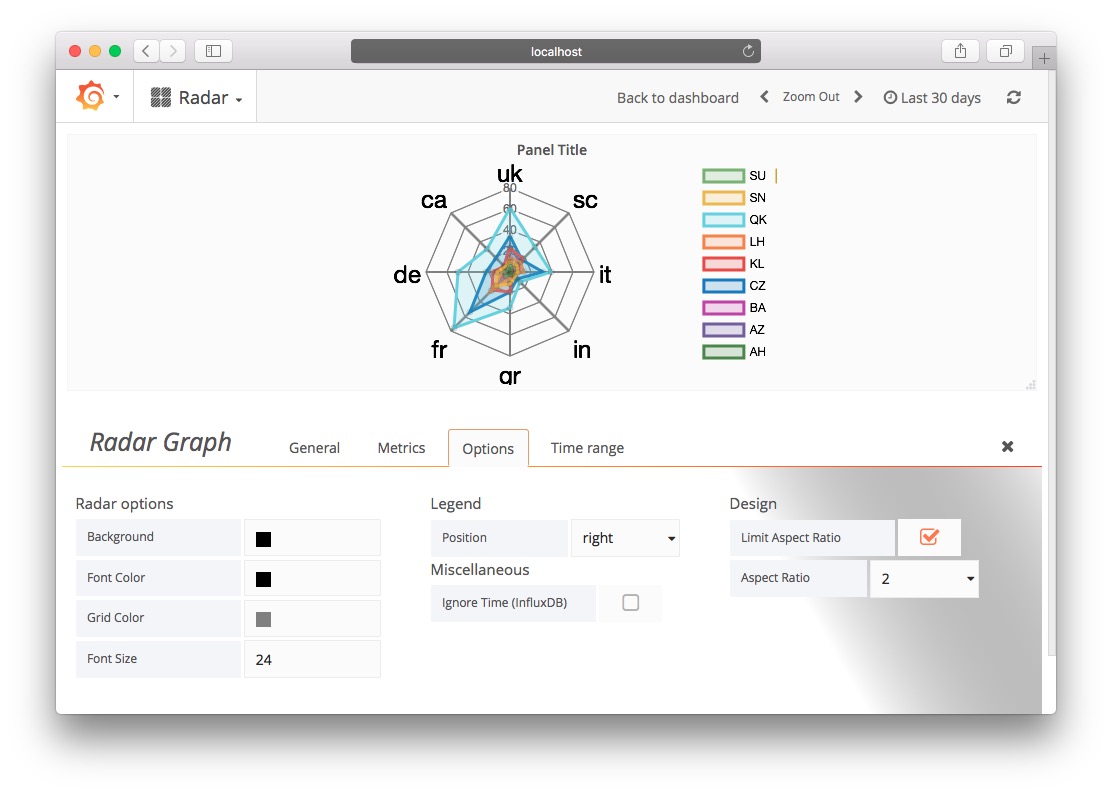
Panel Options
Versions
v1.1.0 (19/Oct/2017)
- First Version Compatible with InfluxDB
v1.2.0 (27/Oct/2017)
- Panel renamed to snuids-radar-panel. (Edit your panels plugin id when upgrading from 1.1.0)
v1.3.0 (01/Nov/2017)
- Aspect ratio option added in order to limit the height of the graph
v1.4.0 (10/Dec/2017)
- PostGreSQL support added
v1.4.1 (12/Dec/2017)
- Fixed a bug that prevents the graph to be corrrectly displayed when the serie has only one point. (Thx shizacat)
v1.4.2 (30/Sep/2018)
- Alias option added in order to rename the serie for SQL datasources
v1.4.3 (06/Mar/2019)
- Merged fremag modifications: New chart options: min, max, step, animation
v1.4.4 (20/Apr/2019)
- Autoscale option added
- Tick background can be hidden
v1.5.0 (17/Jan/2022)
- Plugin signed
v1.5.1 (18/Jan/2022)
- this.renderingCompleted() added at the end of OnRender (Issue of GZRad)
Grafana Cloud Free
- Free tier: Limited to 3 users
- Paid plans: $55 / user / month above included usage
- Access to all Enterprise Plugins
- Fully managed service (not available to self-manage)
Self-hosted Grafana Enterprise
- Access to all Enterprise plugins
- All Grafana Enterprise features
- Self-manage on your own infrastructure
Installing Radar Graph on Grafana Cloud:
Installing plugins on a Grafana Cloud instance is a one-click install; same with updates. Cool, right?
Note that it could take up to 1 minute to see the plugin show up in your Grafana.
Installing plugins on a Grafana Cloud instance is a one-click install; same with updates. Cool, right?
Note that it could take up to 1 minute to see the plugin show up in your Grafana.
Installing plugins on a Grafana Cloud instance is a one-click install; same with updates. Cool, right?
Note that it could take up to 1 minute to see the plugin show up in your Grafana.
Installing plugins on a Grafana Cloud instance is a one-click install; same with updates. Cool, right?
Note that it could take up to 1 minute to see the plugin show up in your Grafana.
Installing plugins on a Grafana Cloud instance is a one-click install; same with updates. Cool, right?
Note that it could take up to 1 minute to see the plugin show up in your Grafana.
Installing plugins on a Grafana Cloud instance is a one-click install; same with updates. Cool, right?
Note that it could take up to 1 minute to see the plugin show up in your Grafana.
Installing plugins on a Grafana Cloud instance is a one-click install; same with updates. Cool, right?
Note that it could take up to 1 minute to see the plugin show up in your Grafana.
For more information, visit the docs on plugin installation.
Installing on a local Grafana:
For local instances, plugins are installed and updated via a simple CLI command. Plugins are not updated automatically, however you will be notified when updates are available right within your Grafana.
1. Install the Panel
Use the grafana-cli tool to install Radar Graph from the commandline:
grafana-cli plugins install The plugin will be installed into your grafana plugins directory; the default is /var/lib/grafana/plugins. More information on the cli tool.
Alternatively, you can manually download the .zip file for your architecture below and unpack it into your grafana plugins directory.
Alternatively, you can manually download the .zip file and unpack it into your grafana plugins directory.
2. Add the Panel to a Dashboard
Installed panels are available immediately in the Dashboards section in your Grafana main menu, and can be added like any other core panel in Grafana.
To see a list of installed panels, click the Plugins item in the main menu. Both core panels and installed panels will appear.
Changelog
v1.1.0 (19/Oct/2017)
- First Version Compatible with InfluxDB
v1.2.0 (27/Oct/2017)
- Panel renamed to snuids-radar-panel. (Edit your panels plugin id when upgrading from 1.1.0)
v1.3.0 (01/Nov/2017)
- Aspect ratio option added in order to limit the height of the graph
v1.4.0 (10/Dec/2017)
- PostGreSQL support added
v1.4.1 (12/Dec/2017)
- Fixed a bug that prevents the graph to be corrrectly displayed when the serie has only one point. (Thx shizacat)
v1.4.2 (30/Sep/2018)
- Alias option added in order to rename the serie for SQL datasources
v1.4.3 (06/Mar/2019)
- Merged fremag modifications: New chart options: min, max, step, animation
v1.4.4 (20/Apr/2019)
- Autoscale option added
- Tick background can be hidden


