Plugins 〉AJAX
The AJAX plugin has been deprecated and is no longer maintained.
AJAX
AJAX Panel for Grafana
The AJAX Panel is a general way to load external content into a grafana dashboard.
Options
Method:
GET or POST or iframe
URL:
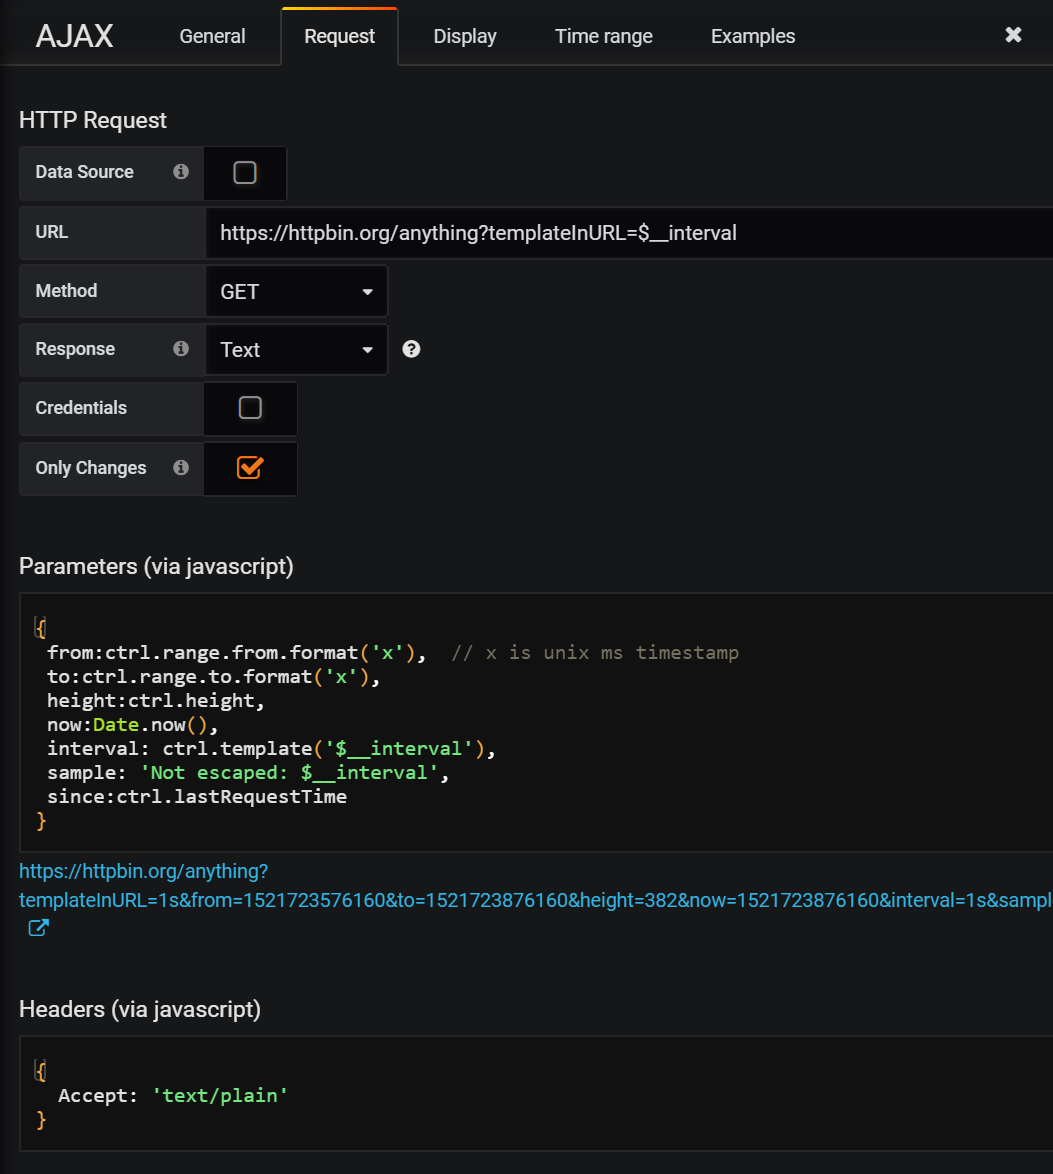
The URL to request
Parameters:
The parameters that will be passed in the request. This is a javascript object with access to the variables: -
ctrlThe control object.
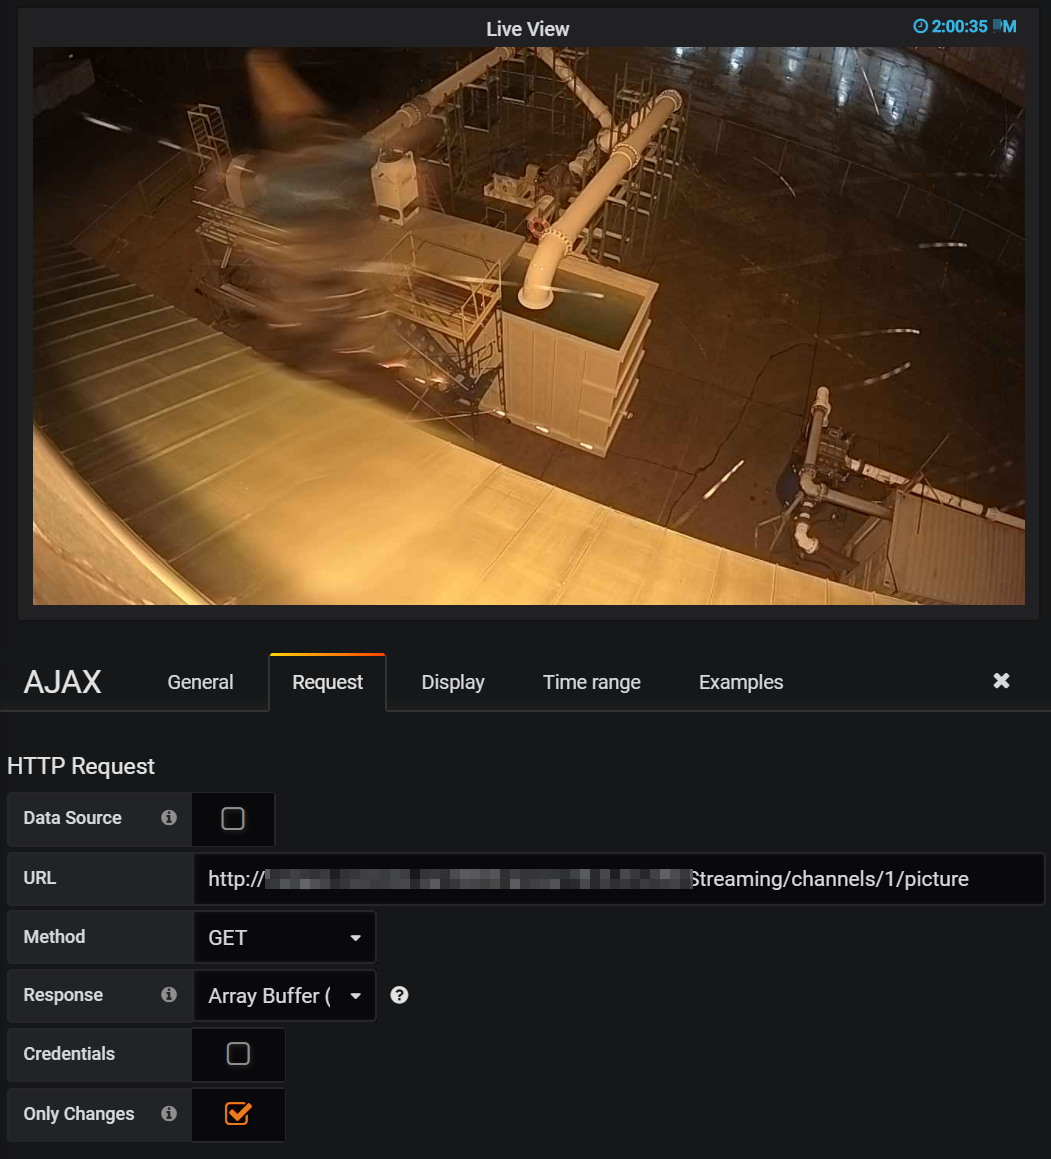
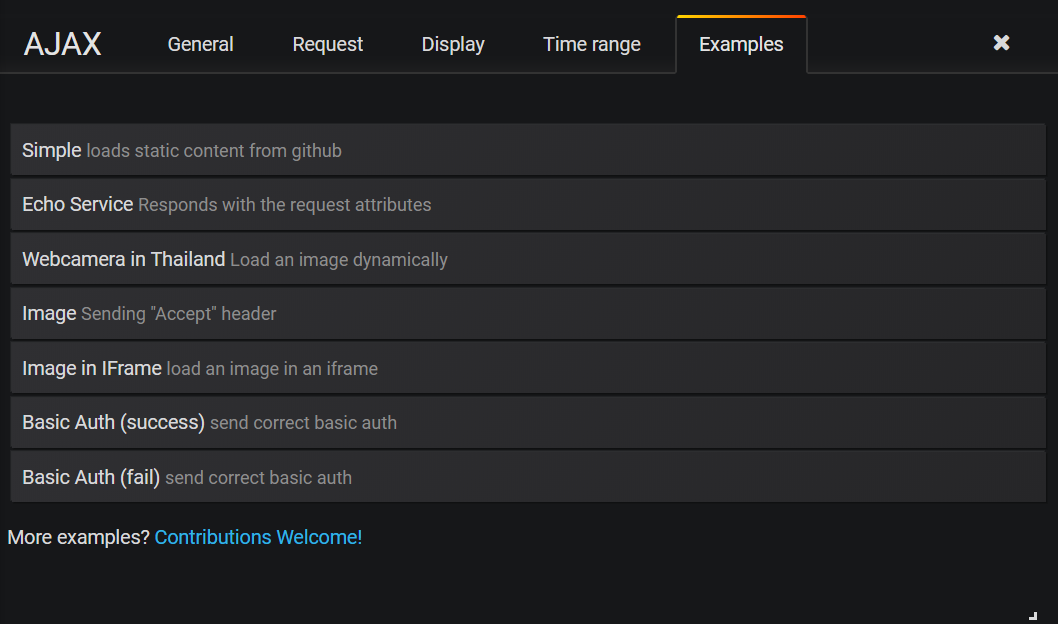
Screenshots


Grafana Cloud Free
- Free tier: Limited to 3 users
- Paid plans: $55 / user / month above included usage
- Access to all Enterprise Plugins
- Fully managed service (not available to self-manage)
Self-hosted Grafana Enterprise
- Access to all Enterprise plugins
- All Grafana Enterprise features
- Self-manage on your own infrastructure
Installing AJAX on Grafana Cloud:
Installing plugins on a Grafana Cloud instance is a one-click install; same with updates. Cool, right?
Note that it could take up to 1 minute to see the plugin show up in your Grafana.
Installing plugins on a Grafana Cloud instance is a one-click install; same with updates. Cool, right?
Note that it could take up to 1 minute to see the plugin show up in your Grafana.
Installing plugins on a Grafana Cloud instance is a one-click install; same with updates. Cool, right?
Note that it could take up to 1 minute to see the plugin show up in your Grafana.
Installing plugins on a Grafana Cloud instance is a one-click install; same with updates. Cool, right?
Note that it could take up to 1 minute to see the plugin show up in your Grafana.
Installing plugins on a Grafana Cloud instance is a one-click install; same with updates. Cool, right?
Note that it could take up to 1 minute to see the plugin show up in your Grafana.
Installing plugins on a Grafana Cloud instance is a one-click install; same with updates. Cool, right?
Note that it could take up to 1 minute to see the plugin show up in your Grafana.
Installing plugins on a Grafana Cloud instance is a one-click install; same with updates. Cool, right?
Note that it could take up to 1 minute to see the plugin show up in your Grafana.
For more information, visit the docs on plugin installation.
Installing on a local Grafana:
For local instances, plugins are installed and updated via a simple CLI command. Plugins are not updated automatically, however you will be notified when updates are available right within your Grafana.
1. Install the Panel
Use the grafana-cli tool to install AJAX from the commandline:
grafana-cli plugins install The plugin will be installed into your grafana plugins directory; the default is /var/lib/grafana/plugins. More information on the cli tool.
Alternatively, you can manually download the .zip file for your architecture below and unpack it into your grafana plugins directory.
Alternatively, you can manually download the .zip file and unpack it into your grafana plugins directory.
2. Add the Panel to a Dashboard
Installed panels are available immediately in the Dashboards section in your Grafana main menu, and can be added like any other core panel in Grafana.
To see a list of installed panels, click the Plugins item in the main menu. Both core panels and installed panels will appear.
Change Log
All notable changes to this project will be documented in this file.
v0.1.0
- Comipled and with grafana 7+,
- image support requires 7.4+
v0.0.7
- building with @grafana/toolkit
- Tested with Grafana 6.3
- fix height issue with iframes
v0.0.6
- Support requests to /api (grafana internal API)
- Adding circleci build
- removing dist from master build (only add it on release branches)
- Support empty text response (#9)
- webpack build
- Show query results
- tested with grafana 6
v0.0.5
- Support angular templates using AJAX response
- Options to display as: HTML, Text, JSON, or preformatted text
- Fixed display issue with 5.1
- Support direct link rendered image
- Show possible variables in editor
v0.0.4
- Support template variables in parameters (@linar-jether)
- Improved error handling
- Move ajax requests to 'issueQueries' block rather than refresh
- Show loading spinner
- Convert to TypeScript
- Use datasources for complex authentication
- Support loading images
- Support header configuration
- Support showing time info
- Include various sample configurations
v0.0.3
- Support template variables in url (@linar-jether)
- Adding iframe method (@linar-jether)
v0.0.2
- Quick and Dirty, but it works!


