Plugins 〉Redis Application
Redis Application
Redis Application plugin for Grafana

Introduction
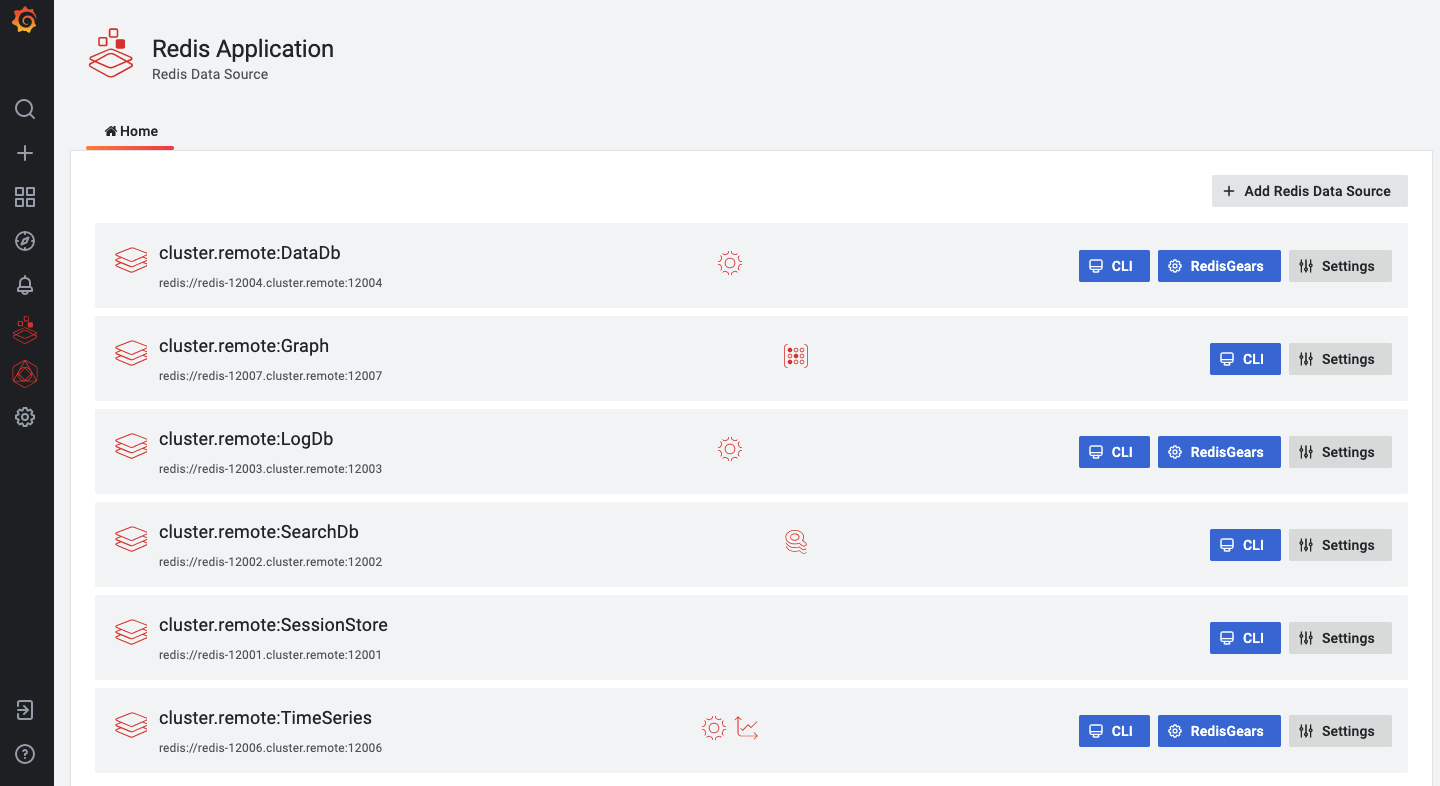
The Redis Application is a plugin for Grafana that provides application pages, custom panels, and dashboards for Redis Data Source.
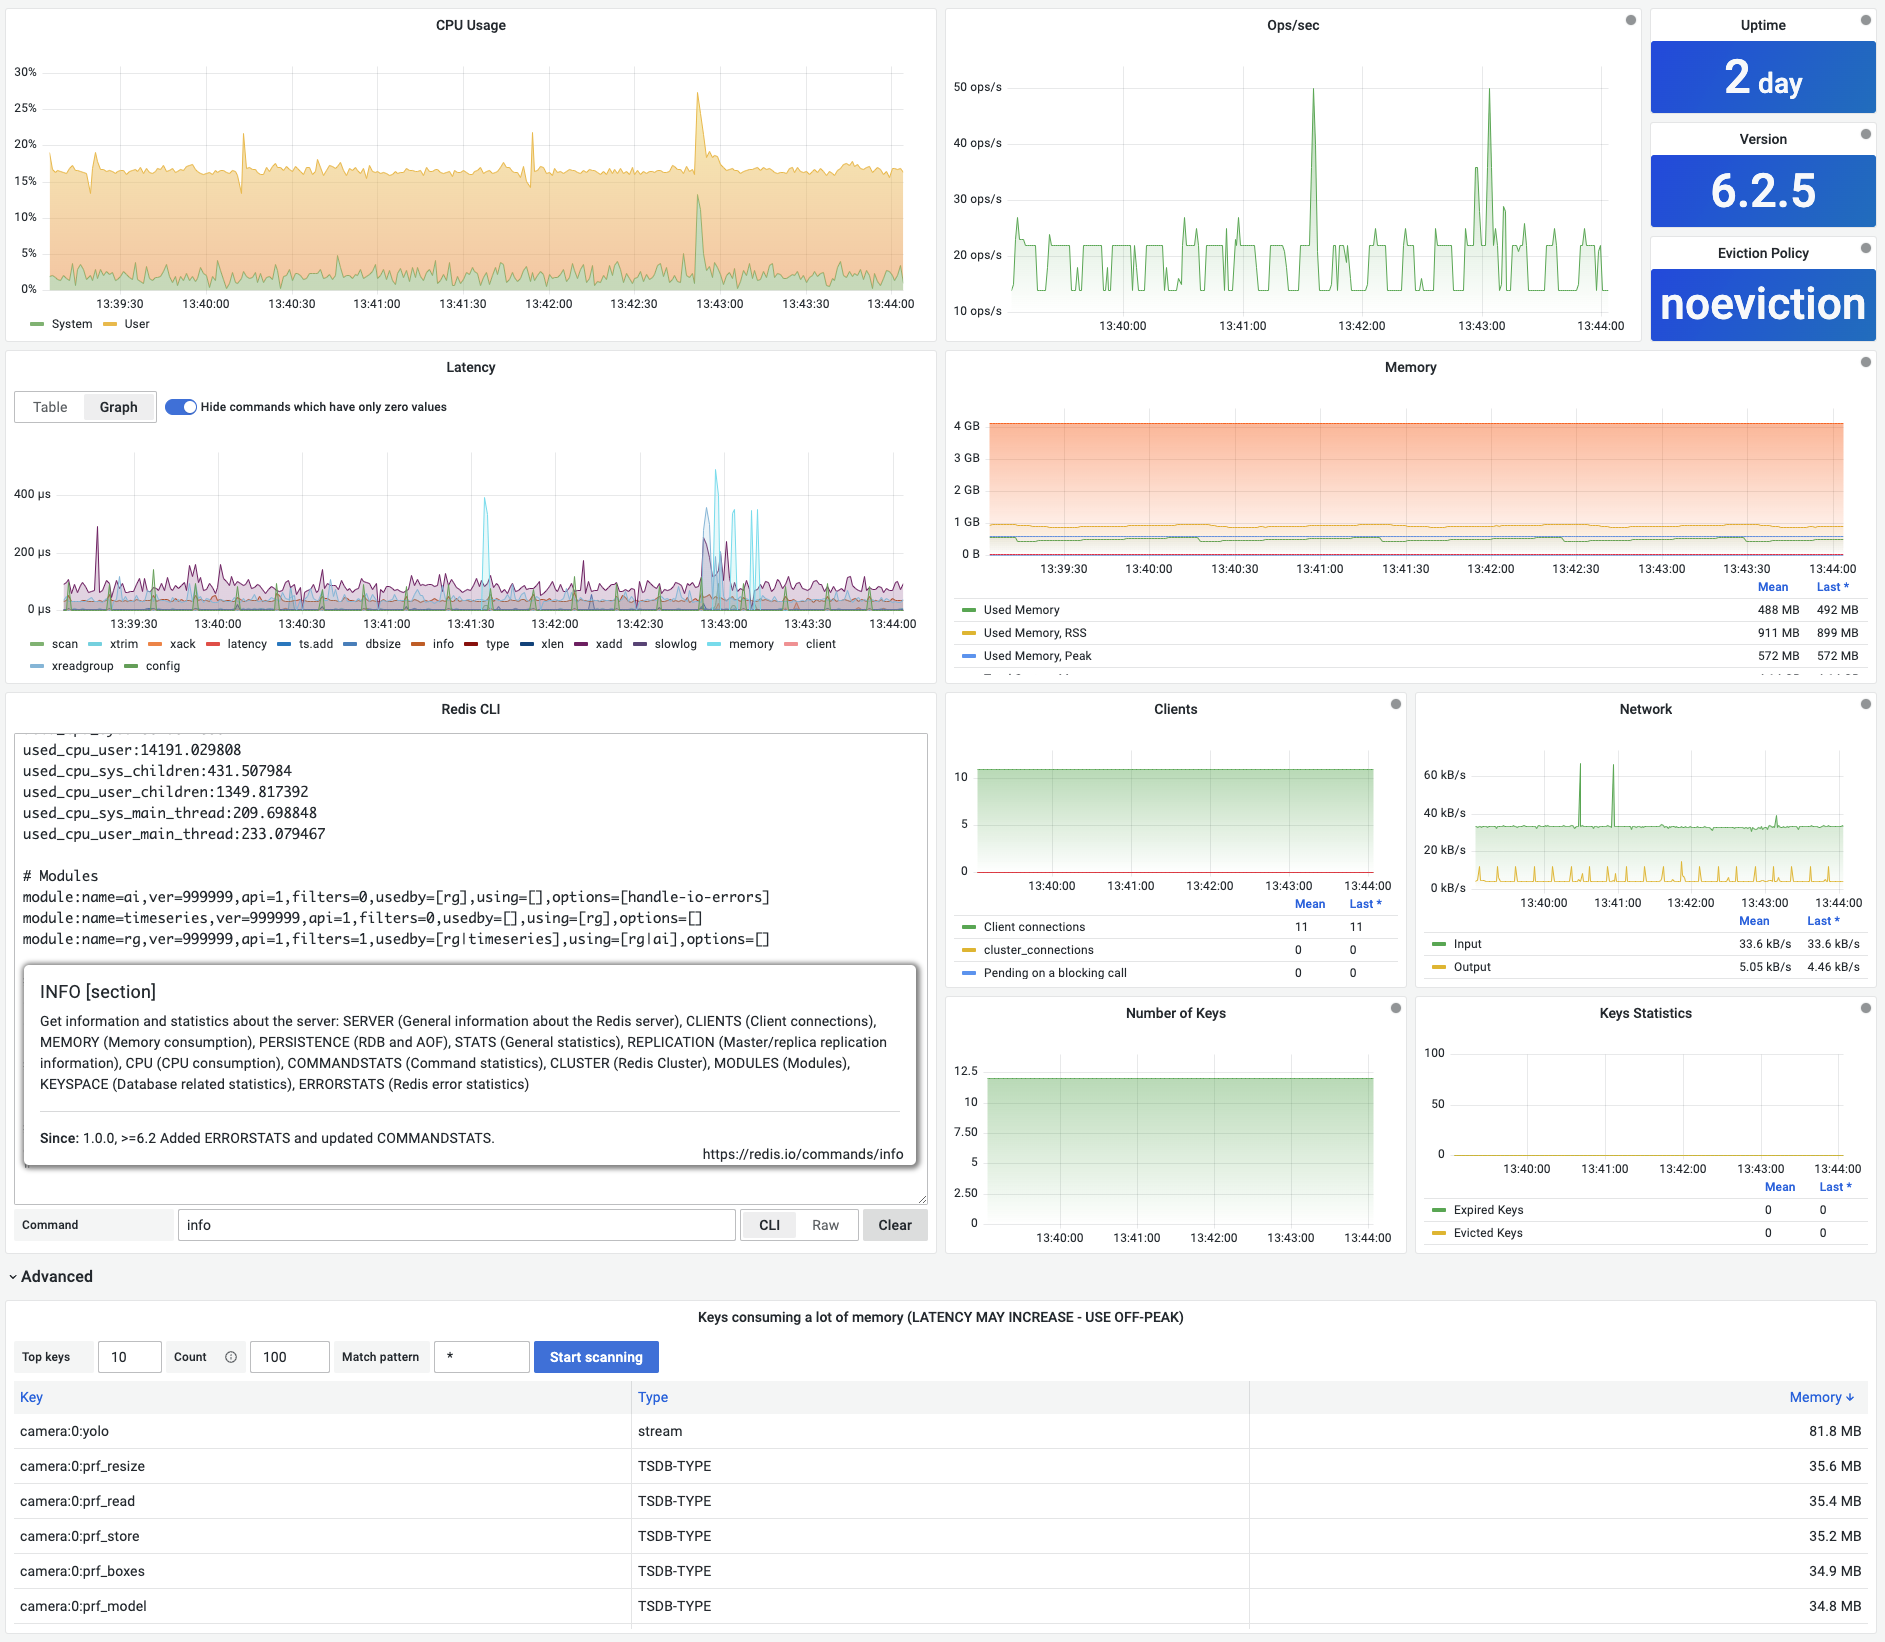
Custom Panels
- Command-line interface (CLI)
- Command Latency (graph and table)
- Keys consuming a lot of memory
- RedisGears Script Editor
- CPU Usage
Dashboards
All dashboards are available from the application's icon in the left side menu.

Demo
Demo is available on demo.volkovlabs.io:
Requirements
- Grafana 8.0+ is required for Redis Application 2.X.
- Grafana 7.1+ is required for Redis Application 1.X.
Getting Started
Redis Application plugin can be installed from the Grafana Marketplace or use the grafana-cli tool to install from the command line:
grafana-cli plugins install redis-app

For Docker instructions and installation without Internet access, follow the Quickstart page.
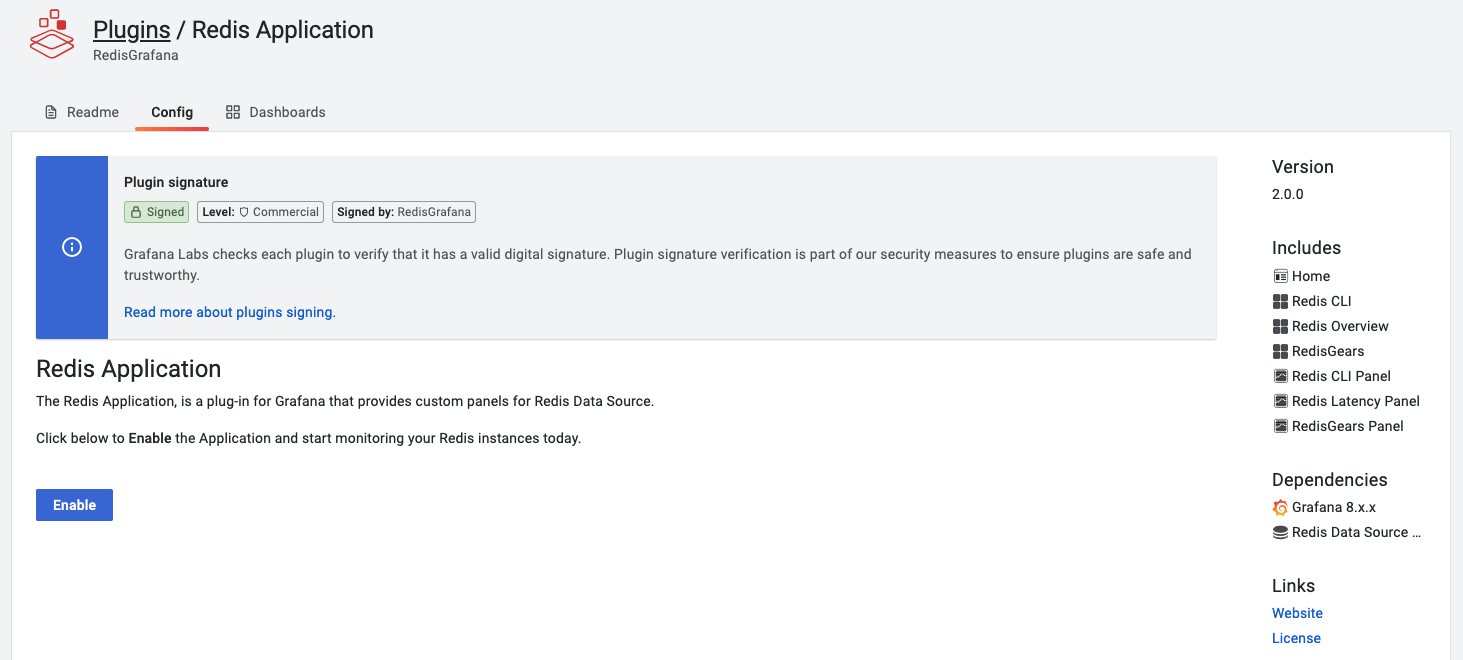
Open Grafana and enable Redis Application plugin
Open Grafana in your browser, enable Redis Application plugin, and configure Redis Data Sources.

Documentation
Take a look at the Documentation to learn more about the Redis Application plugin, Redis Data Source, provided dashboards, and custom panels.
Development
Developing Redis Application plugin page provides instructions on building the application.
Are you interested in the latest features and updates? Start nightly built Docker image for Redis Application plugin.
Feedback
We love to hear from users, developers, and the whole community interested in this plugin. These are various ways to get in touch with us:
- Ask a question, request a new feature, and file a bug with GitHub issues.
- Star the repository to show your support.
Contributing
- Fork the repository.
- Find an issue to work on and submit a pull request.
- Could not find an issue? Look for documentation, bugs, typos, and missing features.
License
- Apache License Version 2.0, see LICENSE.
Grafana Cloud Free
- Free tier: Limited to 3 users
- Paid plans: $55 / user / month above included usage
- Access to all Enterprise Plugins
- Fully managed service (not available to self-manage)
Self-hosted Grafana Enterprise
- Access to all Enterprise plugins
- All Grafana Enterprise features
- Self-manage on your own infrastructure
Installing Redis Application on Grafana Cloud:
Installing plugins on a Grafana Cloud instance is a one-click install; same with updates. Cool, right?
Note that it could take up to 1 minute to see the plugin show up in your Grafana.
Installing plugins on a Grafana Cloud instance is a one-click install; same with updates. Cool, right?
Note that it could take up to 1 minute to see the plugin show up in your Grafana.
Installing plugins on a Grafana Cloud instance is a one-click install; same with updates. Cool, right?
Note that it could take up to 1 minute to see the plugin show up in your Grafana.
Installing plugins on a Grafana Cloud instance is a one-click install; same with updates. Cool, right?
Note that it could take up to 1 minute to see the plugin show up in your Grafana.
Installing plugins on a Grafana Cloud instance is a one-click install; same with updates. Cool, right?
Note that it could take up to 1 minute to see the plugin show up in your Grafana.
Installing plugins on a Grafana Cloud instance is a one-click install; same with updates. Cool, right?
Note that it could take up to 1 minute to see the plugin show up in your Grafana.
Installing plugins on a Grafana Cloud instance is a one-click install; same with updates. Cool, right?
Note that it could take up to 1 minute to see the plugin show up in your Grafana.
For more information, visit the docs on plugin installation.
Installing on a local Grafana:
For local instances, plugins are installed and updated via a simple CLI command. Plugins are not updated automatically, however you will be notified when updates are available right within your Grafana.
1. Install the Application
Use the grafana-cli tool to install Redis Application from the commandline:
grafana-cli plugins install The plugin will be installed into your grafana plugins directory; the default is /var/lib/grafana/plugins. More information on the cli tool.
Alternatively, you can manually download the .zip file for your architecture below and unpack it into your grafana plugins directory.
Alternatively, you can manually download the .zip file and unpack it into your grafana plugins directory.
2. Enable it
Next, log into your Grafana instance. Navigate to the Plugins section, found in your Grafana main menu.
Click the Apps tabs in the Plugins section and select the newly installed app.
To enable the app, click the Config tab. Follow the instructions provided with the application and click Enable. The app and any new UI pages are now accessible from within the main menu, as designed by the app creator.
If dashboards have been included with the application, they will attempt to be automatically installed. To view the dashboards, re-import or delete individual dashboards, click the Dashboards tab within the app page.
Change Log
2.2.1 (2022-01-18)
Features / Enhancements
- Rebuild using 8.3.4 (#99)
2.2.0 (2022-01-17)
Features / Enhancements
- Upgrade to Grafana 8.2.5 (#88)
- Add CLUSTER Slots commands introduces in Redis 7 (#89)
- Fix Docker plugins provisioning (#90)
- Upgrade to Grafana 8.3.0 (#93)
- Fix LGTM and Update Panel Options (#95)
- Add Redis CPU Usage panel (#96)
- Update Components naming (#97)
- Add CPU Usage Stacking and Gradient (#98)
- Update "Can't retrieve a list of commands" error message (#100)
2.1.0 (2021-11-10)
Features / Enhancements
- Update to Grafana 8.0.6 (#78)
- Update to Grafana 8.1.1 (#79)
- Add CLI commands for Redis 7.0.0 (#80)
- Update to Grafana 8.1.4 (#81)
- Add new command for Redis 6.2, Redis 7.0 (#82)
- Add demo at https://demo.volkovlabs.io (#83)
- Update Redis 7.0 commands help (#85)
- Update to Grafana 8.2.3 (#86)
- CLI Panel respects disabled CLI option for Data Source (#87)
2.0.1 (2021-07-07)
Features / Enhancements
- Update Redis Data Source dependency to 1.5.0 (#77)
2.0.0 (2021-06-25)
Breaking changes
Supports Grafana 8.0+, for Grafana 7.X use version 1.2.0
Features / Enhancements
- Upgrade to Grafana 8.0.2 (#67)
- Update dashboards for v8 and minor updates (#69)
- Replace old Latency Graph with TimeSeries component (#70)
- Add Redis 7 commands to CLI (#71)
- Add NgAlert and Plugin catalog to docker image (#72)
- Update dashboards in the application's menu as pages (#73)
- Update CLI legacy switch to ButtonGroup (#74)
Bug fixes
- "Available Requirements" panel should be set to $redis datasource #63
- Cannot read property 'v1' of undefined (theme.v1) in the Grafana 8 #65
- Add theme to getDisplayProcessor (#66)
- Fix adding new data source and minor updates (#68)
1.2.0 (2021-05-11)
Features / Enhancements
- Upgrade Grafana dependencies 7.5.4 #53
- Update Docker workflow #52
- Update Docker token and add Master build #54
- Add RefId to Query as mandatory for the upcoming release #55
- Update RedisGears Script Editor Execution modes #57
- Update Dashboards to version 7.5.5 #58
Bug fixes
- Add default Color Mode Id for older releases (7.2.X) #49
- Fix Latency below zero calculation #56
- "Cannot read property 'Tooltip' of undefined" for Latency Panel in the upcoming release #60
1.1.0 (2021-02-07)
Features / Enhancements
- Make Application plugin's icon bolder for better visibility #19
- Update Grafana dependencies to 7.3.6 #21
- Update Angular legacy code to React #25
- Update Redis CLI auto-scrolling textarea to autosize #26
- Add Tests coverage #28
- Create Latency Panel to display Latency Chart for each command #29
- Improve CLI panel error handling and add new CLI/Raw mode switch #33
- Improve Latency Panel to display Graph and set Data Source query #32
- Create the panel to show the biggest keys #34
- Create RedisGears panel #36
- Improve data source list #38
- Add Monaco for RedisGears panel editor #39
- Update CLI Panel helpers for Redis 6.2 and modules #40
- Add Docker build #42
- Update Plugin and panels configuration for Redis Data Source 1.3.1 #44
1.0.1 (2020-10-24)
Features / Enhancements
- Add GitHub action to sign release #13
- Signed release
1.0.0 (2020-10-14)
Features / Enhancements
- Initial release based on Grafana 7.2.0 and Redis Data Source 1.2.0.
- Allows seeing all Redis Data Sources with supported modules.
- Provides Redis CLI Panel with hints for Redis and various modules commands.
- Includes Redis Overview and Redis CLI dashboards.


