Plugins 〉Performance Co-Pilot
Performance Co-Pilot
Performance Co-Pilot Grafana Plugin
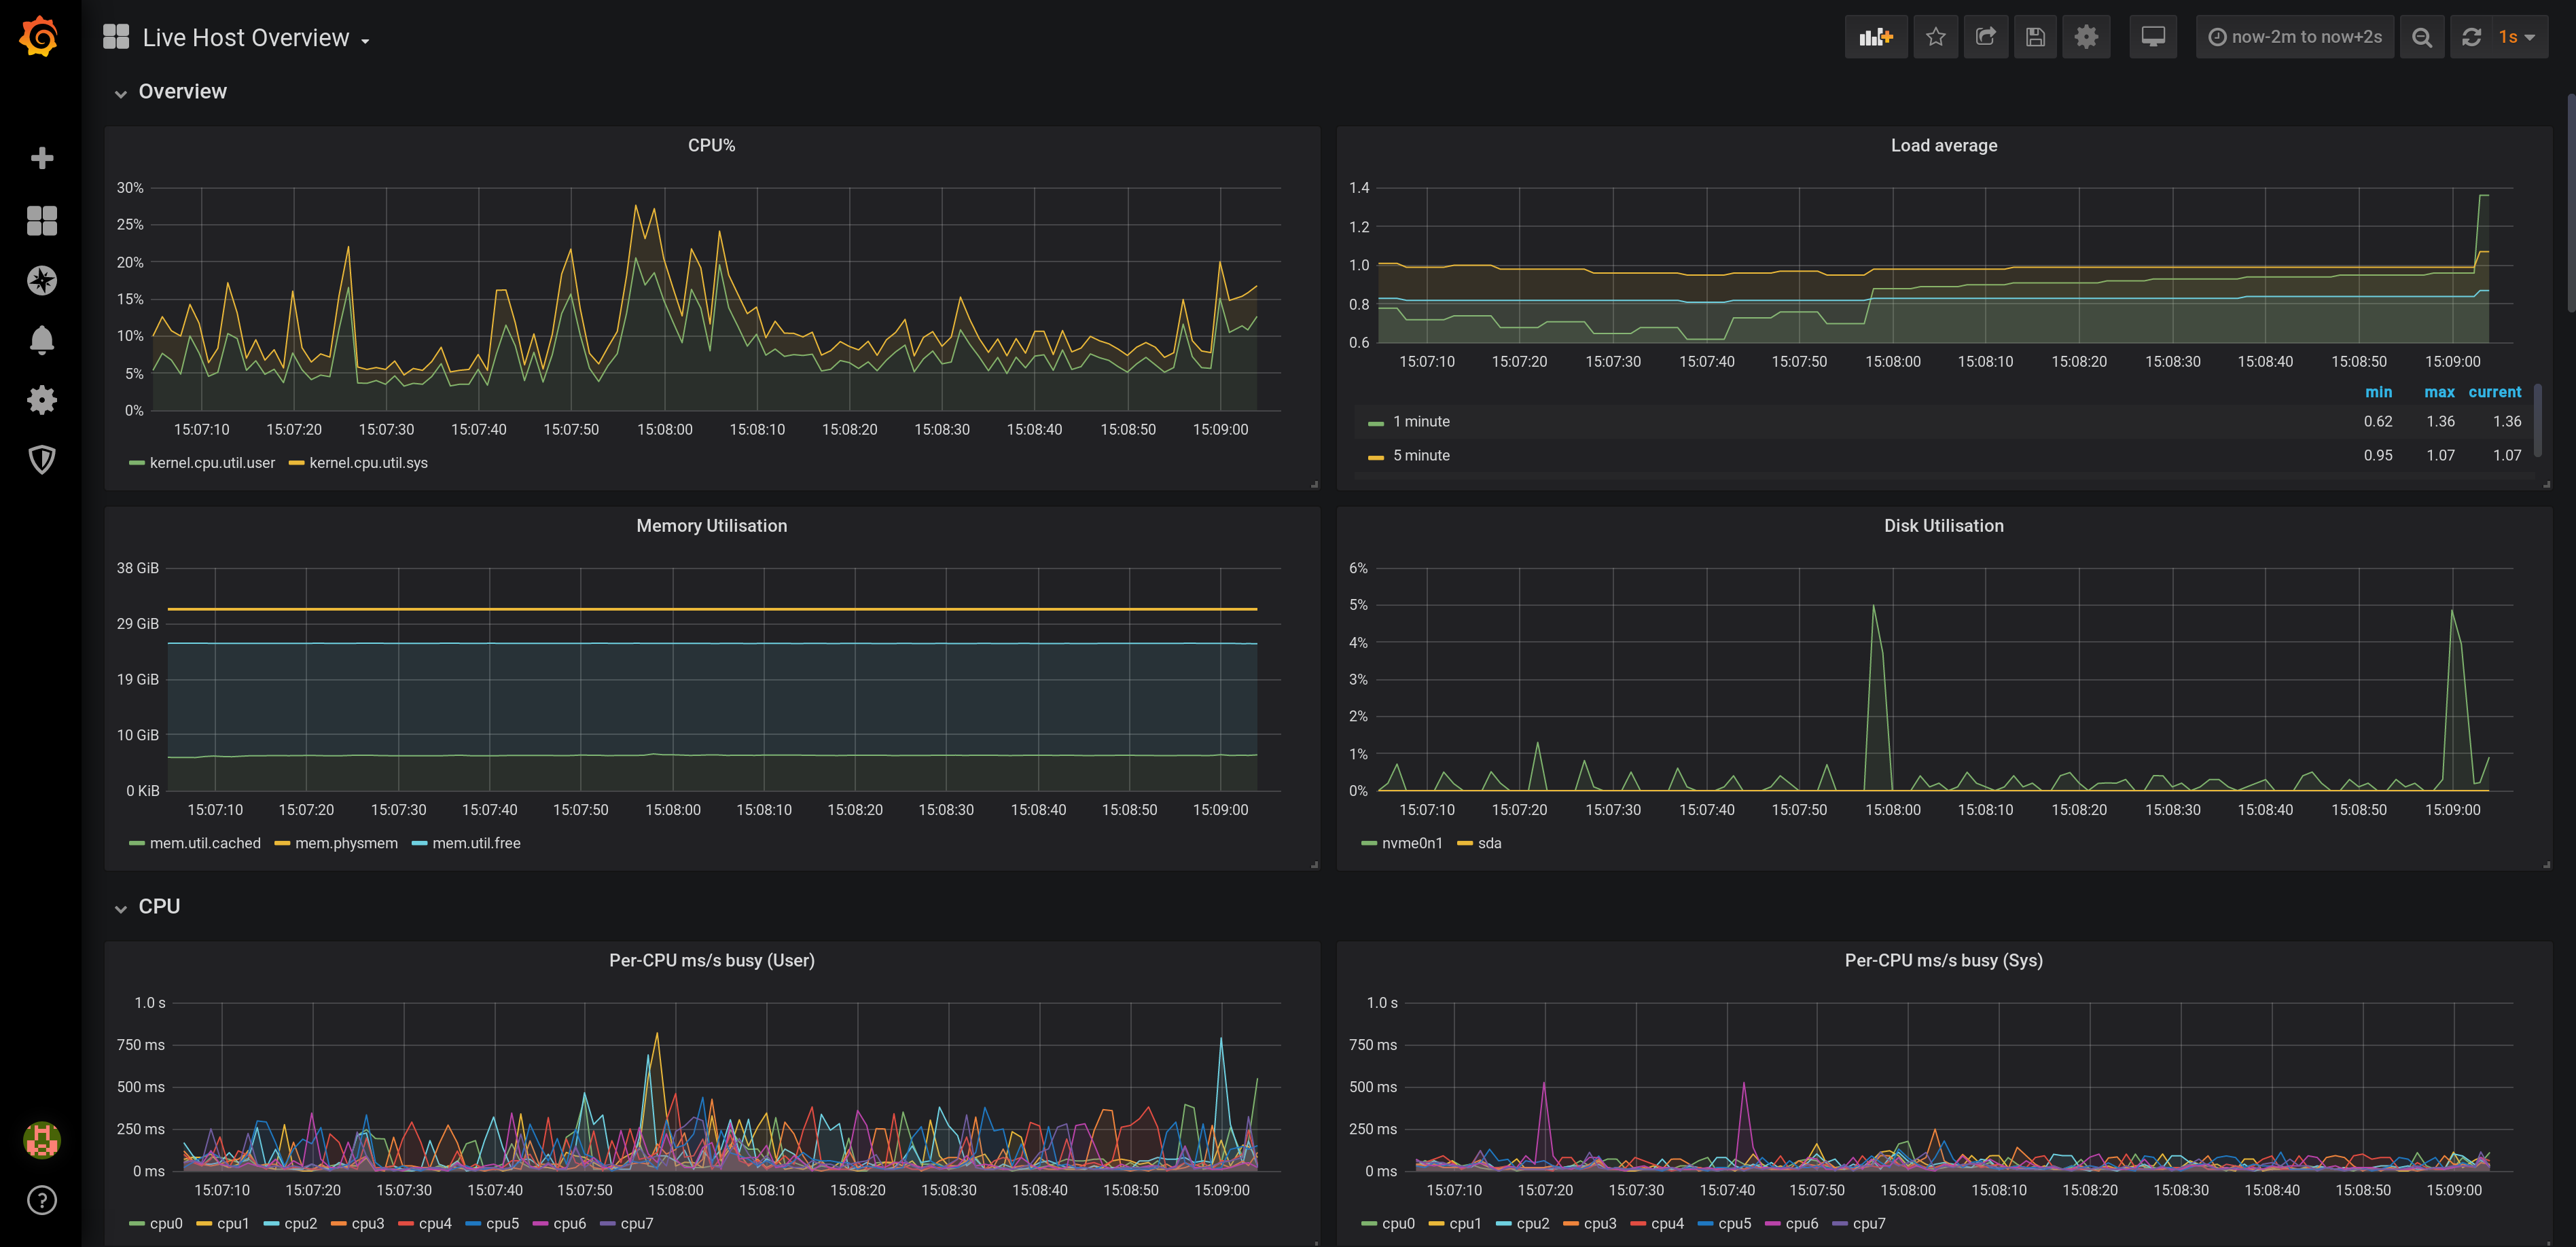
Performance Co-Pilot (PCP) provides a framework and services to support system-level performance monitoring and management. It presents a unifying abstraction for all of the performance data in a system, and many tools for interrogating, retrieving and processing that data.
Features
- analysis of historical PCP metrics using pmseries query language
- analysis of real-time PCP metrics using pmwebapi live services
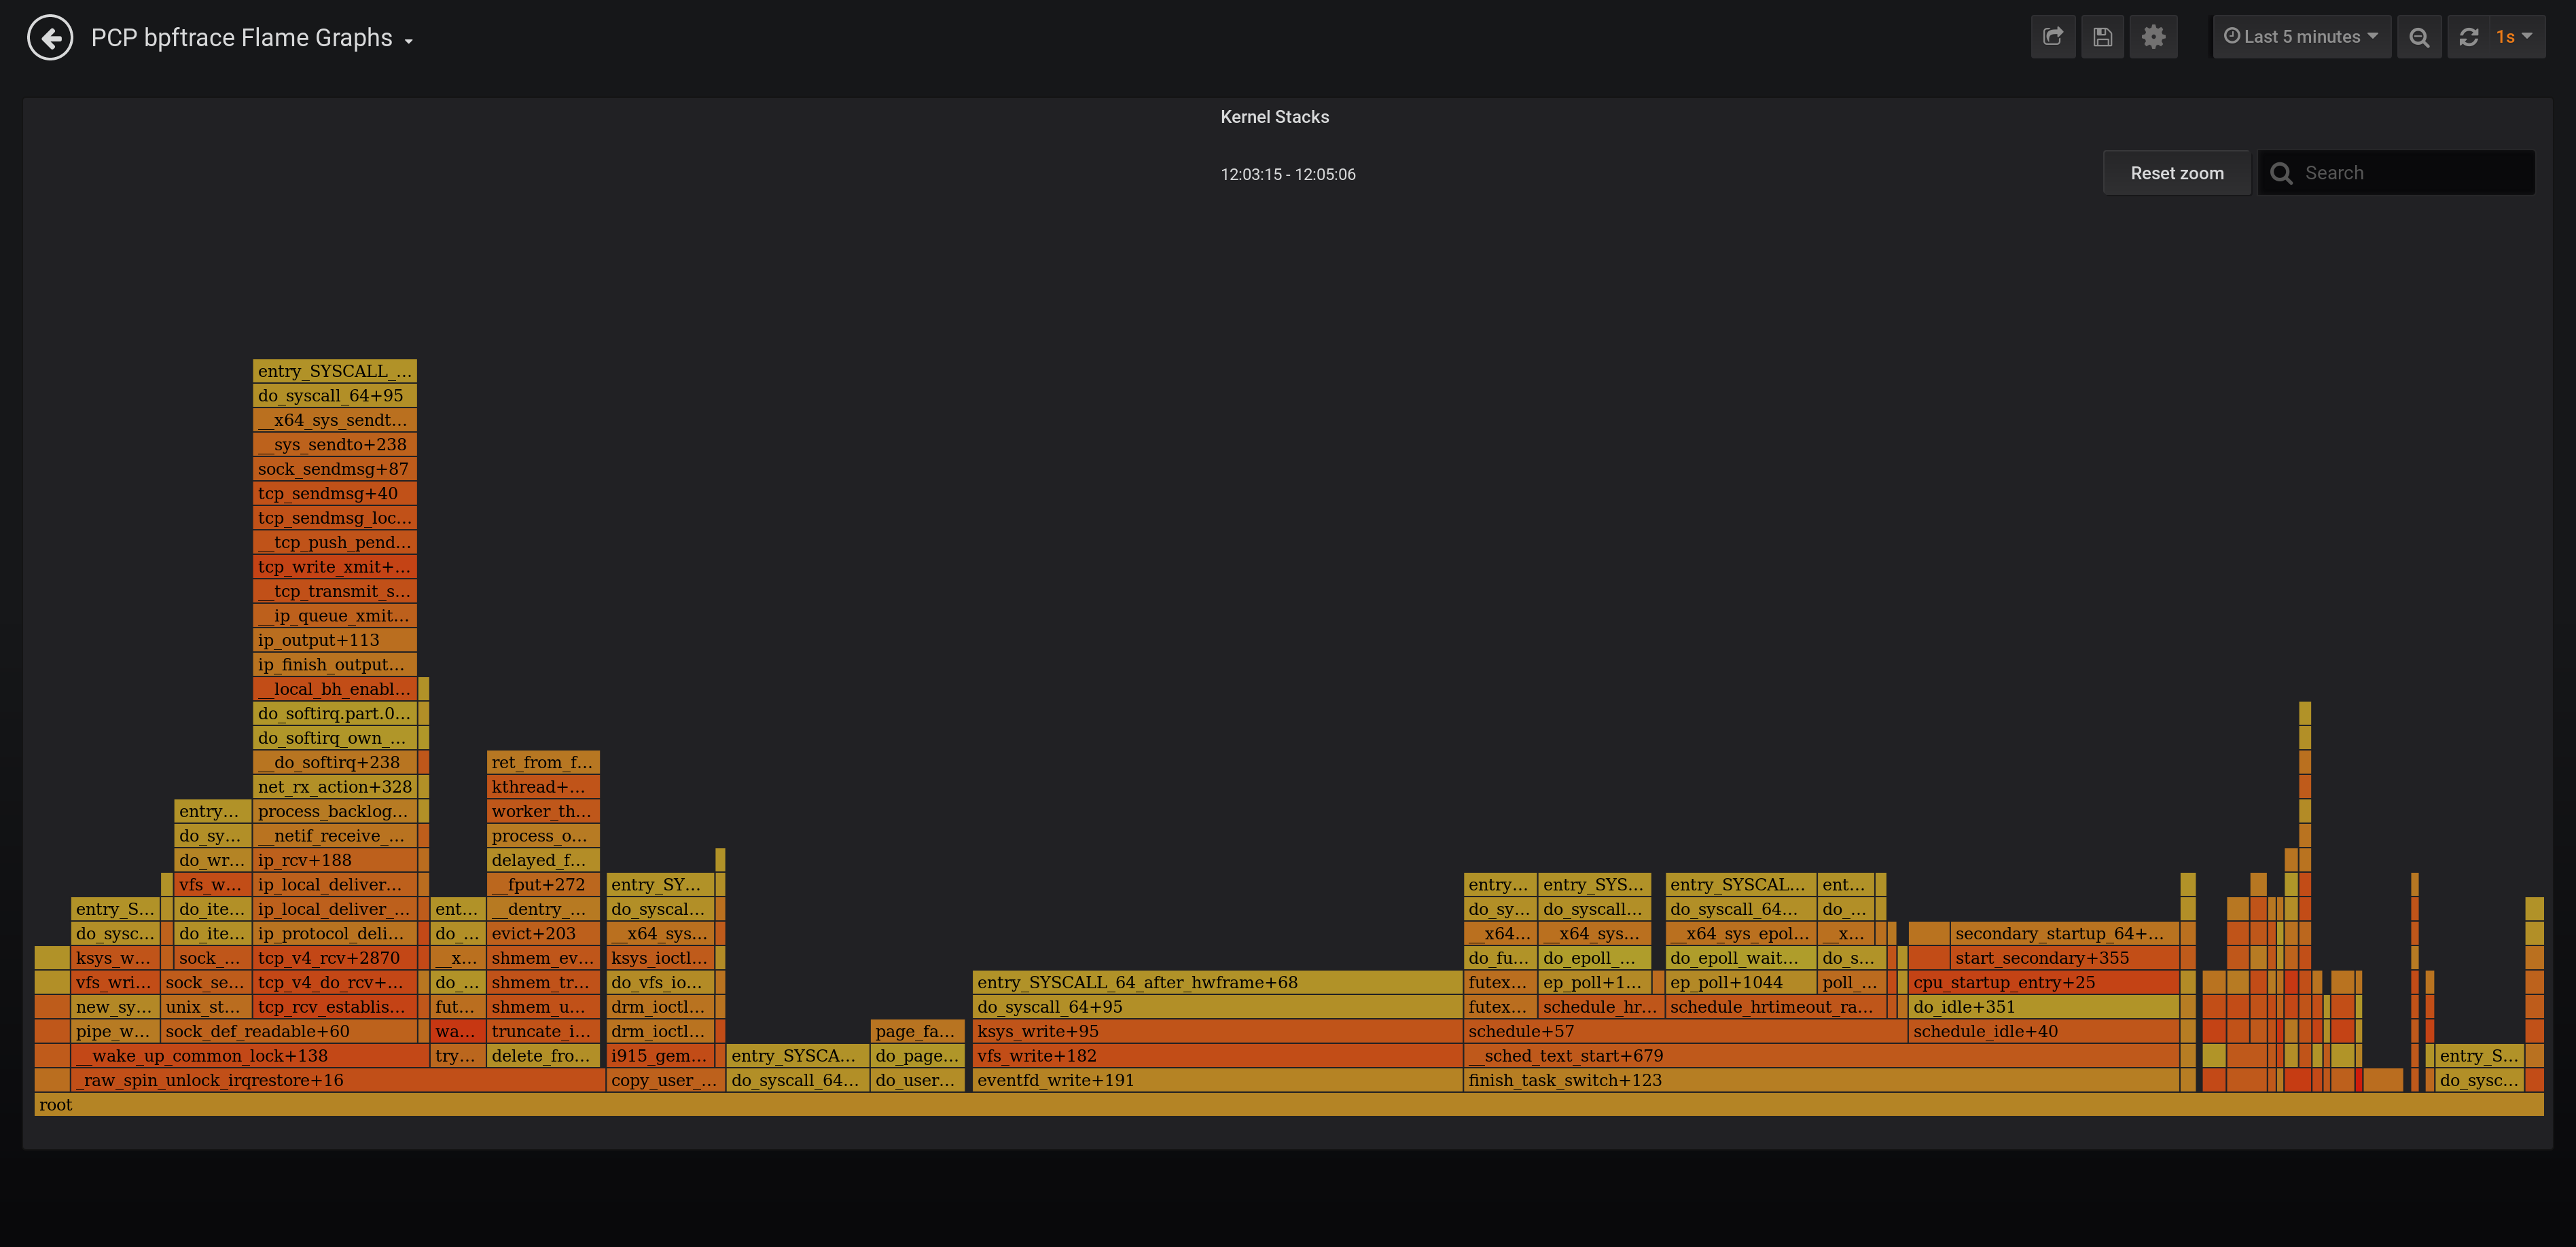
- enhanced Berkeley Packet Filter (eBPF) tracing using bpftrace scripts
- dashboards for detecting potential performance issues and showing possible solutions using the Utilization Saturation and Errors (USE) method [2]
- full-text search in metric names, descriptions, instances [1]
- support for Grafana Alerting [1]
- support for derived metrics (allows the usage of arithmetic operators and statistical functions inside a query) [2]
- automated configuration of metric units [1,2,3]
- automatic rate and time utilization conversion
- heatmap, table [2,3] and flame graph [3] support
- auto completion of metric names [1,2], qualifier keys and values [1], and bpftrace probes, builtin variables and functions [3]
- display of semantics, units and help texts of metrics [2] and bpftrace builtins [3]
- legend templating support with
$metric,$metric0,$instance,$some_label,$some_dashboard_variable - container support [1,2]
- support for custom endpoint and hostspec per panel [2,3]
- support for repeated panels
- sample dashboards for all data sources
[1] PCP Redis [2] PCP Vector [3] PCP bpftrace
Installation Instructions
Documentation
Grafana Cloud Free
- Free tier: Limited to 3 users
- Paid plans: $55 / user / month above included usage
- Access to all Enterprise Plugins
- Fully managed service (not available to self-manage)
Self-hosted Grafana Enterprise
- Access to all Enterprise plugins
- All Grafana Enterprise features
- Self-manage on your own infrastructure
Installing Performance Co-Pilot on Grafana Cloud:
Installing plugins on a Grafana Cloud instance is a one-click install; same with updates. Cool, right?
Note that it could take up to 1 minute to see the plugin show up in your Grafana.
Installing plugins on a Grafana Cloud instance is a one-click install; same with updates. Cool, right?
Note that it could take up to 1 minute to see the plugin show up in your Grafana.
Installing plugins on a Grafana Cloud instance is a one-click install; same with updates. Cool, right?
Note that it could take up to 1 minute to see the plugin show up in your Grafana.
Installing plugins on a Grafana Cloud instance is a one-click install; same with updates. Cool, right?
Note that it could take up to 1 minute to see the plugin show up in your Grafana.
Installing plugins on a Grafana Cloud instance is a one-click install; same with updates. Cool, right?
Note that it could take up to 1 minute to see the plugin show up in your Grafana.
Installing plugins on a Grafana Cloud instance is a one-click install; same with updates. Cool, right?
Note that it could take up to 1 minute to see the plugin show up in your Grafana.
Installing plugins on a Grafana Cloud instance is a one-click install; same with updates. Cool, right?
Note that it could take up to 1 minute to see the plugin show up in your Grafana.
For more information, visit the docs on plugin installation.
Installing on a local Grafana:
For local instances, plugins are installed and updated via a simple CLI command. Plugins are not updated automatically, however you will be notified when updates are available right within your Grafana.
1. Install the Application
Use the grafana-cli tool to install Performance Co-Pilot from the commandline:
grafana-cli plugins install The plugin will be installed into your grafana plugins directory; the default is /var/lib/grafana/plugins. More information on the cli tool.
Alternatively, you can manually download the .zip file for your architecture below and unpack it into your grafana plugins directory.
Alternatively, you can manually download the .zip file and unpack it into your grafana plugins directory.
2. Enable it
Next, log into your Grafana instance. Navigate to the Plugins section, found in your Grafana main menu.
Click the Apps tabs in the Plugins section and select the newly installed app.
To enable the app, click the Config tab. Follow the instructions provided with the application and click Enable. The app and any new UI pages are now accessible from within the main menu, as designed by the app creator.
If dashboards have been included with the application, they will attempt to be automatically installed. To view the dashboards, re-import or delete individual dashboards, click the Dashboards tab within the app page.
Change Log
5.0.0 (2022-06-30)
Important: Upgrade instructions
Due to a breaking change (see section below), the following instructions are required before upgrading to grafana-pcp v5:
- Go to Configuration -> Data sources and delete any PCP Redis, PCP Vector or PCP bpftrace data sources
- Go to Configuration -> Plugins, select the Performance Co-Pilot app and click the Disable button
- Go to Dashboards -> Browse and delete any remaining dashboards installed by grafana-pcp
- If you installed grafana-pcp through the RPM package, open the
/etc/grafana/grafana.iniconfiguration file and update the following setting:allow_loading_unsigned_plugins = performancecopilot-pcp-app,performancecopilot-redis-datasource,performancecopilot-vector-datasource,performancecopilot-bpftrace-datasource,performancecopilot-flamegraph-panel,performancecopilot-breadcrumbs-panel,performancecopilot-troubleshooting-panel - Perform the upgrade to grafana-pcp v5
- Enable the plugin, setup all data sources and import all dashboards again
- If you have custom dashboards, update all panels with the correct data source
Enhancements / Bug Fixes
- all: rename plugin IDs from
pcp-*-*toperformancecopilot-*-* - all: remove
window.setGrafanaPcpLogLevel()debug function - chore: remove deprecated
dependencies.grafanaVersionfield from plugin metadata - docs: update spelling of datasource to data source
Breaking Changes
- the internal plugin IDs of the data source and panel plugins were renamed from
pcp-X-Ytoperformancecopilot-X-Y, for examplepcp-redis-datasourcewas renamed toperformancecopilot-redis-datasourcein order to conform to the Grafana plugin id naming conventions
4.0.0 (2022-06-29)
Enhancements / Bug Fixes
- redis, vector: add buttons to disable rate conversation and time utilization conversation
- redis: use LRU cache for series metadata
- redis: fix label_names() function to return all label names if no parameter is specified (now the label name auto-completion in the query editor works again)
- redis: remove deprecated
label_values(metric, label)function - redis: fix network error for metrics with many series (requires PCP v6+)
- redis: update debug logging messages
- bpftrace: disable scrolling beyond last line in query editor
- checklist: fix dashboard link in navigation bar
- chore: upgrade Grafana dependencies to version 8.5.6
- chore: refactor custom Monaco languages
- chore: use new @grafana/ui form components in query editor
- build: verify javascript size in Makefile
- test: add datasource, metric auto-completion and import dashboard tests
- ci: switch e2e tests to cypress, use matrix configuration to run them with multiple Grafana versions
Removed features
- redis: The
label_values(metric, label)Grafana variable query function is now removed (was deprecated since grafana-pcp v3)
3.2.1 (2021-11-24)
- dashboards: add note about incompatibility of checklist dashboards with Grafana v8
- search: fix metric search form to make it compatible with Grafana v8
3.2.0 (2021-11-11)
- dashboards: new MS SQL server dashboard for PCP Redis
- dashboards: do not hide empty buckets in PCP Vector eBPF/BCC Overview dashboard
- dashboards: set revision for all dashboards
- redis: utilize query.options settings, same as PCP Vector
- redis: fix metric() function to return all metric names if no parameter is specified
- vector: perform rate conversion only if it's enabled in the query options (it is by default)
- build: add workaround to replace deprecated md4 hash algorithm with sha256 during build (md4 is unavailable in OpenSSL 3.0)
- build: update Node.js and Go dependencies, and grafonnet
- build: double-zip build artifacts in the CI workflow to preserve permissions (see actions/upload-artifact#38)
- build: add zip Makefile target, run grafana/plugincheck in CI workflow
- docs: add PCP Vector eBPF/BCC Overview dashboard screenshots
3.1.0 (2021-06-25)
- checklist: use new GraphNG component, show units in graphs, update help texts
- all: ensure Grafana 8.0 compatibility by replacing Angular.js based plugin config component with React
- dashboards: add pmproxy URL and hostspec variables to PCP Vector Host Overview and PCP checklist dashboards
- dashboards: show datasource field on all dashboards
- dashboards: mark all dashboards as readonly
- bpftrace: fix bpftrace error messages (don't append errors indefinitely)
- vector, bpftrace: use
pcp://127.0.0.1as default hostspec (no functional change) - chore: update dependencies
- test: replace convey with testify for the Go tests
3.0.3 (2021-02-24)
- test: fix e2e tests by using another CSS selector
- chore: update dependencies
- docs: add container guide and screenshot
3.0.2 (2021-01-22)
- checklist: replace the storage metrics
disk.dm.*withdisk.dev.*(enables usage without device mapper)
3.0.1 (2020-12-22)
Enhancements / Bug Fixes
- redis: add auto-completions for new pmseries(1) language functions
- redis, vector: show error messages returned by the REST API
- vector, bpftrace: fix error messages regarding missing metrics
- vector: register derived metrics for every context
- vector: handle missing metric metadata responses
- checklist: fix metric name in storage warning dialog
- test: fix PCP Redis datasource test on 32bit architectures
- build: update dependencies
3.0.0 (2020-11-23)
Highlights of v3.0
- redis: support for Grafana Alerting
- redis: full-text search in metric names, descriptions, instances
- vector: support derived metrics, which allows the usage of arithmetic operators and statistical functions inside a query (pmRegisterDerived(3))
- vector: configurable hostspec (access remote PMCDs through a central pmproxy)
- vector: automatically configure the unit of the panel
- dashboards: detect potential performance issues and show possible solutions with the checklist dashboards, using the USE method
- dashboards: new MS SQL server dashboard (Louis Imershein)
- dashboards: new eBPF/BCC dashboard
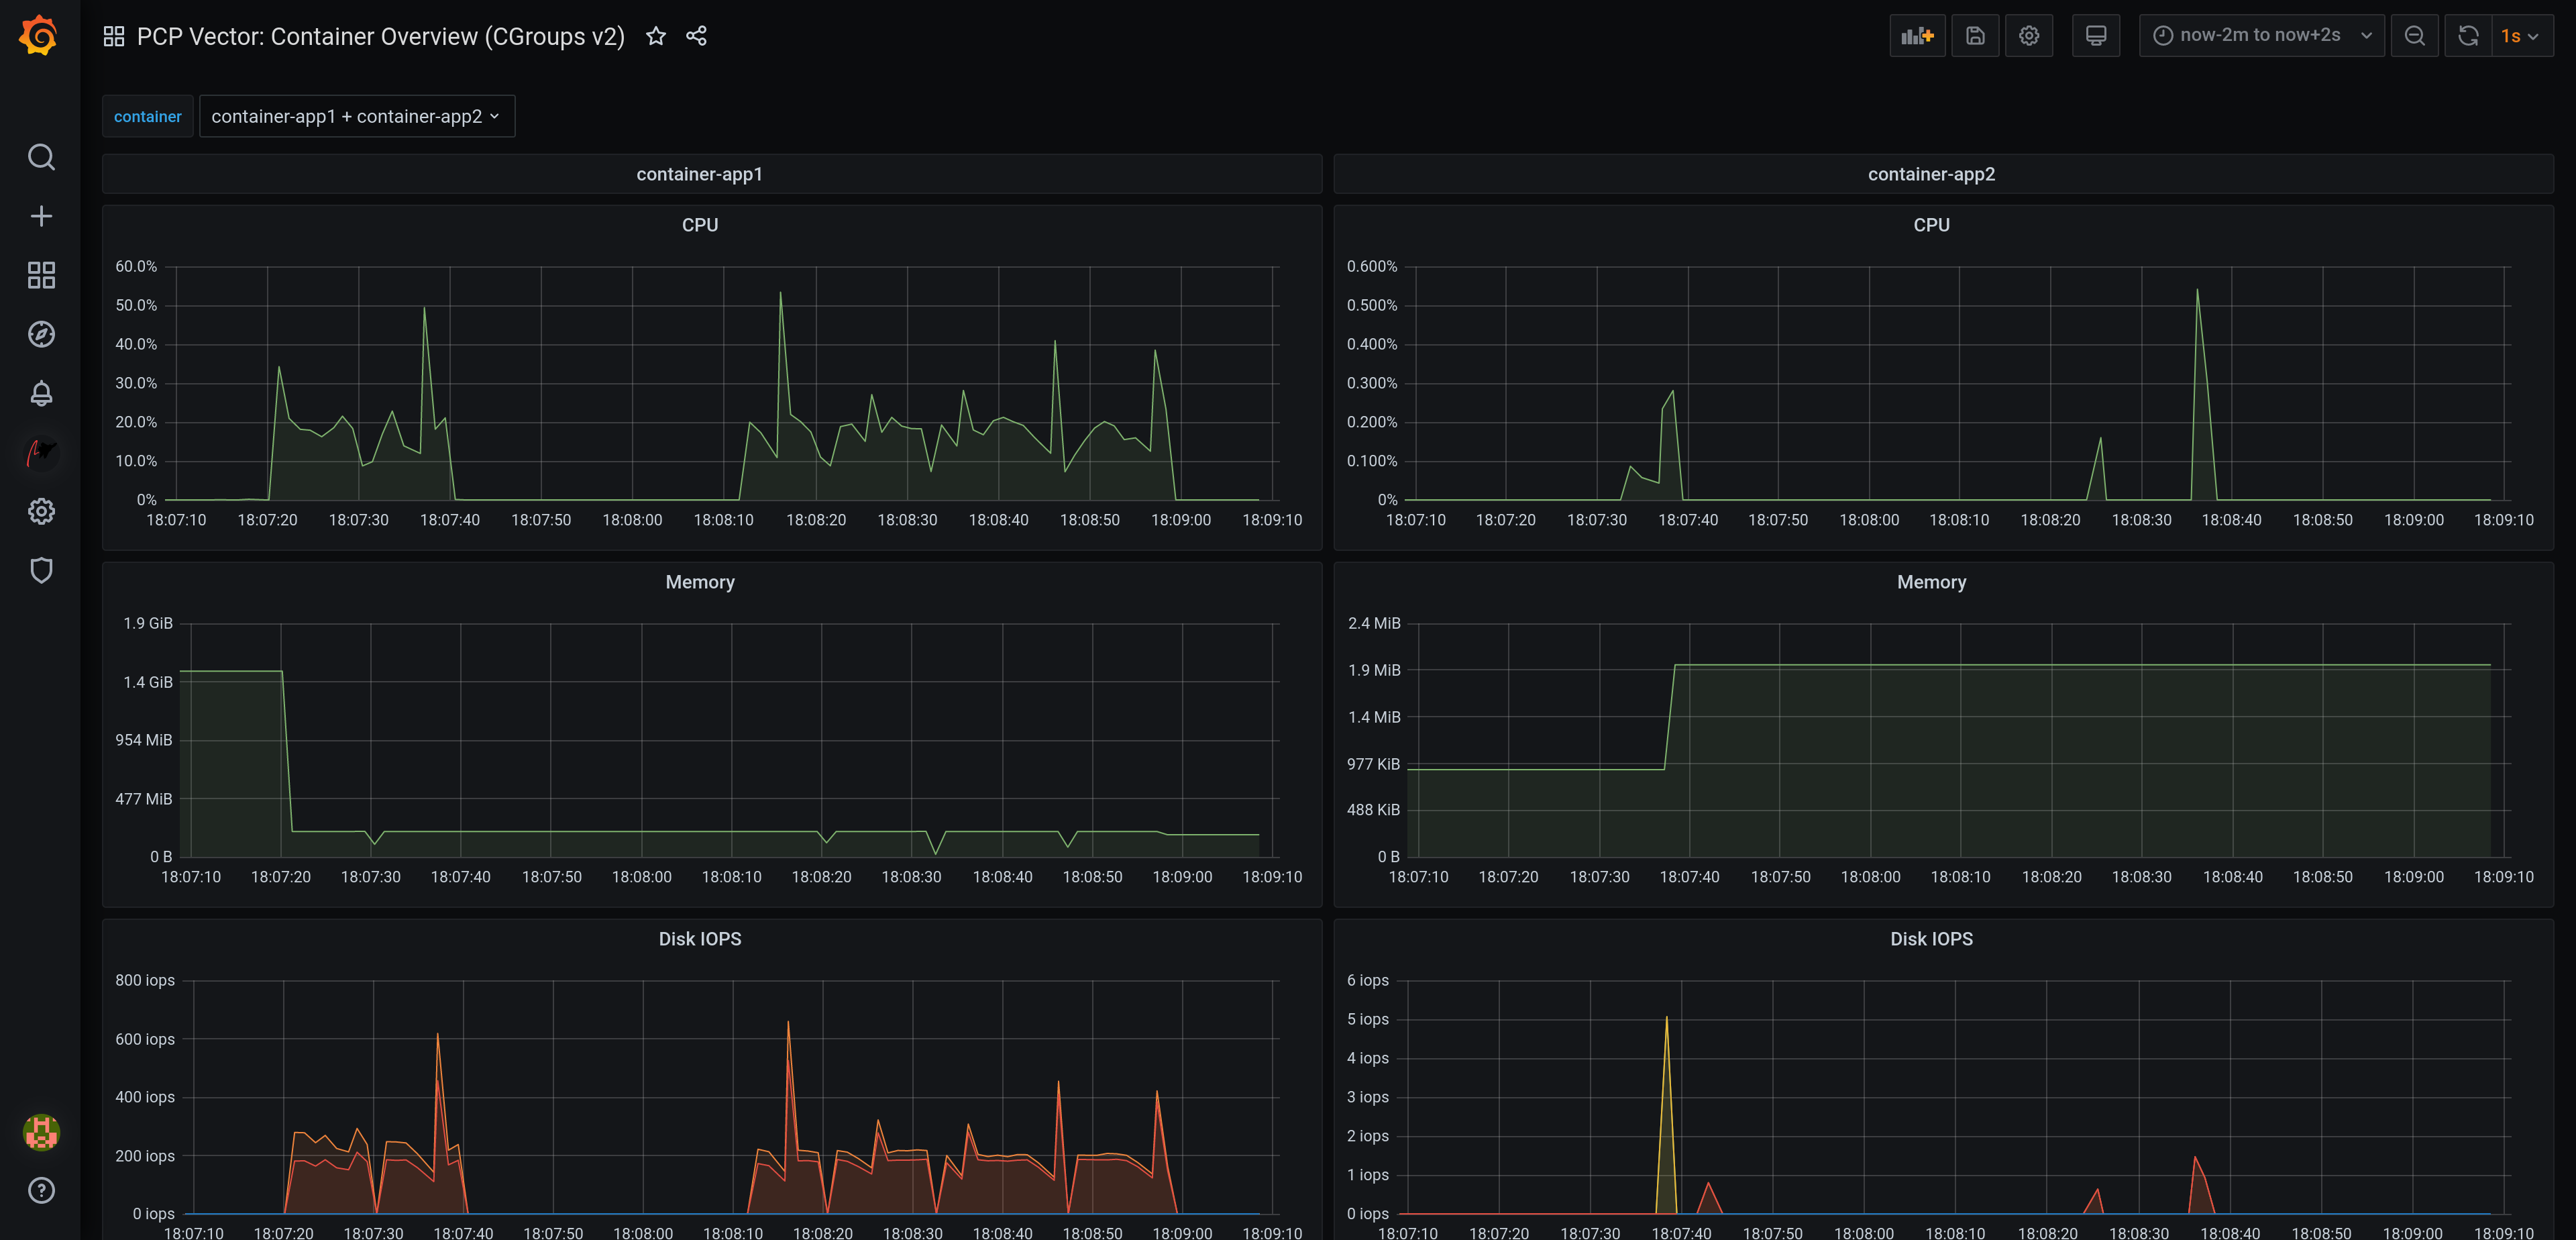
- dashboards: new container overview dashboard with CGroups v2
Breaking Changes in v3.0
- dashboards: All dashboards are now located in the Dashboards tab at the datasource settings pages and are not imported automatically
- redis: Using
label_values(metric, label)in a Grafana variable query is deprecated due to performance reasons.label_values(label)is still supported.
New Features
- redis: added instance.name and dashboard variables support in query editor
- redis: heatmap support
- dashboards: updated PCP Redis Metric Preview dashboards: added metric drop-down
- dashboards: added MS SQL server dashboard for Vector (Louis Imershein)
- chore: sign plugin
Enhancements / Bug Fixes
- redis: implement workaround if two values for the same instance and timestamp are received
- redis: send one instance labels request instead of one per instance
- redis: refresh instances only once per series
- redis: improved error messages
- vector: (internal) option to disable time utilization conversion
- vector: show error message when access mode is set to server & url override is set
- vector: disable redis backfill for now (pmseries and pmapi instance id's don't match)
- bpftrace: interpret all fields of CSV output as strings
- dashboards: moved dashboards to the datasource level: dashboards of interest can be imported using the dashboards tab of each datasource settings page
- dashboards: fix KB/s unit in dashboards, should be KiB/s
- dashboards: add installation instructions to BCC and bpftrace dashboards
- dashboards: update titles and add units to checklist dashboards
- search: fix datasource detection
- search: propagate error messages to the user
- poller: use timeout instead of interval to prevent overlapping timers
- poller: deregister targets immediately if endpoint changed
- chore: update build dependencies
- test: add unit tests to all datasources
- test: add End-to-End tests
- docs: update authentication guide to use scram-sha-256
3.0.0-beta1 (2020-10-12)
New Features
- redis: support for Grafana Alerting
- redis: full-text search in metric names, descriptions, instances
- vector: support derived metrics, which allows the usage of arithmetic operators and statistical functions inside a query, see pmRegisterDerived(3)
- vector: set background metric poll interval according to current dashboard refresh interval, do not stop polling while in background
- vector: automatically configure the unit of the panel
- vector: redis backfilling: if redis is available, initialize the graph with historical data
- vector: configurable hostspec (access remote PMCDs through a central pmproxy)
- vector: access context, metric, instancedomain and instance labels
- dashboards: checklist dashboard: detects potential performance issues and shows possible solutions to resolve them
- dashboards: eBPF/BCC dashboard
- dashboards: container overview dashboard with CGroups v2
Enhancements / Bug Fixes
- build: convert dashboards to jsonnet/grafonnet
- all: use latest Grafana UI components based on React (Grafana previously used Angular)
Redis datasource installation
Unfortunately it is not possible to sign community plugins at the moment. Therefore the PCP Redis datasource plugin needs to be allowed explicitely in the Grafana configuration file:
allow_loading_unsigned_plugins = pcp-redis-datasource
Restart Grafana server, and check the logs if the plugin loaded successfully.
Deprecated features
- redis: Using
label_values(metric, label)in a Grafana variable query is deprecated due to performance reasons.label_values(label)is still supported.
2.0.2 (2020-02-25)
- vector, redis: remove autocompletion cache (PCP metrics can be added and removed dynamically)
2.0.1 (2020-02-17)
- build: fix production build (implement workaround for systemjs/systemjs#2117, grafana/grafana#21785)
2.0.0 (2020-02-17)
- vector, bpftrace: fix version checks on dashboard load (prevent multiple pmcd.version checks on dashboard load)
- vector, bpftrace: change datasource check box to red if URL is inaccessible
- redis: add tests
- flame graphs: support multidimensional eBPF maps (required to display e.g. the process name)
- dashboards: remove BCC metrics from Vector host overview (because the BCC PMDA isn't installed by default)
- misc: update dependencies
2.0.0-beta1 (2019-12-12)
- support Grafana 6.5+, drop support for Grafana < 6.5
1.0.7 (2020-01-29)
- redis: fix timespec (fixes empty graphs for large time ranges)
1.0.6 (2020-01-07)
- redis: support wildcards in metric names (e.g.
disk.dev.*) - redis: fix label support
- redis: fix legends
1.0.5 (2019-12-16)
- redis: set default sample interval to
60s(fixes empty graph borders) - build: upgrade
copy-webpack-pluginto mitigate XSS vulnerability in theserialize-javascripttransitive dependency - build: remove deprecated
uglify-webpack-plugin
1.0.4 (2019-12-11)
Enhancements
- flame graphs: clean flame graph stacks every 5s (reduces CPU load)
- general: implement PCP version checks
Bug Fixes
- build: remove
weakdependency (doesn't work with Node.js 12) - build: upgrade
terser-webpack-pluginto mitigate XSS vulnerability in theserialize-javascripttransitive dependency
1.0.3 (2019-11-22)
- fix flame graph dependency (
flamegraph.destroyerror in javascript console)
1.0.2 (2019-11-12)
- handle counter wraps (overflows)
- convert time based counters to time utilization
1.0.1 (2019-10-24)
Flame Graphs
- aggregate stack counts by selected time range in the Grafana UI
- add an option to hide idle stacks
Vector
- fix container dropdown in the query editor
- remove container setting from the datasource settings page
Redis
- fix value transformations (e.g., rate conversion of counters)
All
- request more datapoints from the datasource to fill the borders of the graph panel
1.0.0 (2019-10-11)
bpftrace
- support for Flame Graphs
- context-sensitive auto-completion for bpftrace probes, builtin variables, and functions incl. help texts
- parse the output of bpftrace scripts (e.g., using
printf()) as CSV and display it in the Grafana table panel - sample dashboards (BPFtrace System Analysis, BPFtrace Flame Graphs)
Vector
- table output: show instance name in the left column
- table output: support non-matching instance names (cells of metrics which don't have the specific instance will be blank)
Vector & bpftrace
- if the metric/script gets changed in the query editor, immediately stop polling the old metric/deregister the old script
- improve pmwebd compatibility
miscellaneous
- help texts for all datasources (visible with the [ ? ] button in the query editor)
- renamed PCP Live to PCP Vector
- logos for all datasources
- improved error handling
0.0.7 (2019-08-16)
- The initial release of grafana-pcp
Features
- retrieval of Performance Co-Pilot metrics from pmseries (PCP Redis), pmproxy, and pmwebd (PCP Live)
- automatic rate conversion of counter metrics
- auto-completion of metric names <sup>1,2</sup>, qualifier keys, and values <sup>2</sup>
- display of semantics, units, and help texts of metrics <sup>1</sup>
- legend templating support with
$metric,$metric0,$instance,$some_label - container support
- support for repeating panels
- support for custom endpoint URL and container setting per query, with templating support <sup>1</sup>
- heatmap and table support <sup>1</sup>
- sample dashboards for PCP Redis and PCP Live
<sup>1</sup> PCP Live <sup>2</sup> PCP Redis
Known Bugs
- the bpftrace datasource is work-in-progress and will be ready with the next release (approx. 1-2 weeks)
Thanks to Jason Koch for the initial pcp-live datasource implementation and the host overview dashboard.


