Plugins 〉Parseable
Parseable
Parseable Datasource for Grafana
This data source plugin allows you to query and visualize log data stored in Parseable server.
Pre-requisites
Parseable server setup and receiving logs from your application. Read more on Parseable documentation.
Installation
Install the plugin using the Grafana CLI, using the command
grafana-cli plugins install parseable-datasource. Then restart Grafana. Alternatively, you can install the plugin from your Grafana instance (Configuration > Data sources > Add Data source).Add Parseable as a data source at the data source configuration page.
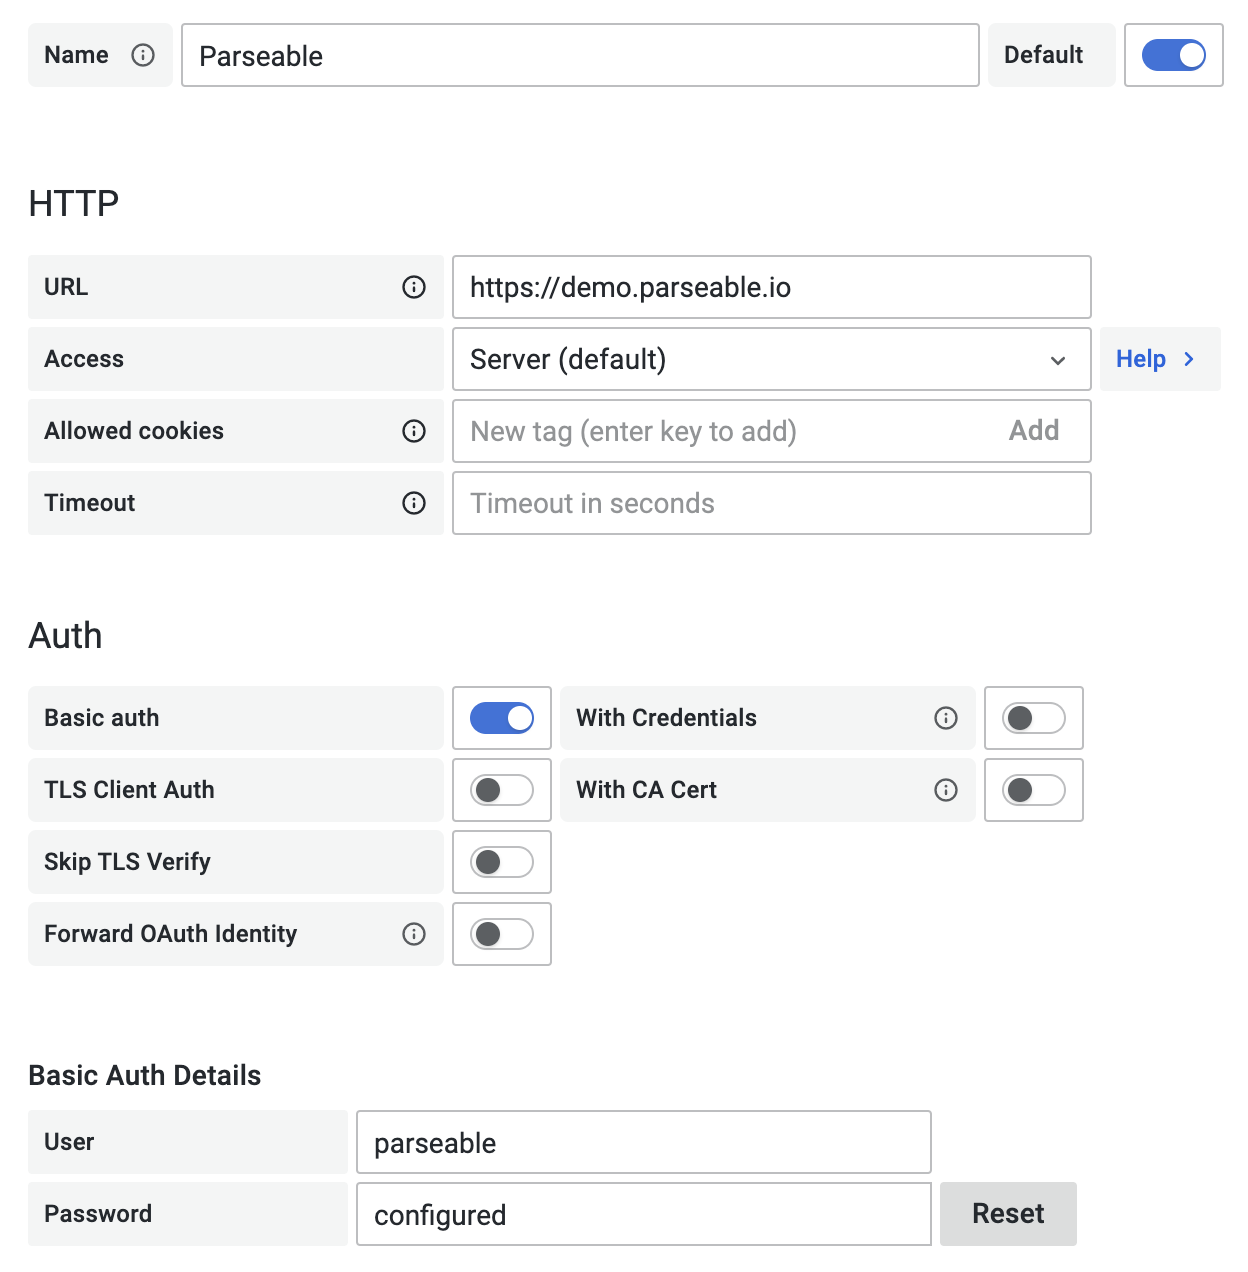
Configure the data source specifying URL and port like https://demo.parseable.com:443. Parseable supports basic auth currently, so toggle the "Basic Auth" option under "Auth" section and enter the username and password under "Basic Auth Details" section. For Parseable demo server use
parseableas both, username and password.Push the
Save and Testbutton, if there is an error message, check the credentials and connection.

Usage
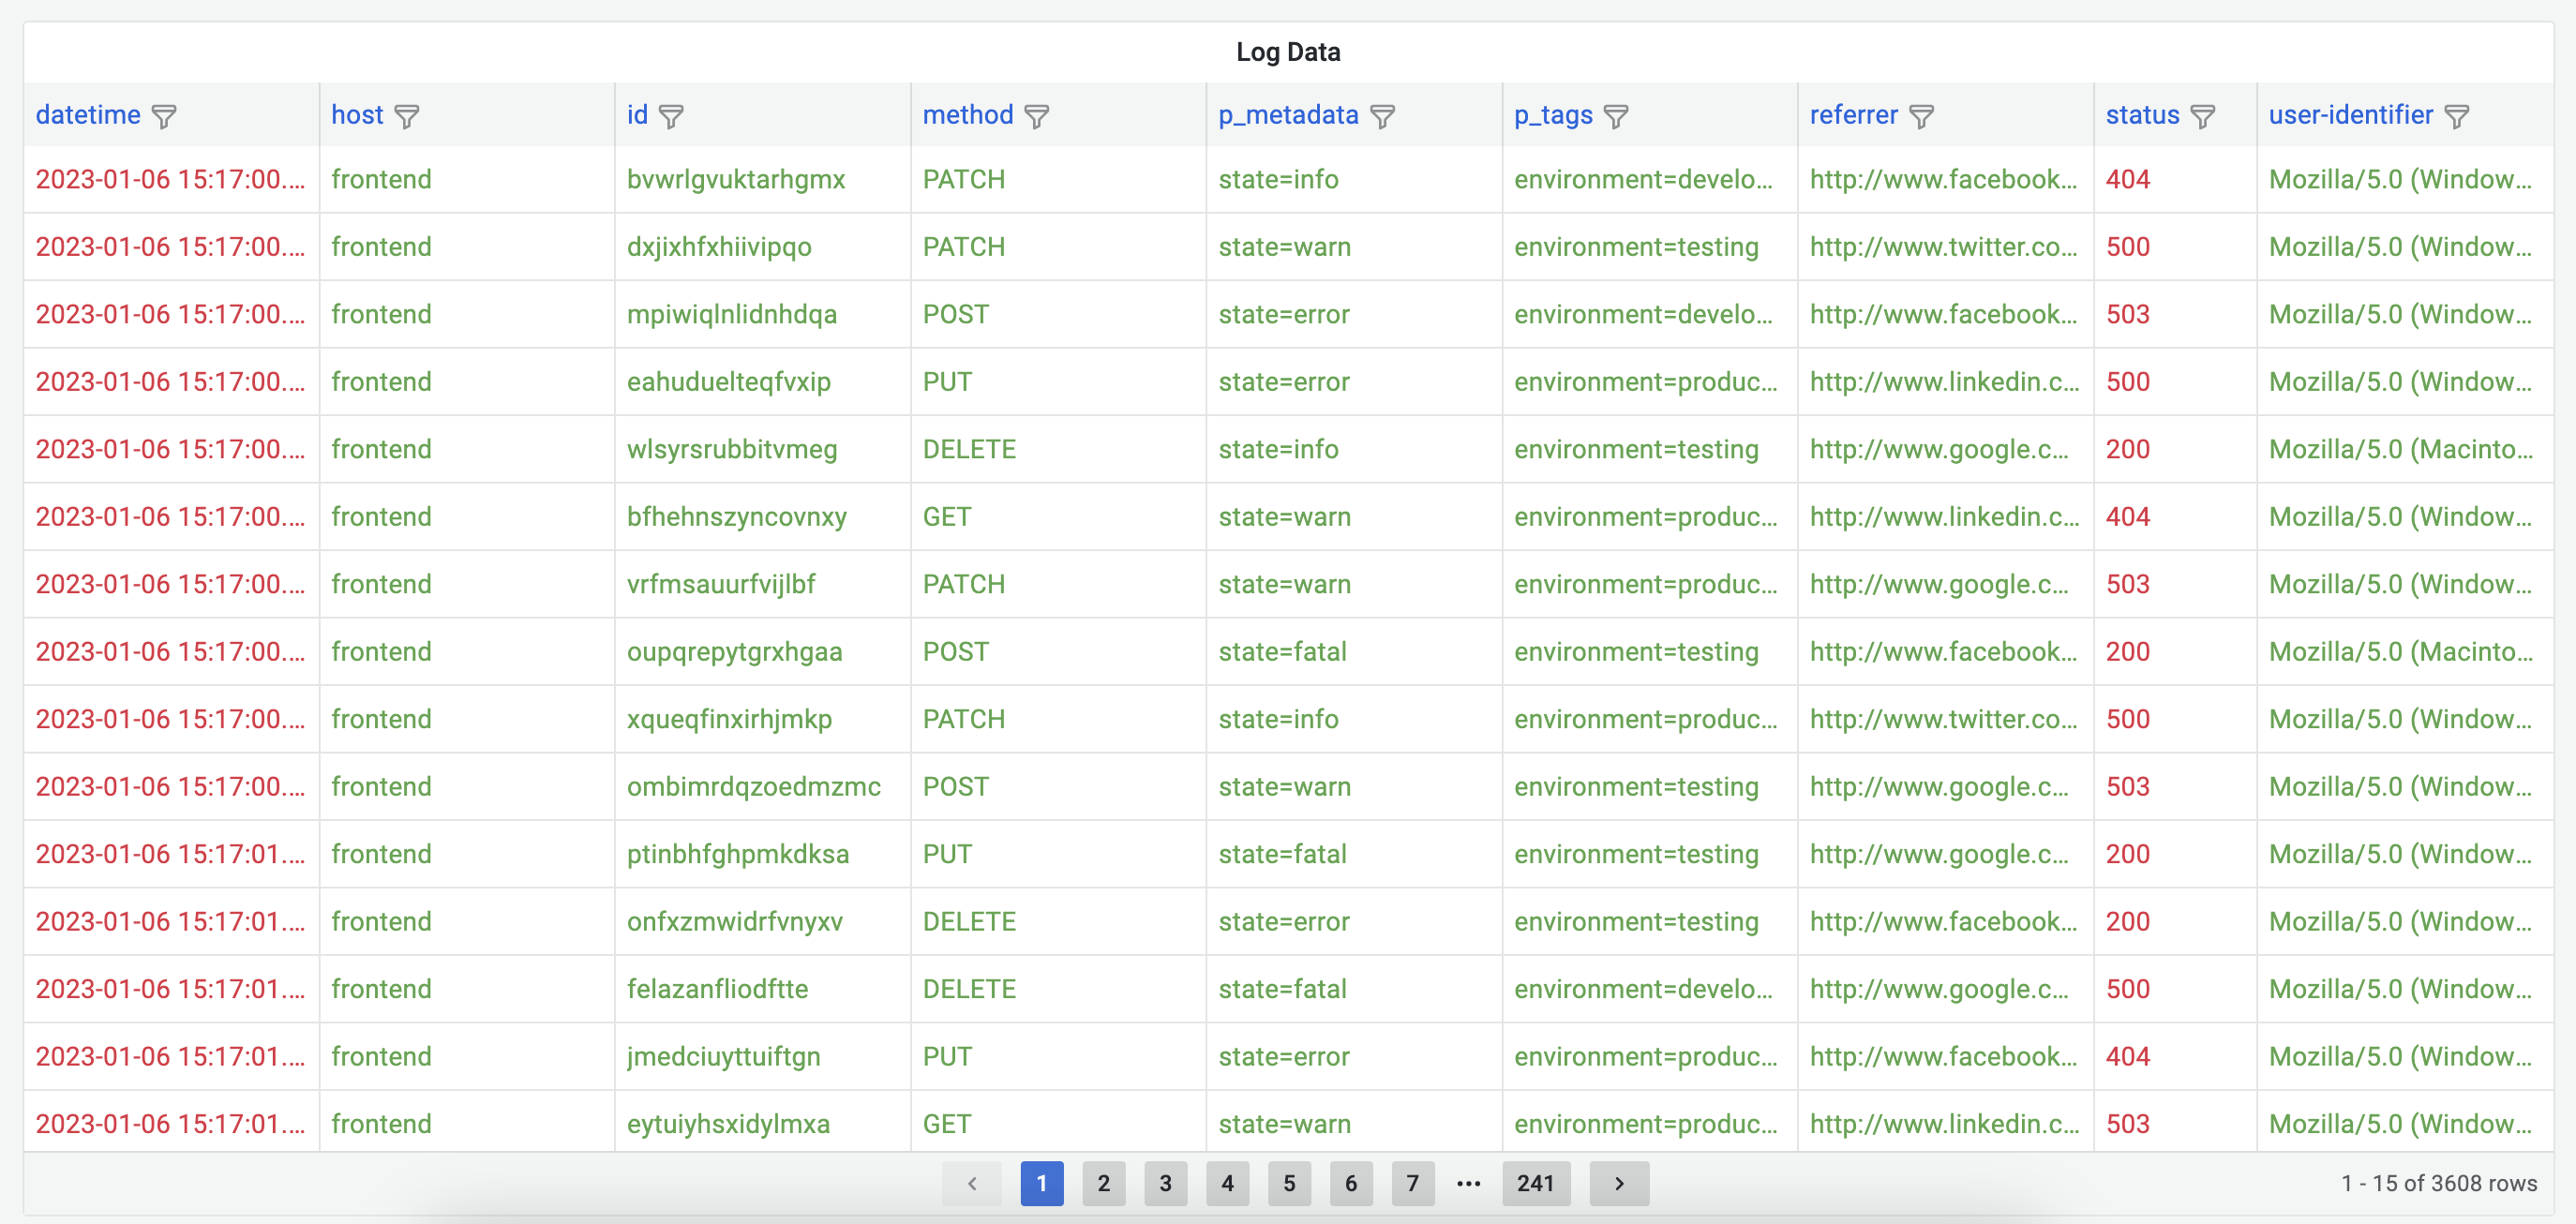
Once the plugin is configured with correct Parseable server instance. You can start using it to query logs and visualize them. You can use the query editor to write your own queries.
Importing Dashboards
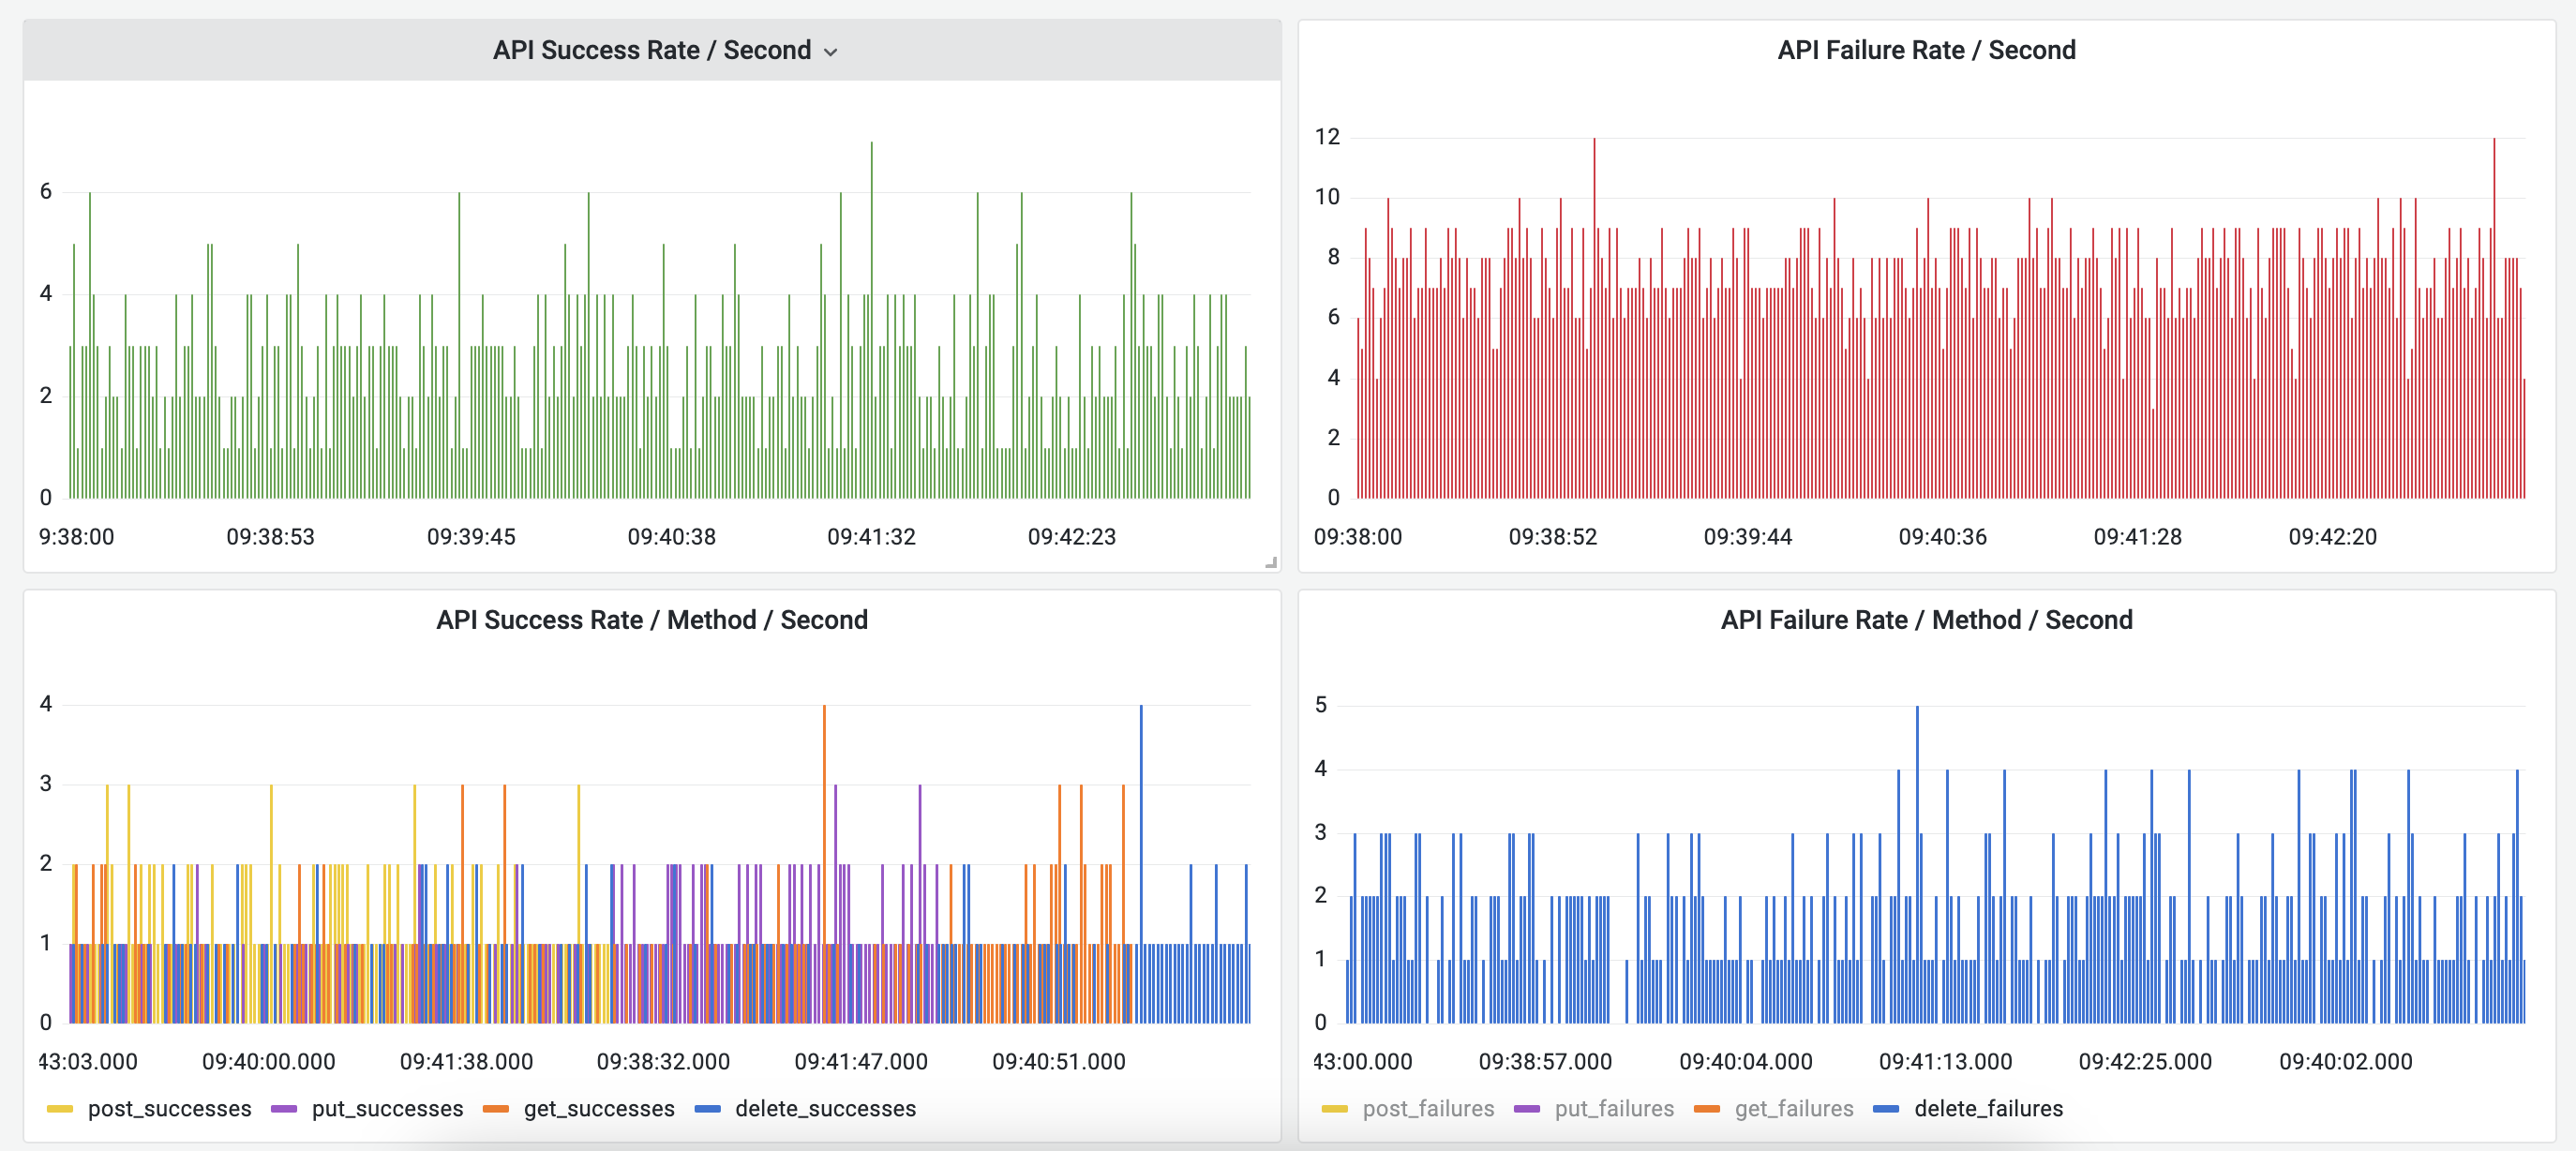
This plugin has a a pre-made dashboard called "Parseable Demo Data". You can find it by navigating to the data sources configuration page, selecting the Parseable data source and clicking on the Dashboards tab.
This dashboard is aimed at visualizing the logs stored in the Parseable demo server. You can use it as a starting point for your own dashboards. To use this dashboard, you will need to configure the data source with the Parseable demo server URL https://demo.parseable.com and credentials parseable, parseable.
Screenshots


Grafana Cloud Free
- Free tier: Limited to 3 users
- Paid plans: $55 / user / month above included usage
- Access to all Enterprise Plugins
- Fully managed service (not available to self-manage)
Self-hosted Grafana Enterprise
- Access to all Enterprise plugins
- All Grafana Enterprise features
- Self-manage on your own infrastructure
Installing Parseable on Grafana Cloud:
Installing plugins on a Grafana Cloud instance is a one-click install; same with updates. Cool, right?
Note that it could take up to 1 minute to see the plugin show up in your Grafana.
Installing plugins on a Grafana Cloud instance is a one-click install; same with updates. Cool, right?
Note that it could take up to 1 minute to see the plugin show up in your Grafana.
Installing plugins on a Grafana Cloud instance is a one-click install; same with updates. Cool, right?
Note that it could take up to 1 minute to see the plugin show up in your Grafana.
Installing plugins on a Grafana Cloud instance is a one-click install; same with updates. Cool, right?
Note that it could take up to 1 minute to see the plugin show up in your Grafana.
Installing plugins on a Grafana Cloud instance is a one-click install; same with updates. Cool, right?
Note that it could take up to 1 minute to see the plugin show up in your Grafana.
Installing plugins on a Grafana Cloud instance is a one-click install; same with updates. Cool, right?
Note that it could take up to 1 minute to see the plugin show up in your Grafana.
Installing plugins on a Grafana Cloud instance is a one-click install; same with updates. Cool, right?
Note that it could take up to 1 minute to see the plugin show up in your Grafana.
For more information, visit the docs on plugin installation.
Installing on a local Grafana:
For local instances, plugins are installed and updated via a simple CLI command. Plugins are not updated automatically, however you will be notified when updates are available right within your Grafana.
1. Install the Data Source
Use the grafana-cli tool to install Parseable from the commandline:
grafana-cli plugins install The plugin will be installed into your grafana plugins directory; the default is /var/lib/grafana/plugins. More information on the cli tool.
Alternatively, you can manually download the .zip file for your architecture below and unpack it into your grafana plugins directory.
Alternatively, you can manually download the .zip file and unpack it into your grafana plugins directory.
2. Configure the Data Source
Accessed from the Grafana main menu, newly installed data sources can be added immediately within the Data Sources section.
Next, click the Add data source button in the upper right. The data source will be available for selection in the Type select box.
To see a list of installed data sources, click the Plugins item in the main menu. Both core data sources and installed data sources will appear.
Changelog
1.0.0 (Unreleased)
Initial release.


