Plugins 〉Sankey Panel
Sankey Panel
NetSage Sankey Grafana Plugin
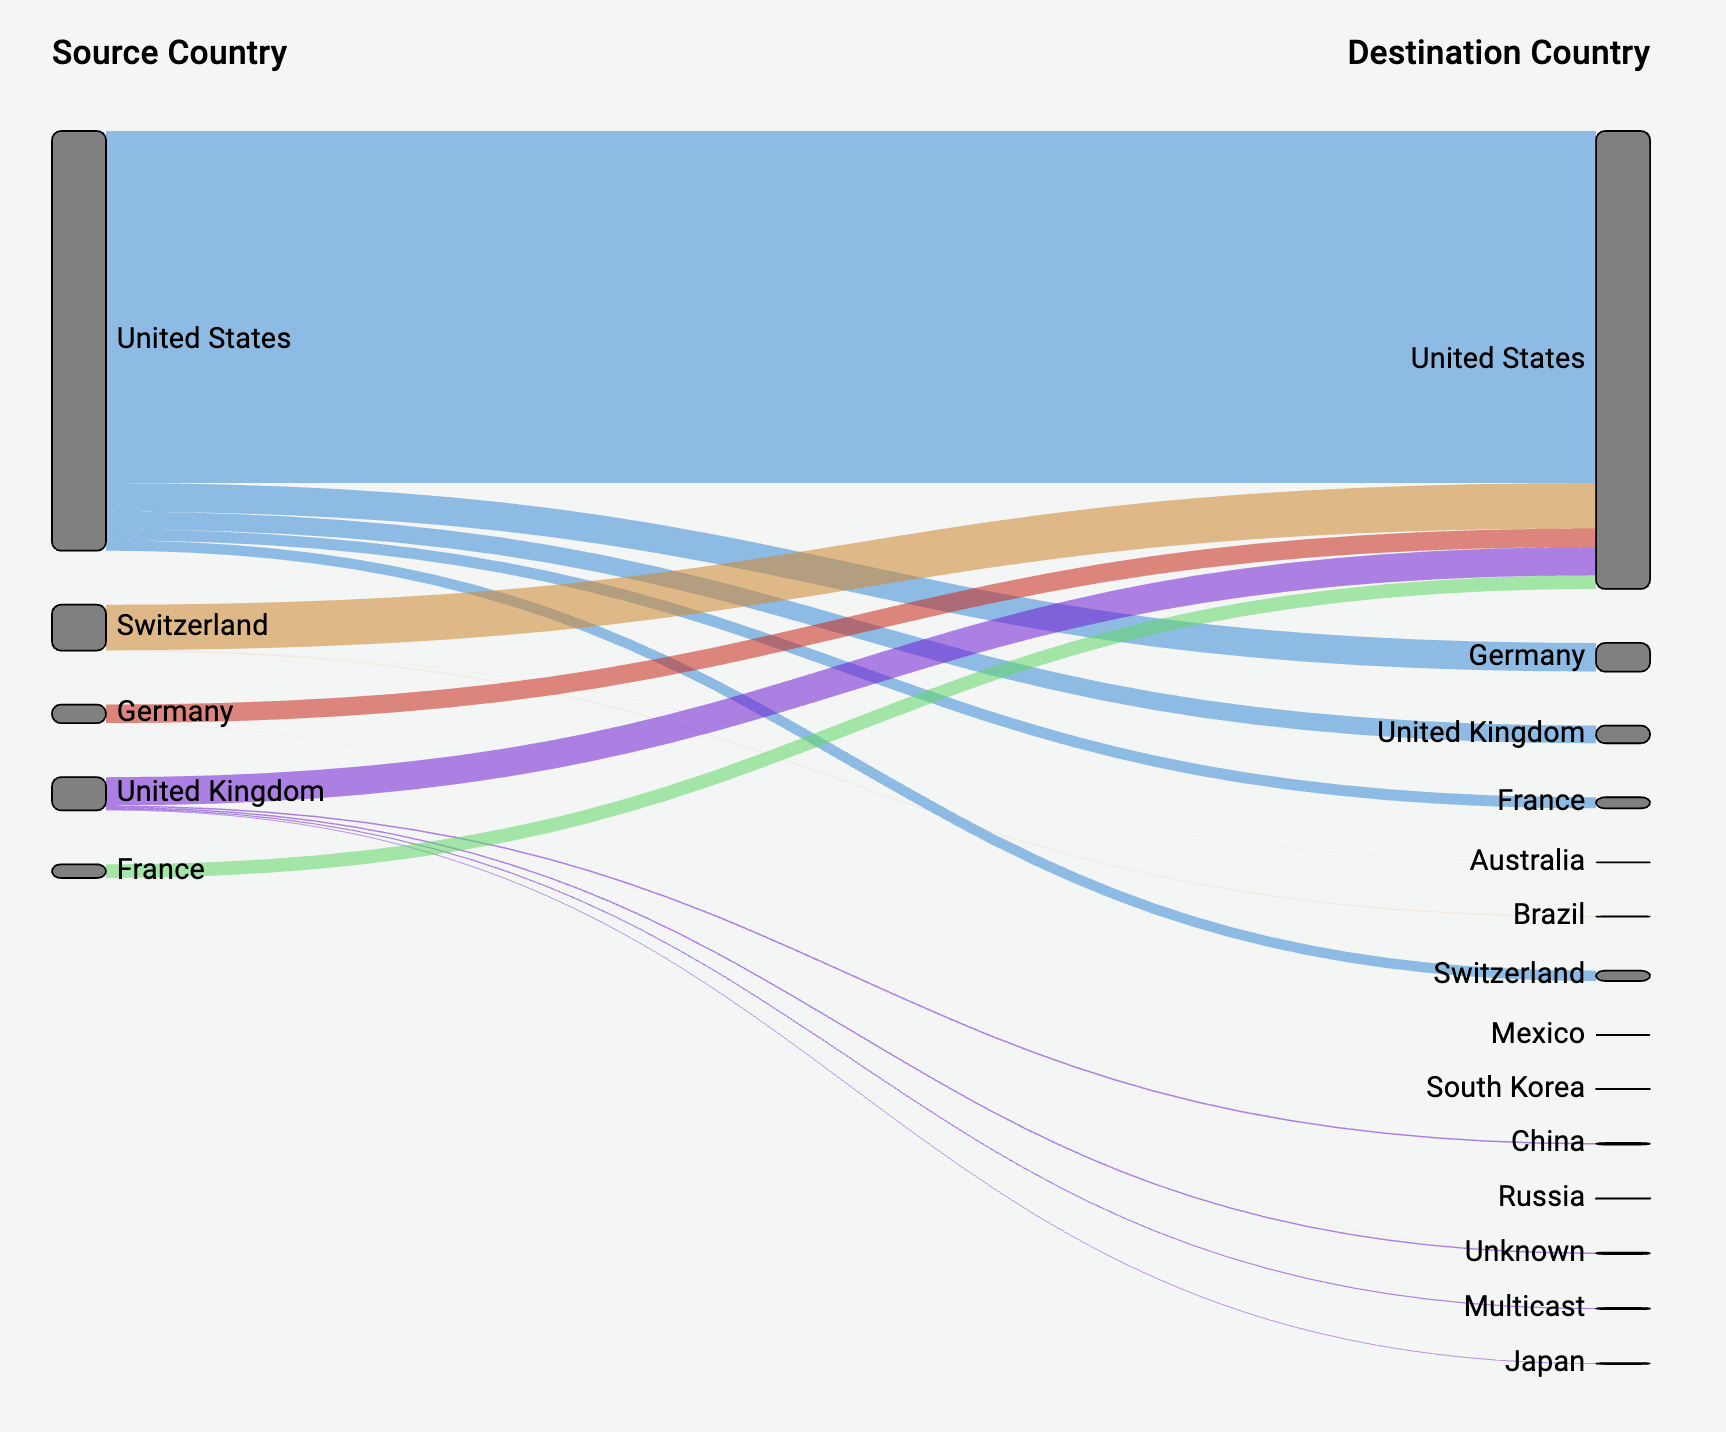
This is a panel plugin for generating Sankey diagrams in Grafana 7.0+. Sankey diagrams are good for visualizing flow data and the width of the flows will be proportionate to the selected metric.

How it works
The sankey panel requires at least 2 columns of data, a source and destination for the flows. This means your query should group your data into at least two groups. The screenshot above shows data grouped by source country, then by destination county. The panel will draw links from the first column of data points, to the last in order of the query. The thickness of the links will be proportionate to the value as assigned by the metric in the query.

Customizing
- Links: There are currently two options for link color: multi or single. It is multi-colored by default. To choose a single color for the links, toggle the "Single Link color only" option and choose your color from Grafana's color picker.
- Nodes: You can change the color of the rectangular nodes by changing the "Node color" option
- Node Width The width of the nodes can be adjusted with the "Node Width" slider or entering a number in the input box. This number must be an integer.
- Node Padding The vertical padding between nodes can be adjusted with the "Node Padding" slider or entering a number in the input box. This number must be an integer. If your links are too skinny, try adjusting this number
- Headers The column headers can be changed by using a Display Name override in the editor panel. They will be the same color you choose for Text color
- Sankey Layout The layout of the sankey links can be adjusted slightly using the "Layout iteration" slider. This number must be an integer and is the number of relaxation iterations used to generate the layout.
Grafana Cloud Free
- Free tier: Limited to 3 users
- Paid plans: $55 / user / month above included usage
- Access to all Enterprise Plugins
- Fully managed service (not available to self-manage)
Self-hosted Grafana Enterprise
- Access to all Enterprise plugins
- All Grafana Enterprise features
- Self-manage on your own infrastructure
Grafana Cloud Free
.h4 . .mb-0 }
- Free tier: Limited to 3 users
- Paid plans: $55 / user / month above included usage
- Access to all Enterprise Plugins
- Fully managed service (not available to self-manage)
Self-hosted Grafana Enterprise
- Access to all Enterprise plugins
- All Grafana Enterprise features
- Self-manage on your own infrastructure
Grafana Cloud Free
- Free tier: Limited to 3 users
- Paid plans: $55 / user / month above included usage
- Access to all Enterprise Plugins
- Fully managed service (not available to self-manage)
Self-hosted Grafana Enterprise
- Access to all Enterprise plugins
- All Grafana Enterprise features
- Self-manage on your own infrastructure
Installing Sankey Panel on Grafana Cloud:
Installing plugins on a Grafana Cloud instance is a one-click install; same with updates. Cool, right?
Note that it could take up to 1 minute to see the plugin show up in your Grafana.
Installing plugins on a Grafana Cloud instance is a one-click install; same with updates. Cool, right?
Note that it could take up to 1 minute to see the plugin show up in your Grafana.
Installing plugins on a Grafana Cloud instance is a one-click install; same with updates. Cool, right?
Note that it could take up to 1 minute to see the plugin show up in your Grafana.
Installing plugins on a Grafana Cloud instance is a one-click install; same with updates. Cool, right?
Note that it could take up to 1 minute to see the plugin show up in your Grafana.
Installing plugins on a Grafana Cloud instance is a one-click install; same with updates. Cool, right?
Note that it could take up to 1 minute to see the plugin show up in your Grafana.
Installing plugins on a Grafana Cloud instance is a one-click install; same with updates. Cool, right?
Note that it could take up to 1 minute to see the plugin show up in your Grafana.
Installing plugins on a Grafana Cloud instance is a one-click install; same with updates. Cool, right?
Note that it could take up to 1 minute to see the plugin show up in your Grafana.
For more information, visit the docs on plugin installation.
Installing on a local Grafana:
For local instances, plugins are installed and updated via a simple CLI command. Plugins are not updated automatically, however you will be notified when updates are available right within your Grafana.
1. Install the Panel
Use the grafana-cli tool to install Sankey Panel from the commandline:
grafana-cli plugins install The plugin will be installed into your grafana plugins directory; the default is /var/lib/grafana/plugins. More information on the cli tool.
Alternatively, you can manually download the .zip file for your architecture below and unpack it into your grafana plugins directory.
Alternatively, you can manually download the .zip file and unpack it into your grafana plugins directory.
2. Add the Panel to a Dashboard
Installed panels are available immediately in the Dashboards section in your Grafana main menu, and can be added like any other core panel in Grafana.
To see a list of installed panels, click the Plugins item in the main menu. Both core panels and installed panels will appear.
Changelog
1.0.0 (Unreleased)
Initial release.


