Plugins 〉Cal-HeatMap
Cal-HeatMap
Cal-HeatMap Panel Plugin for Grafana
Caution: This plugin is still unstable.
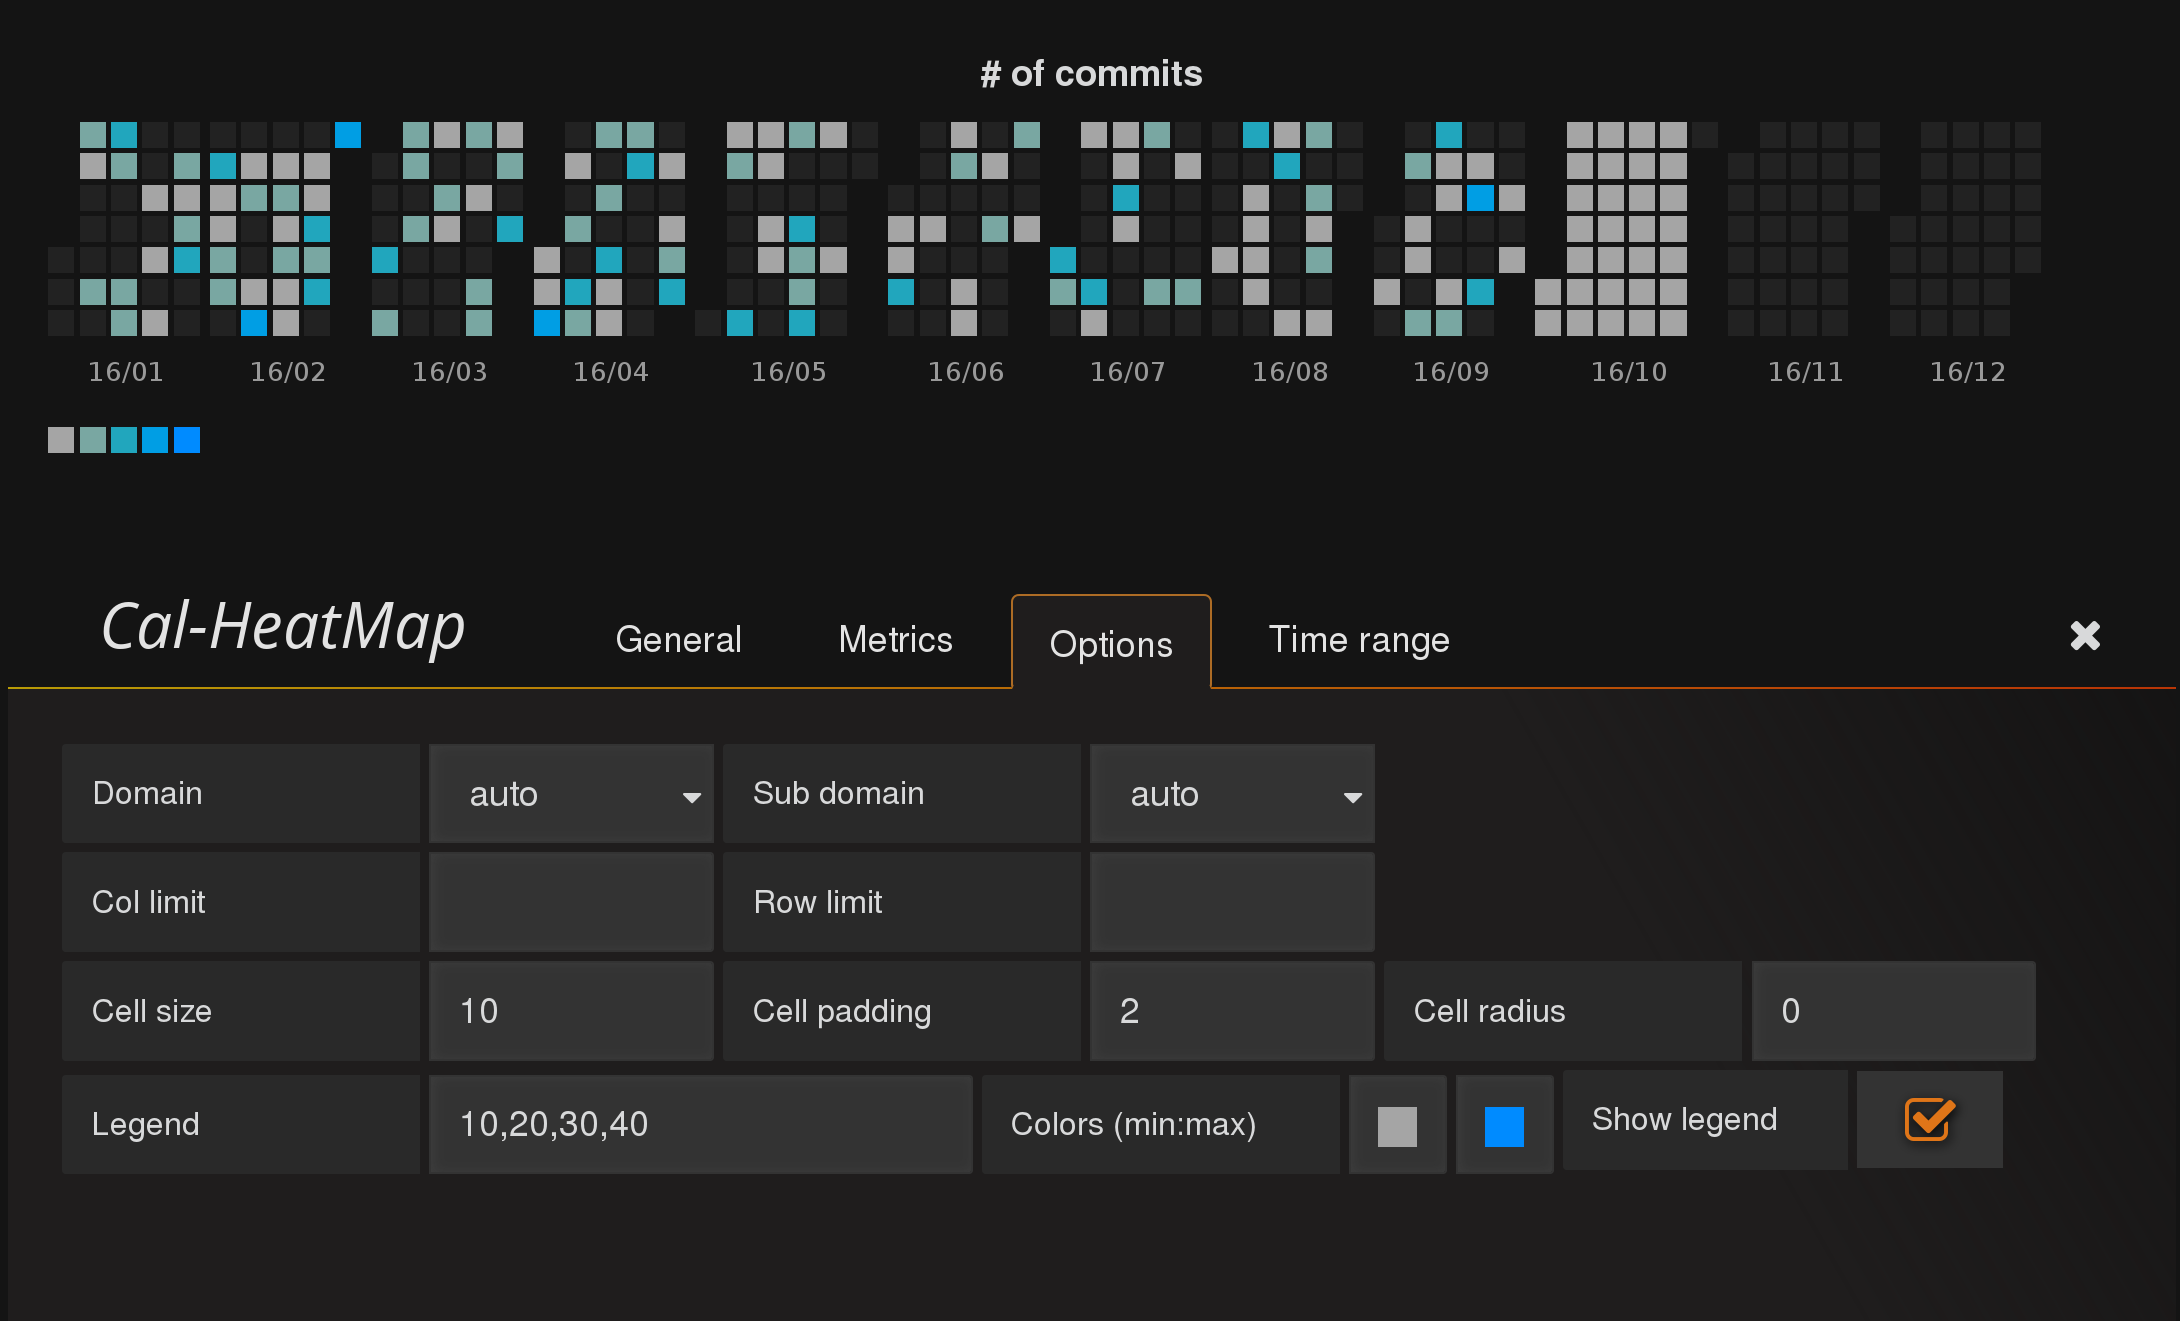
This plugin provides calendar with heatmap, like GitHub contribution calendar.

How to use
This plugin receives single time series data, such as the number of commits per hour, or temperature data. The data is passed to Cal-heatmap javascript module to draw a calendar heatmap. Currently only the first metric is displayed, and the others are ignored.
To visualize numerical series data like temperature recorded each minutes, you may need to specify domain and interval appropriately. For example, to plot the data for each hour (y-axis) and for each day (x-axis), you need to choose "day" as the domain in Option tab, and group metrics by 1 hour interval. Otherwise, the temprature in the same group might be summed up.

Options
Colors, domains, subdomains, cell sizes etc. can be configured.
Please check the official reference for Cal-heatmap for details.
Note about cal-heatmap
cal-heatmap.js in this repositry is modified from original source so that it can be loaded using "import" clause (code for AMD loader was removed).
Grafana Cloud Free
- Free tier: Limited to 3 users
- Paid plans: $55 / user / month above included usage
- Access to all Enterprise Plugins
- Fully managed service (not available to self-manage)
Self-hosted Grafana Enterprise
- Access to all Enterprise plugins
- All Grafana Enterprise features
- Self-manage on your own infrastructure
Installing Cal-HeatMap on Grafana Cloud:
Installing plugins on a Grafana Cloud instance is a one-click install; same with updates. Cool, right?
Note that it could take up to 1 minute to see the plugin show up in your Grafana.
Installing plugins on a Grafana Cloud instance is a one-click install; same with updates. Cool, right?
Note that it could take up to 1 minute to see the plugin show up in your Grafana.
Installing plugins on a Grafana Cloud instance is a one-click install; same with updates. Cool, right?
Note that it could take up to 1 minute to see the plugin show up in your Grafana.
Installing plugins on a Grafana Cloud instance is a one-click install; same with updates. Cool, right?
Note that it could take up to 1 minute to see the plugin show up in your Grafana.
Installing plugins on a Grafana Cloud instance is a one-click install; same with updates. Cool, right?
Note that it could take up to 1 minute to see the plugin show up in your Grafana.
Installing plugins on a Grafana Cloud instance is a one-click install; same with updates. Cool, right?
Note that it could take up to 1 minute to see the plugin show up in your Grafana.
Installing plugins on a Grafana Cloud instance is a one-click install; same with updates. Cool, right?
Note that it could take up to 1 minute to see the plugin show up in your Grafana.
For more information, visit the docs on plugin installation.
Installing on a local Grafana:
For local instances, plugins are installed and updated via a simple CLI command. Plugins are not updated automatically, however you will be notified when updates are available right within your Grafana.
1. Install the Panel
Use the grafana-cli tool to install Cal-HeatMap from the commandline:
grafana-cli plugins install The plugin will be installed into your grafana plugins directory; the default is /var/lib/grafana/plugins. More information on the cli tool.
Alternatively, you can manually download the .zip file for your architecture below and unpack it into your grafana plugins directory.
Alternatively, you can manually download the .zip file and unpack it into your grafana plugins directory.
2. Add the Panel to a Dashboard
Installed panels are available immediately in the Dashboards section in your Grafana main menu, and can be added like any other core panel in Grafana.
To see a list of installed panels, click the Plugins item in the main menu. Both core panels and installed panels will appear.


