
Plugins 〉SPC Histogram

SPC Histogram


SPC Histogram
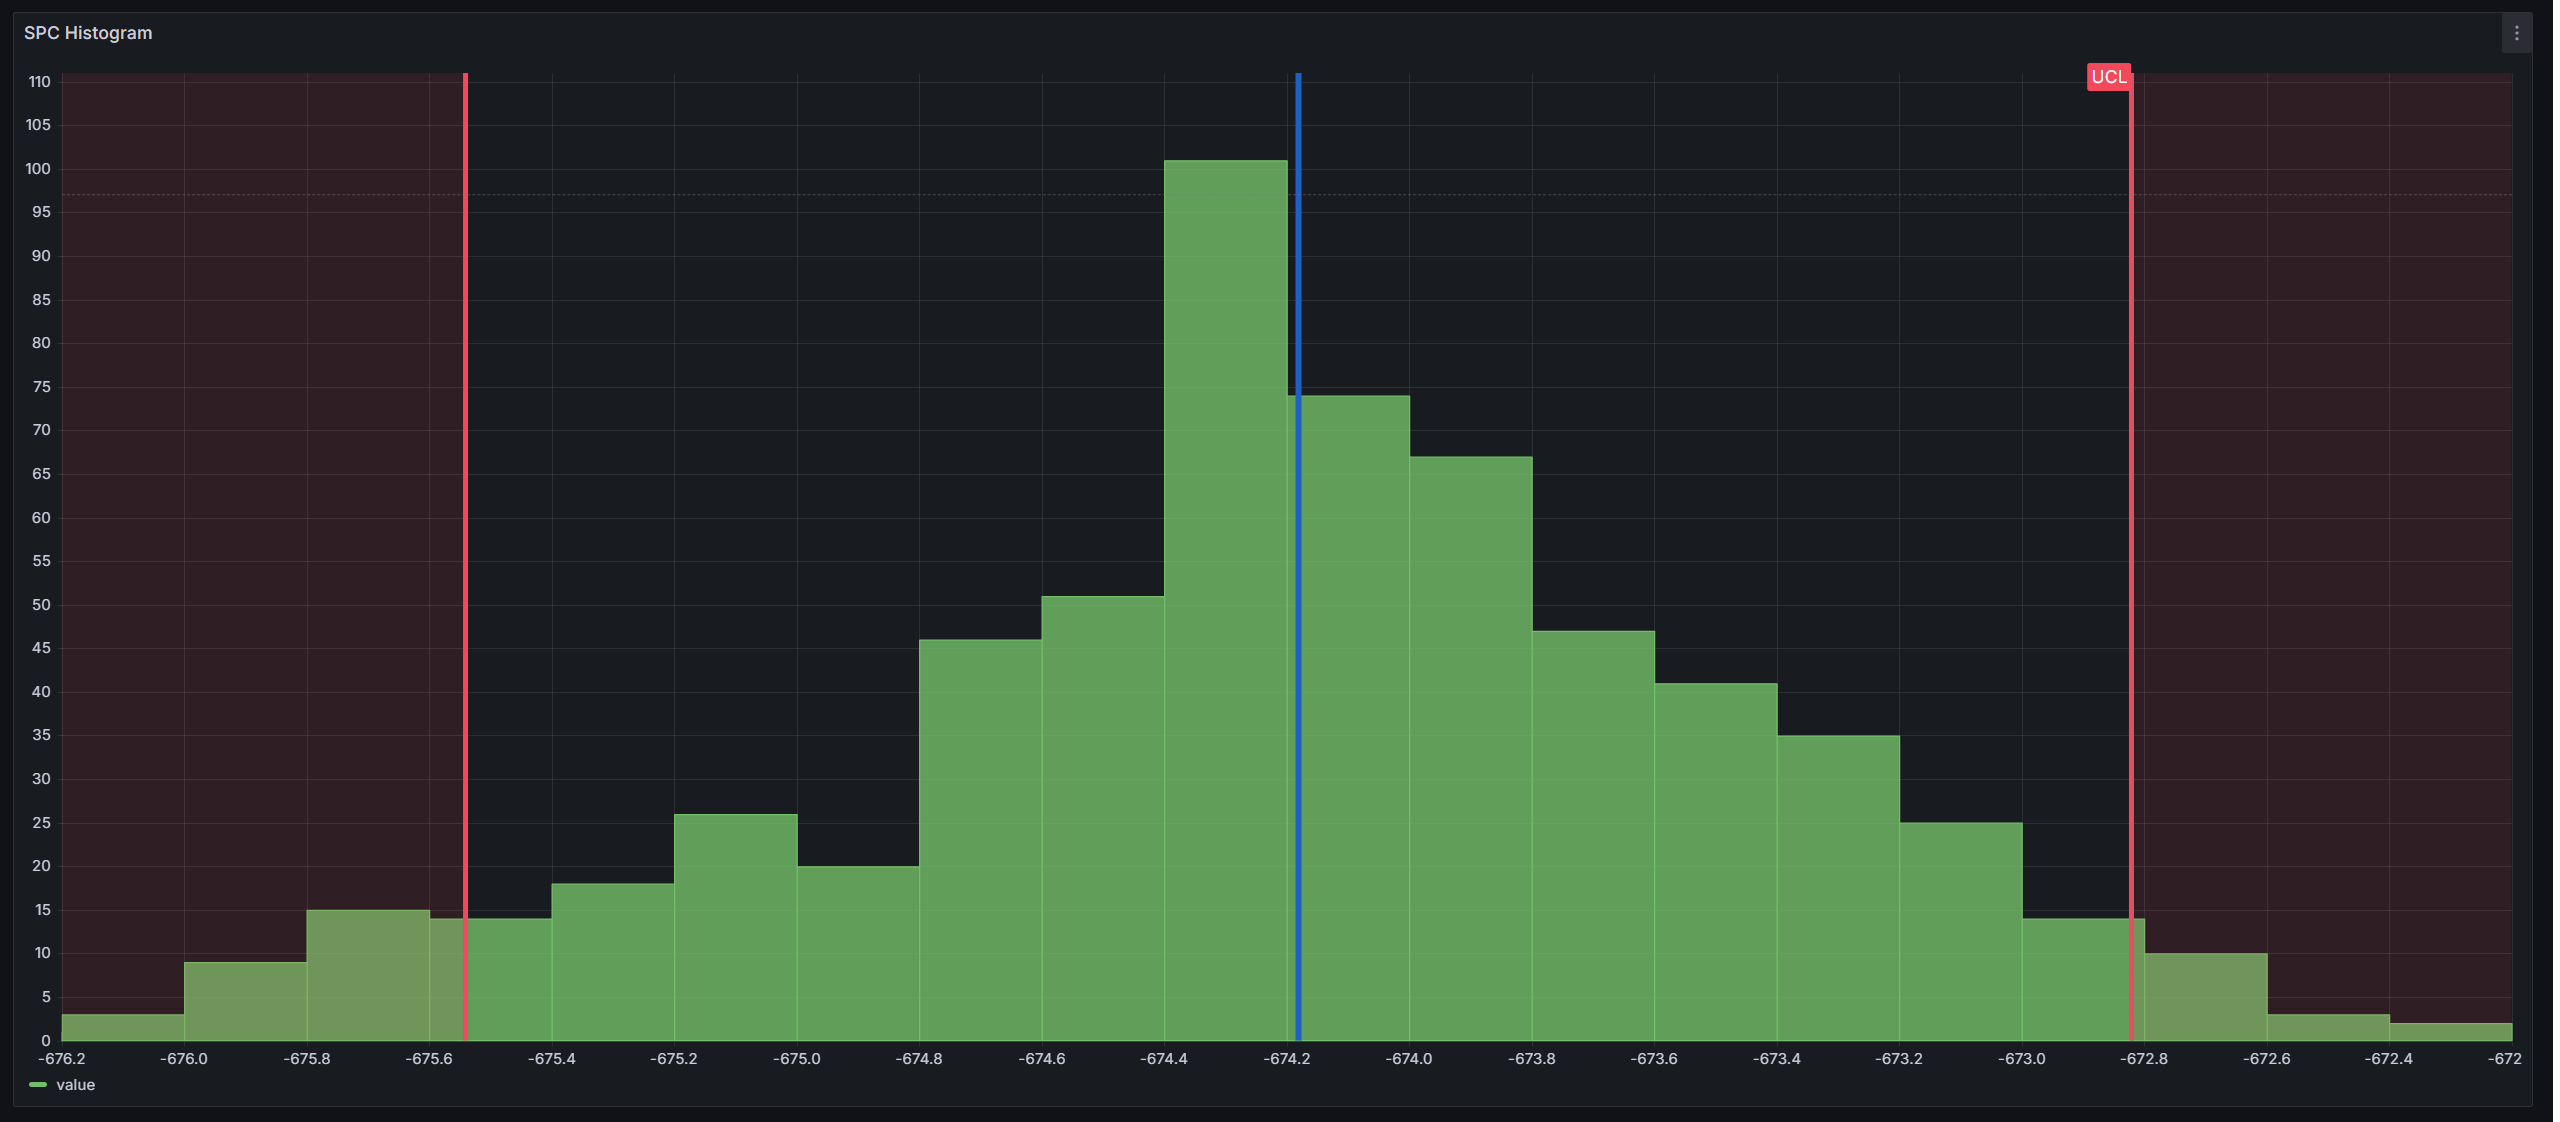
Welcome to the KensoBI SPC Histogram panel for Grafana. This plugin enables you to easily create statistical process control (SPC) histograms, including Xbar-R, XbarS, and XmR charts. It automatically calculates and displays control limits on the histogram as vertical lines, with options to add your own custom limits. Additionally, you can group your samples into subgroups and aggregate them using methods such as moving range, range, mean, or standard deviation.
Features
- Xbar-R, XbarS, and XmR Charts: Create various types of SPC charts.
- Automatic Control Limits: LCL, UCL and mean control limits are automatically calculated and displayed.
- Custom Limits: Add your own limits for more tailored analysis.
- Subgrouping: Group your samples into subgroups and aggregate it.
- Aggregation: Aggregate your data by moving range, range, mean, or standard deviation.
- Histogram Bell Curve Visualize the distribution of your data with a histogram bell curve overlay.
- Gaussian Bell Curve Add a Gaussian (normal) distribution curve to your histogram for comparison and analysis.
Histogram Curve
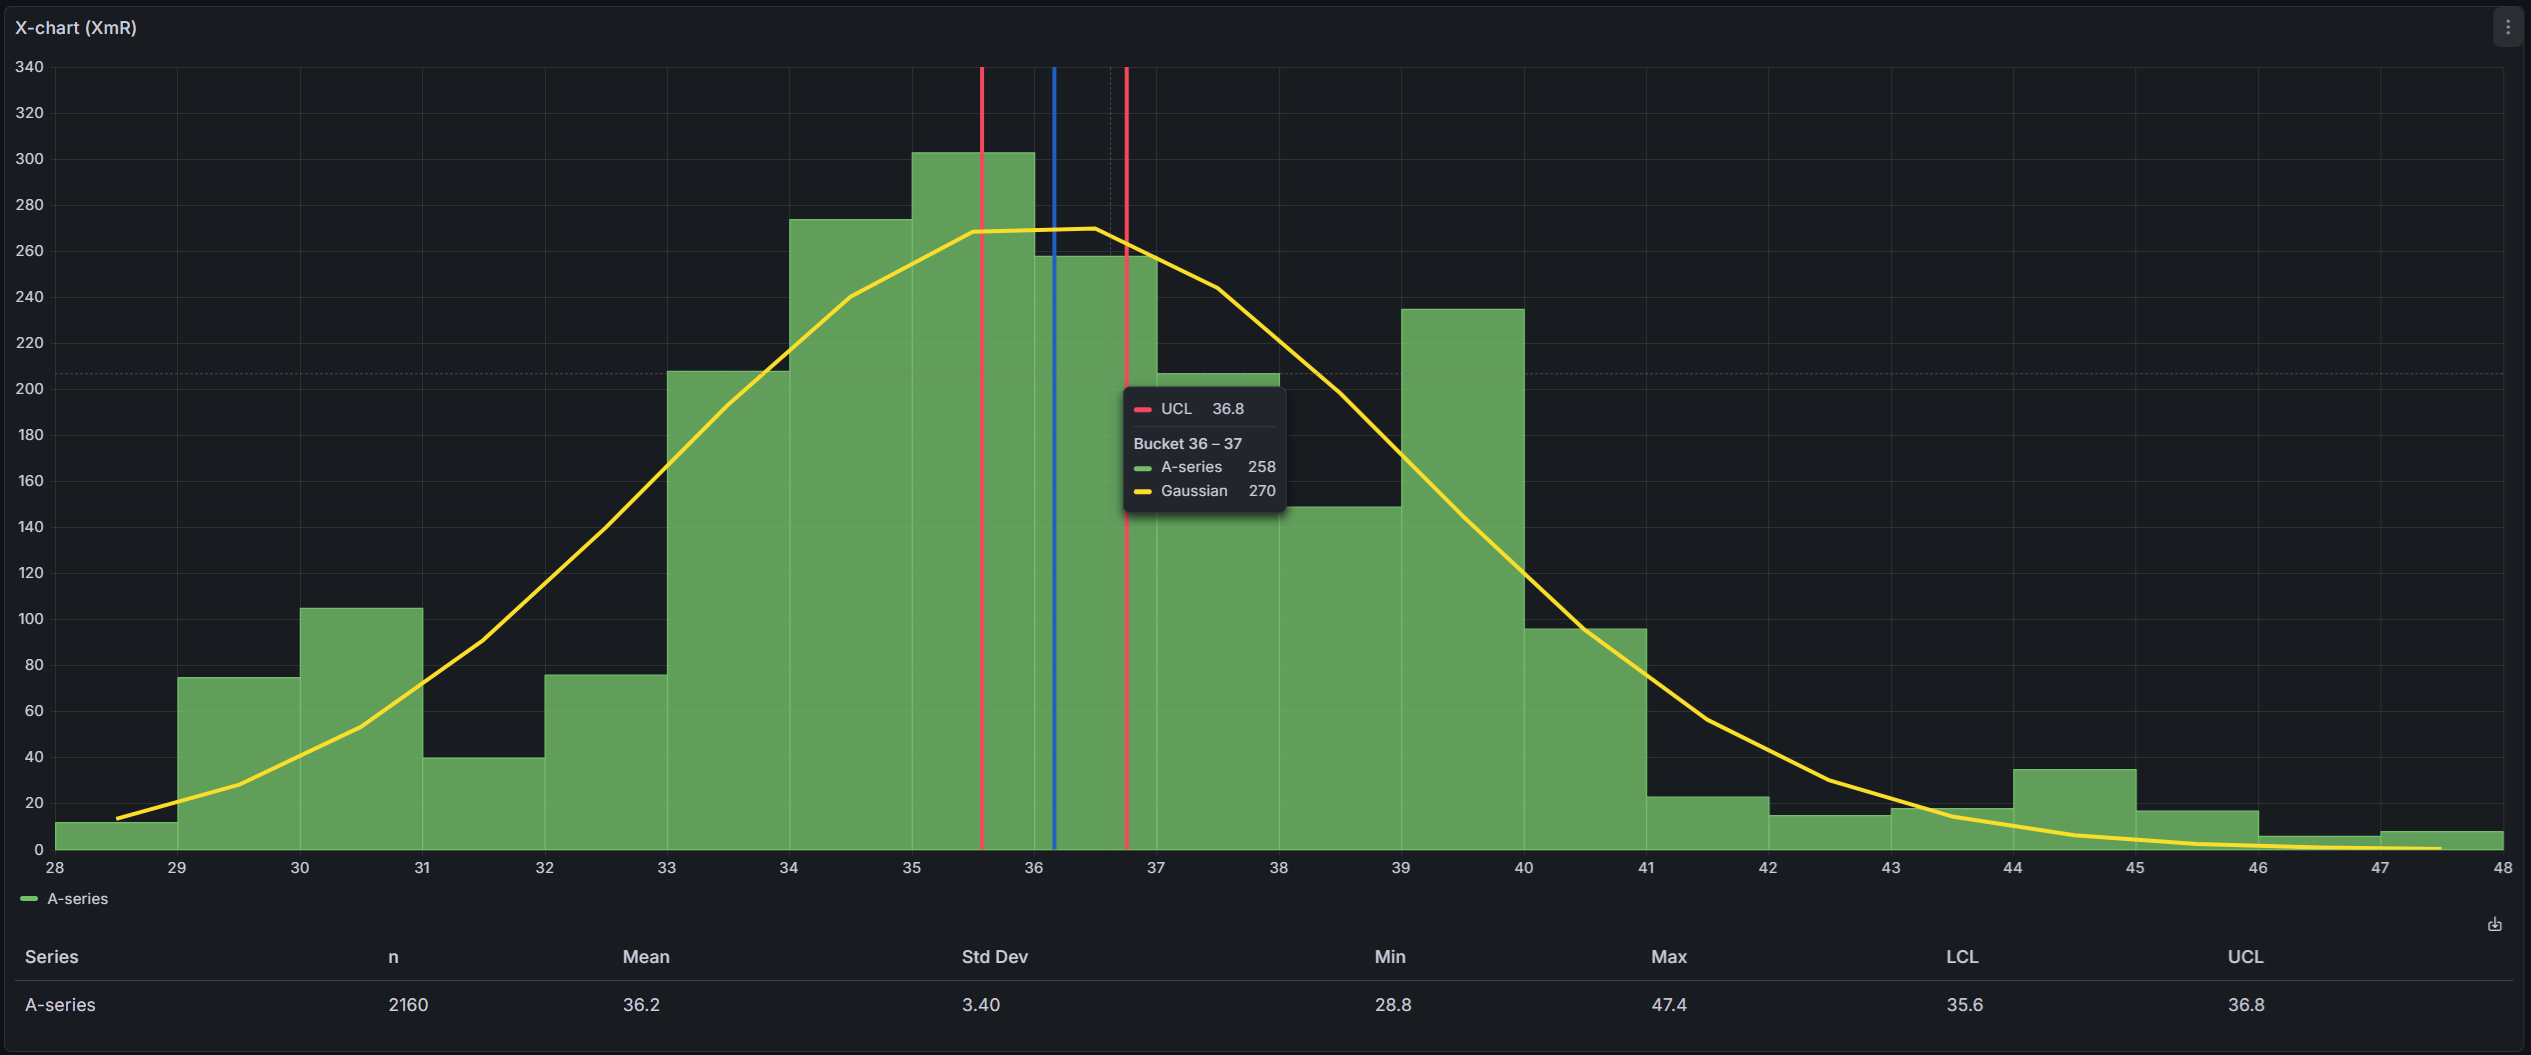
The histogram bell curve provides a smoothed visualization of your data distribution, making it easier to observe overall patterns and trends in the dataset. This curve is created by simply connecting the midpoints of each histogram bin, offering a straightforward representation of the data distribution.
Gaussian Curve

The Gaussian bell curve fits a normal distribution to your data, allowing for a direct comparison between actual data and the ideal normal distribution. This highlights deviations from normality, aiding in process analysis and improvement opportunities.
The Gaussian fit is performed using the Levenberg-Marquardt algorithm, a popular method for solving non-linear least squares problems. This algorithm iteratively adjusts the parameters of the Gaussian function (amplitude, mean, and standard deviation) to minimize the difference between the fitted curve and the actual histogram data.
The implementation uses the ml-levenberg-marquardt library to perform the fitting process, ensuring an accurate representation of the Gaussian distribution that best matches your data.
Getting Help
If you have any questions or feedback, you can:
- Ask a question on the KensoBI Discord channel.
- Create an issue to report bugs, issues, and feature suggestions.
Your feedback is always welcome!
License
This software is distributed under the AGPL-3.0-only.
Notes
Copyright (c) 2024 Kenso Software
Grafana Cloud Free
- Free tier: Limited to 3 users
- Paid plans: $55 / user / month above included usage
- Access to all Enterprise Plugins
- Fully managed service (not available to self-manage)
Self-hosted Grafana Enterprise
- Access to all Enterprise plugins
- All Grafana Enterprise features
- Self-manage on your own infrastructure
Installing SPC Histogram on Grafana Cloud:
Installing plugins on a Grafana Cloud instance is a one-click install; same with updates. Cool, right?
Note that it could take up to 1 minute to see the plugin show up in your Grafana.
Installing plugins on a Grafana Cloud instance is a one-click install; same with updates. Cool, right?
Note that it could take up to 1 minute to see the plugin show up in your Grafana.
Installing plugins on a Grafana Cloud instance is a one-click install; same with updates. Cool, right?
Note that it could take up to 1 minute to see the plugin show up in your Grafana.
Installing plugins on a Grafana Cloud instance is a one-click install; same with updates. Cool, right?
Note that it could take up to 1 minute to see the plugin show up in your Grafana.
Installing plugins on a Grafana Cloud instance is a one-click install; same with updates. Cool, right?
Note that it could take up to 1 minute to see the plugin show up in your Grafana.
Installing plugins on a Grafana Cloud instance is a one-click install; same with updates. Cool, right?
Note that it could take up to 1 minute to see the plugin show up in your Grafana.
Installing plugins on a Grafana Cloud instance is a one-click install; same with updates. Cool, right?
Note that it could take up to 1 minute to see the plugin show up in your Grafana.
For more information, visit the docs on plugin installation.
Installing on a local Grafana:
For local instances, plugins are installed and updated via a simple CLI command. Plugins are not updated automatically, however you will be notified when updates are available right within your Grafana.
1. Install the Panel
Use the grafana-cli tool to install SPC Histogram from the commandline:
grafana-cli plugins install The plugin will be installed into your grafana plugins directory; the default is /var/lib/grafana/plugins. More information on the cli tool.
Alternatively, you can manually download the .zip file for your architecture below and unpack it into your grafana plugins directory.
Alternatively, you can manually download the .zip file and unpack it into your grafana plugins directory.
2. Add the Panel to a Dashboard
Installed panels are available immediately in the Dashboards section in your Grafana main menu, and can be added like any other core panel in Grafana.
To see a list of installed panels, click the Plugins item in the main menu. Both core panels and installed panels will appear.
Changelog
1.3.0
- Added support for Custom Control Lines to pull dynamic values from Feature Series, allowing more flexible histogram configurations.
- Added the ability to mark series as Feature Series and hide them from the histogram.
- Introduced support for a subgroupSize dashboard variable to control subgroup size across multiple SPC Histogram panels.
1.2.0
- Gaussian Curve Functionality: You can now add a Gaussian (normal distribution) curve to your histograms.
- Histogram Curve: A new option to plot a smoothed curve along your histogram for better data visualization.
- Bug Fixes: We've squashed a few bugs to improve overall performance.
- New Documentation: Check out the updated documentation