Plugins 〉Explore Profiles
Explore Profiles
Explore Profiles
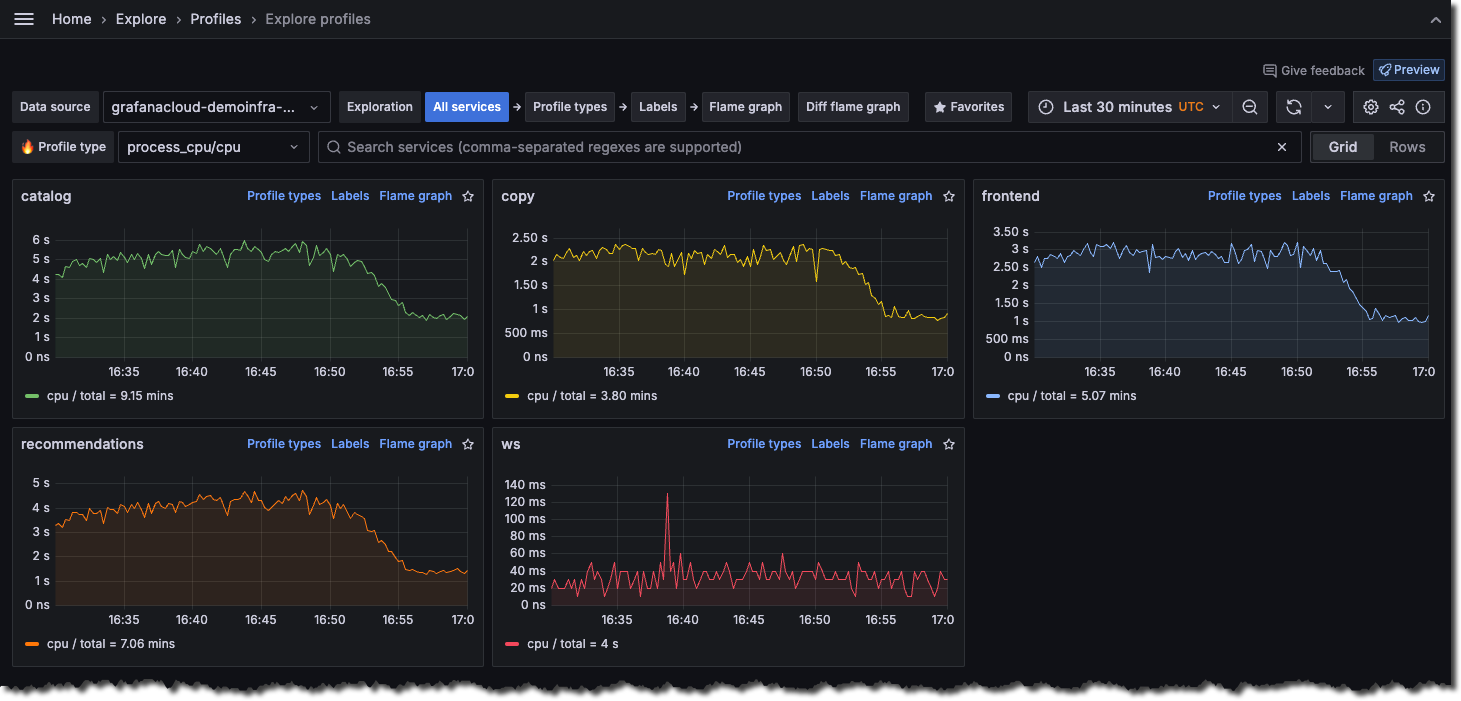
Explore Profiles is a native Grafana application designed to integrate seamlessly with Pyroscope, the open-source continuous profiling platform, providing a smooth, query-less experience for browsing and analyzing profiling data.
Key features include:
- Native integration with Pyroscope: Seamlessly integrates with Pyroscope backend to provide detailed performance profiling and analysis.
- Query-Less Browsing: Navigate profiling data without the need for complex queries.
- AI-Powered flame graph analysis: uses a large-language model (LLM) to assist with flame graph data interpretation so you can identify bottlenecks, and get to the bottom of performance issues faster.
Note: Explore Profiles is presently undergoing active development and is offered in a preview state. Subsequent updates are likely to incorporate significant changes that may impact existing functionality.

Before you begin
To use Explore Profiles with Grafana Cloud, you need:
- A Grafana Cloud account
- A Grafana stack in Grafana Cloud with a configured Pyroscope data source receiving profiling data
To use Explore Profiles with self-hosted Grafana open source or Grafana Enterprise, you need:
- Your own Grafana instance running 11.0 or newer
- Pyroscope 1.7 or newer
- A configured Pyroscope data source receiving profiling data
Getting started
Refer to the Explore Profiles documentation. For instructions installing, refer to the access and installation instructions.
Resources
Contributing
We love accepting contributions! If your change is minor, please feel free submit a pull request If your change is larger, or adds a feature, please file an issue beforehand so that we can discuss the change. You're welcome to file an implementation pull request immediately as well, although we generally lean towards discussing the change and then reviewing the implementation separately.
For more information, refer to Contributing to Grafana Explore Profiles
Bugs
If your issue is a bug, please open one here.
Changes
We do not have a formal proposal process for changes or feature requests. If you have a change you would like to see in Explore Profiles, please file an issue with the necessary details.
Grafana Cloud Free
- Free tier: Limited to 3 users
- Paid plans: $55 / user / month above included usage
- Access to all Enterprise Plugins
- Fully managed service (not available to self-manage)
Self-hosted Grafana Enterprise
- Access to all Enterprise plugins
- All Grafana Enterprise features
- Self-manage on your own infrastructure
Installing Explore Profiles on Grafana Cloud:
Installing plugins on a Grafana Cloud instance is a one-click install; same with updates. Cool, right?
Note that it could take up to 1 minute to see the plugin show up in your Grafana.
Installing plugins on a Grafana Cloud instance is a one-click install; same with updates. Cool, right?
Note that it could take up to 1 minute to see the plugin show up in your Grafana.
Installing plugins on a Grafana Cloud instance is a one-click install; same with updates. Cool, right?
Note that it could take up to 1 minute to see the plugin show up in your Grafana.
Installing plugins on a Grafana Cloud instance is a one-click install; same with updates. Cool, right?
Note that it could take up to 1 minute to see the plugin show up in your Grafana.
Installing plugins on a Grafana Cloud instance is a one-click install; same with updates. Cool, right?
Note that it could take up to 1 minute to see the plugin show up in your Grafana.
Installing plugins on a Grafana Cloud instance is a one-click install; same with updates. Cool, right?
Note that it could take up to 1 minute to see the plugin show up in your Grafana.
Installing plugins on a Grafana Cloud instance is a one-click install; same with updates. Cool, right?
Note that it could take up to 1 minute to see the plugin show up in your Grafana.
For more information, visit the docs on plugin installation.
Installing on a local Grafana:
For local instances, plugins are installed and updated via a simple CLI command. Plugins are not updated automatically, however you will be notified when updates are available right within your Grafana.
1. Install the Application
Use the grafana-cli tool to install Explore Profiles from the commandline:
grafana-cli plugins install The plugin will be installed into your grafana plugins directory; the default is /var/lib/grafana/plugins. More information on the cli tool.
Alternatively, you can manually download the .zip file for your architecture below and unpack it into your grafana plugins directory.
Alternatively, you can manually download the .zip file and unpack it into your grafana plugins directory.
2. Enable it
Next, log into your Grafana instance. Navigate to the Plugins section, found in your Grafana main menu.
Click the Apps tabs in the Plugins section and select the newly installed app.
To enable the app, click the Config tab. Follow the instructions provided with the application and click Enable. The app and any new UI pages are now accessible from within the main menu, as designed by the app creator.
If dashboards have been included with the application, they will attempt to be automatically installed. To view the dashboards, re-import or delete individual dashboards, click the Dashboards tab within the app page.
0.1.17 (2024-11-19)
Bug Fixes
- ServiceDropdown: Retrieve last used service name only if it's not provided in the URL (#284) (28ca16e)
0.1.16 (2024-11-14)
Bug Fixes
- QueryBuilder: Prevent invalid filters to be used after parsing (#276) (e6cac6e)
- Tracking: Ensure select action type is tracked (#278) (9527644)
- Tracking: Use custom reporter (#277) (dfbb3a6)
Features
- Export: Clarify that export to flamegraph.com option will create a public URL (#275) (c5a0962)
- Export: Disable export to flame graph.com (#280) (e631055)
0.1.15 (2024-11-05)
Bug Fixes
- DiffView: Clicking on "Auto-select" selects a 25% range (#254) (9b3dd8a)
- DiffView: Disable AI button when no selections (#258) (58e89cb)
- DiffView: Ensure ranges are initialized when landing (#233) (4f95549)
- DiffView: Fix headers wrap (#259) (6ada58a)
- DiffView: Fix incorrect preset label (#257) (a738694)
- ExplorationSelector: Fix background color (#255) (46db256)
- FunctionDetails: Correctly render blank lines (ec3ed5c)
- GitHubIntegration: Fix "Learn more" href (#245) (1848159)
- LabelValuesGrid: decrease column size to accommodate small screen resolutions (#235) (f62b17a)
- OnboardingModal: Change Grafana Agent to Grafana Alloy (#256) (27453ed)
- SettingsView: Fix back button after modifying the max nodes setting (#234) (673b44c)
- ShareableUrl: Fix when the default time range is selected (#244) (ae6ddeb)
- Small UI fixes (#248) (ee881fa)
- Timeseries: Persist scale when data changes (#251) (8cb6ced)
Features
- AppHeader: Revamp header (#230) (f482d7b)
- DiffFlameGraph: Add "how to" infos (#228) (494b659)
- DiffView: Add CTAs and comparison presets (#231) (e8bbf2e)
- LabelsView: Include/exclude panel actions (#210) (2c2d5f5)
- TimeSeries: Add menu with scale options (#249) (06b71d1)
0.1.14 (2024-10-17)
Bug Fixes
- Faro: Filter out events not related to the app (#225) (57a7c58)
- Header: Fix sticky header position in Grafana v11.3+ (#218) (a4f226f)
Features
0.1.13 (2024-10-08)
Features
0.1.12 (2024-10-04)
Bug Fixes
- Code: do not show Optimize Code button when no code is available (#208) (6af234d)
- Filters: ensure "is empty" filter is synced with URL (#205) (8fc8fc4)
- QueryBuilder: Filters with regex values can be edited in place (#207) (75de5e2)
Features
- Minor improvements (#211) (0486f33)
- QueryBuilder: Enable "in"/"not in" operators (#122) (9574828)
- StatsPanel: Add title on hover value + vertical border to separate compare actions (#212) (71a29e5)
0.1.11 (2024-09-30)
Features
- Minor UI improvements (timeseries point size, plugin info tooltip) (#194) (621982a)
- QuickFilter: Add results count (#193) (dc4012d)
0.1.10 (2024-09-25)
0.1.9 (2024-09-17)
Bug Fixes
- DiffFlameGraph: Remove non-working pprof export (#169) (662cd48)
- ExplainFlameGraph: Add tooltip when the LLM plugin is not installed (#163) (d395391)
- Faro: Fix Faro SDK config (#174) (3ed6362)
- Fix useUrlSearchParams (#171) (179b060)
- LabelsDataSource: Limit the maximum number of concurrent requests to fetch label values (#165) (cb8149c)
Features
- Add give feeback button and preview badge (#167) (a23fa61)
- AppHeader: Add Settings button (#172) (9d7fb6b)
- Remove legacy comparison views code (#143) (816363f)
- Upgrade Grafana to v11.2.0 (#173) (15680e6)
0.1.8 (2024-09-11)
Bug Fixes
Features
- Add histogram visualizations (#141) (2265be7)
- create new browser history entry on some user actions (#128) (5439ab3)
- DiffFlameGraph: Add flame graph range in timeseries legend (#140) (8729c31)
- GitHubIntegration: Migrate GitHub integration to Scenes (#142) (0386bbc)
- support submodules for GitHub Integration (#147) (52ecea8)
0.1.7 (2024-08-29)
Features
- Add histogram visualizations (#141) (2265be7)
- create new browser history entry on some user actions (#128) (5439ab3)
- DiffFlameGraph: Add flame graph range in timeseries legend (#140) (8729c31)
- GitHubIntegration: Migrate GitHub integration to Scenes (#142) (0386bbc)
0.1.6 (2024-08-27)
Bug Fixes
- Ci: Fix docker compose commands (#111) (4ee541a)
- DiffFlameGraph: Fix the "Explain Flame Graph" (AI) feature (#129) (a40c02b)
- Favorites: Render "No results" when there are no favorites (#101) (426469d)
- Labels: Fix "Discarded by user" error in the UI (#110) (2e9baab)
- SceneLabelValuePanel: Fix border color when baseline/comparison is selected (#123) (5b4058a)
- ScenesProfileExplorer: Make labels more responsive on smaller screens (10c97dc)
Features
- CompareView: Implement new Comparison view with Scenes (#119) (127d6c3)
- FlameGraph: Add missing export menu (#132) (f57b0ca)
- Labels: Improve comparison flow (#117) (31d0632)
- Timeseries: Add total resource consumption in legend (#108) (1fbb2df)
0.1.5 (2024-07-29)
Features
0.1.4 (2024-07-25)
Bug Fixes
- Onboarding: Handle gracefully when there's no data source configured (#76) (4c18444)
- PanelTitle: Remove series count when only 1 serie (#78) (8422e6d)
- SceneByVariableRepeaterGrid: Prevent extra renders (#86) (bf14755)
Features
- Avoid no data panels (#80) (72120b7)
- LabelsExploration: Introduce bar gauge visualisations (#72) (7b1b19a)
- SceneLabelValuesTimeseries: Colors and legends are preserved on expanded timeseries (#85) (6980299)
- Various enhancements after first UX interview (#81) (2cdfcbe)
0.1.3 (2024-07-19)
Bug Fixes
- Header: Switch the exploration type radio button group to a select on narrow screens (#70) (55f420a)
0.1.2 (2024-07-17)
Bug Fixes
- CompareAction: Add missing data source query parameter to compare URL (#58) (b1213e1)
- FunctionDetails: Get timeline state from Flame Graph component (#25) (64ed0e6)
- GitHub Integration: Correctly extract the start/end timestamps from time picker (#15) (fe8d807)
- SceneAllLabelValuesTableState: Fix color contrast in light mode (#26) (1bd268f)
- SceneByVariableRepeaterGrid: Set timeseries min to 0 (#31) (0e3a17d)
- SceneFlameGraph: Fix runtime error (#45) (6227f2d)
- SceneFlameGraph: Respect maxNodes when set in the URL (#29) (85dd5b7)
Features
- Analytics: Track Explore Profiles actions (#64) (ec58f57)
- DataSource: Store selected data source in local storage (#60) (9f7ede1)
- SingleView: Remove page (#20) (16da70d)
- Update plugin metadata to auto enable (#65) (3afd1cd)
- Various minor improvements (#46) (877b009)
0.1.0 (2024-07-15)
Explore Profiles is now available in its initial public release. It is designed to offer a seamless, query-less experience for browsing and analyzing profiling data.
Key features include:
- Native integration with Pyroscope: Seamlessly integrates with Pyroscope backend to provide detailed performance profiling and analysis.
- Query-Less Browsing: Navigate profiling data without the need for complex queries.
- AI-Powered flame graph analysis: uses a large-language model (LLM) to assist with flame graph data interpretation so you can identify bottlenecks, and get to the bottom of performance issues faster.
Bug Fixes
- GitHub Integration: Correctly extract the start/end timestamps from time picker (#15) (fe8d807)
- SceneAllLabelValuesTableState: Fix color contrast in light mode (#26) (1bd268f)
- SceneByVariableRepeaterGrid: Set timeseries min to 0 (#31) (0e3a17d)
- SceneFlameGraph: Fix runtime error (#45) (6227f2d)
- SceneFlameGraph: Respect maxNodes when set in the URL (#29) (85dd5b7)


