Plugins 〉Flux (InfluxDB) [BETA]
The Flux (InfluxDB) [BETA] plugin has been deprecated and is no longer maintained.
Flux (InfluxDB) [BETA]
InfluxDB (Flux) Datasource [BETA]
This plugin will work with InfluxDB 2.x and InfluxDB 1.8+
In a future grafana releases, this plugin will be incorporated into the main influx plugin and allow a single datasource to support flux queries or influxql (SQL style) queries.
Using
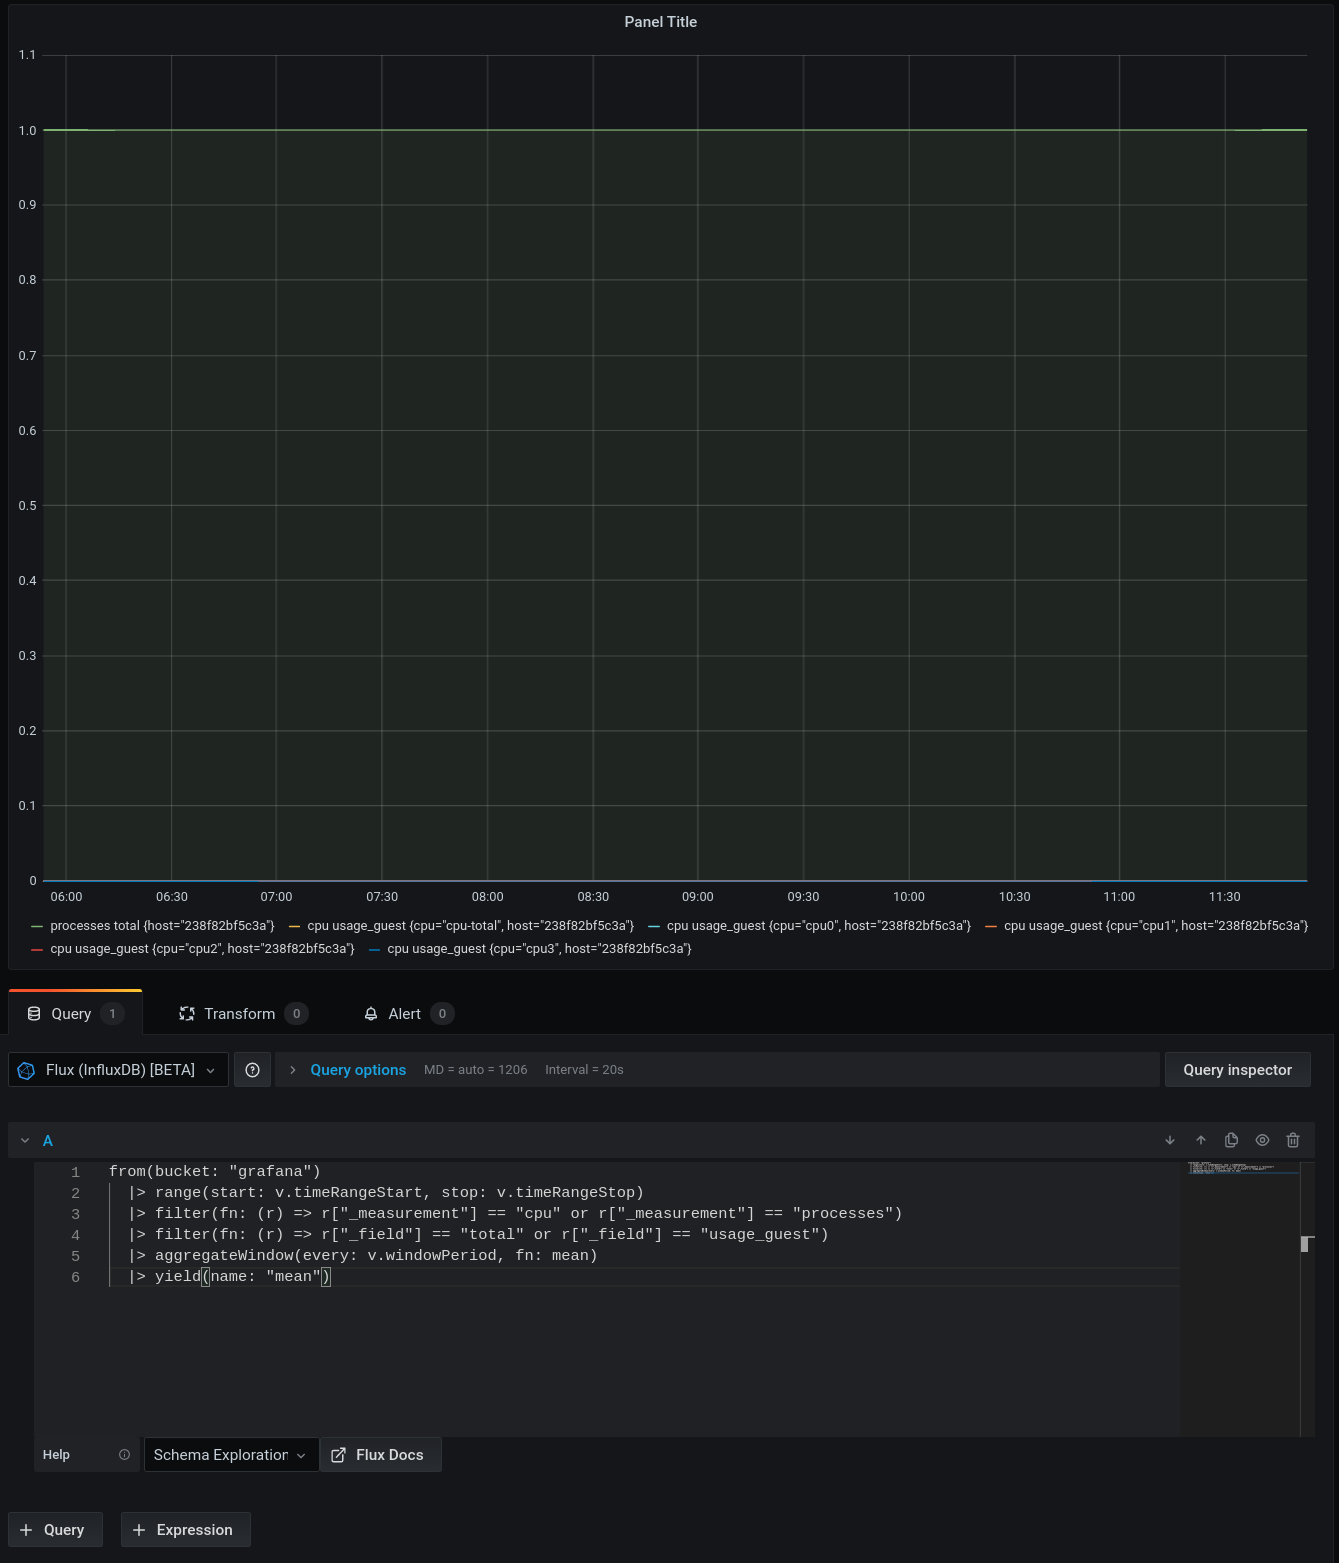
The plugin contains a monaco editor as the query editor which you can copy/paste flux queries into. For now, there are a number of flux queries templated in the query editor that you can use as examples.
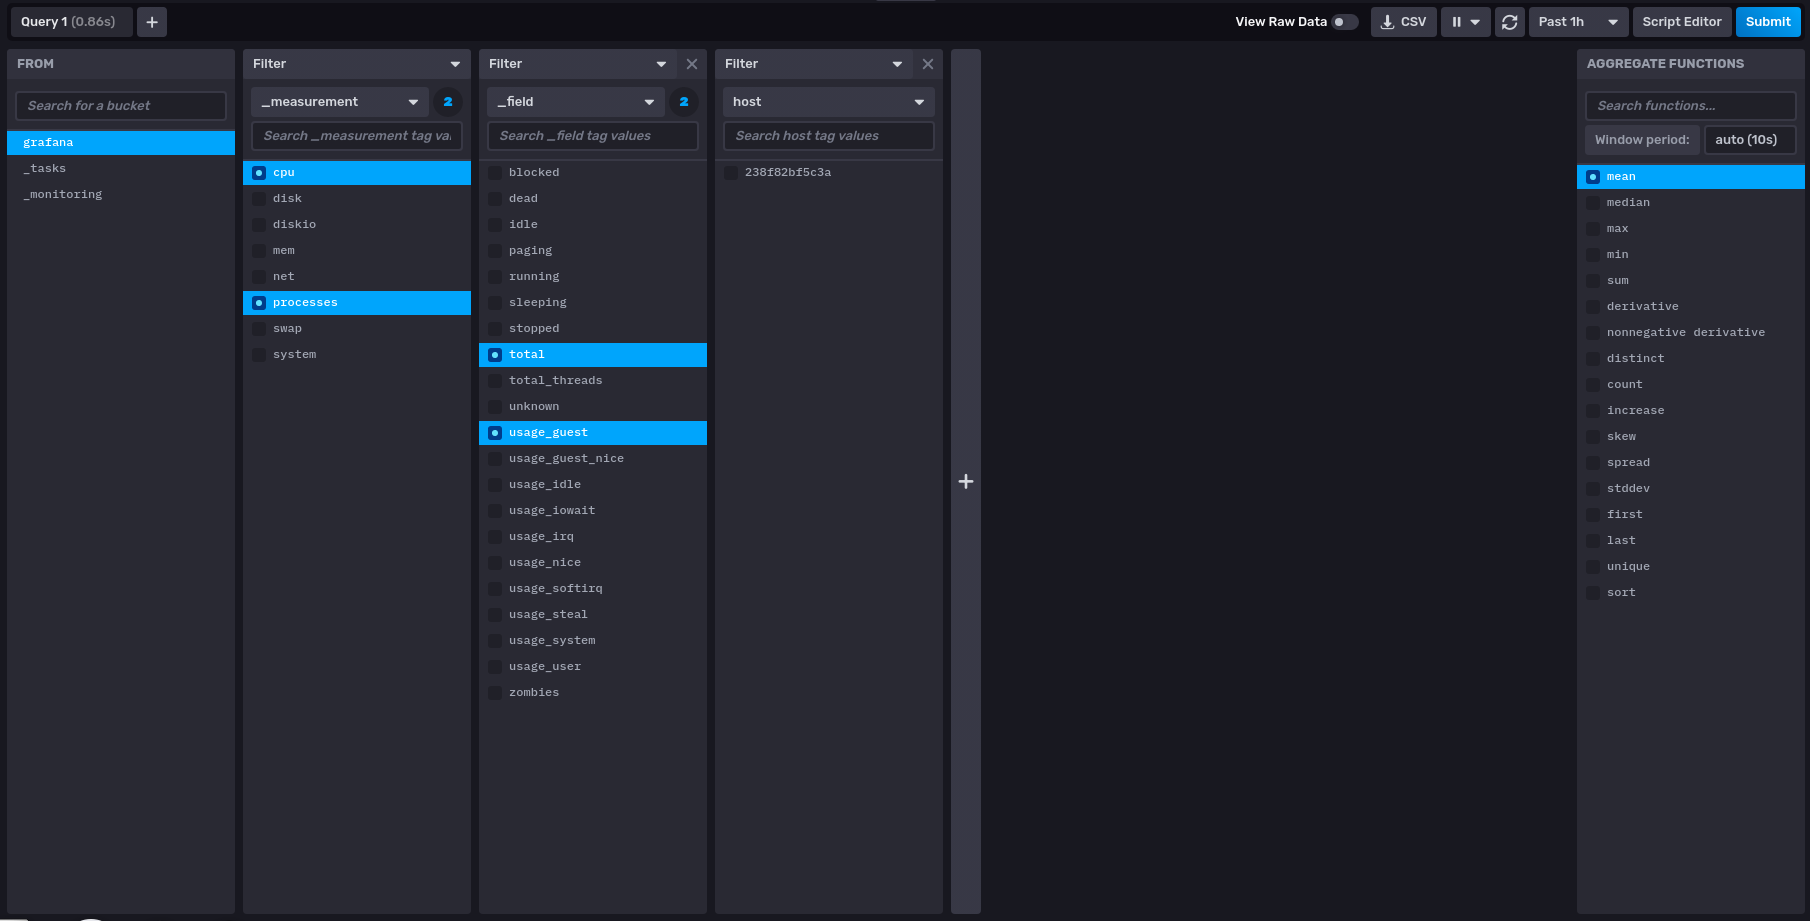
For a more graphical experience, your data explorer will be available at:
<url specified in config editor>/orgs/<org-id>/data-explorer
Finding your flux org id
In order to find the proper URL, you will ned to get your org-id. This can be done using a query similar to below:
https://influxdb.company.com:9999/api/v2/orgs
Embedded in this JSON response, you will find an array of all organizations, with two fields (shown below)
  "id": "059b46a59abab000",
  "name": "grafana",
Look for the name specified as your default bucket, and you can use the cooresponding id if the id field.
So, if I entered in the config editor, my url to influxdb as https://influxdb.company.com:9999, your data-explorer url would be https://influxdb.company.com:9999/orgs/059b46a59abab000/data-explorer.

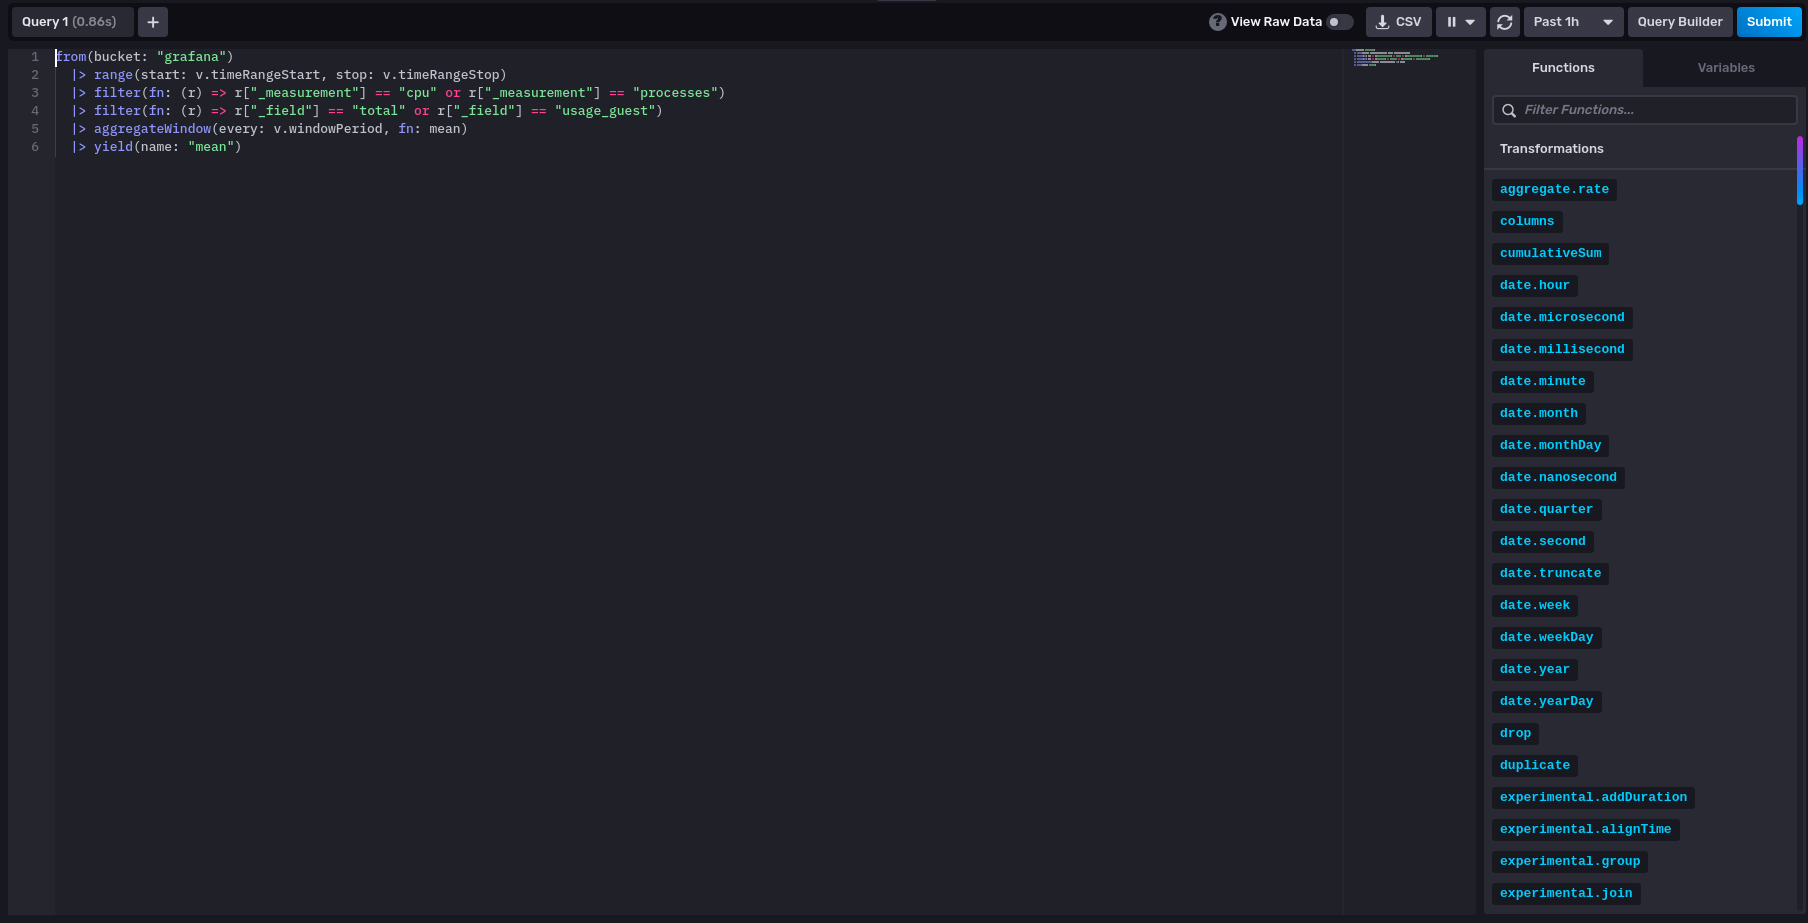
In the influx data explorer, you have a graphical query editor you may use. Hit the "Script Editor" button to go to flux langage mode, copy your request, and paste it into the influx query editor.


Grafana Cloud Free
- Free tier: Limited to 3 users
- Paid plans: $55 / user / month above included usage
- Access to all Enterprise Plugins
- Fully managed service (not available to self-manage)
Self-hosted Grafana Enterprise
- Access to all Enterprise plugins
- All Grafana Enterprise features
- Self-manage on your own infrastructure
Installing Flux (InfluxDB) [BETA] on Grafana Cloud:
Installing plugins on a Grafana Cloud instance is a one-click install; same with updates. Cool, right?
Note that it could take up to 1 minute to see the plugin show up in your Grafana.
Installing plugins on a Grafana Cloud instance is a one-click install; same with updates. Cool, right?
Note that it could take up to 1 minute to see the plugin show up in your Grafana.
Installing plugins on a Grafana Cloud instance is a one-click install; same with updates. Cool, right?
Note that it could take up to 1 minute to see the plugin show up in your Grafana.
Installing plugins on a Grafana Cloud instance is a one-click install; same with updates. Cool, right?
Note that it could take up to 1 minute to see the plugin show up in your Grafana.
Installing plugins on a Grafana Cloud instance is a one-click install; same with updates. Cool, right?
Note that it could take up to 1 minute to see the plugin show up in your Grafana.
Installing plugins on a Grafana Cloud instance is a one-click install; same with updates. Cool, right?
Note that it could take up to 1 minute to see the plugin show up in your Grafana.
Installing plugins on a Grafana Cloud instance is a one-click install; same with updates. Cool, right?
Note that it could take up to 1 minute to see the plugin show up in your Grafana.
For more information, visit the docs on plugin installation.
Installing on a local Grafana:
For local instances, plugins are installed and updated via a simple CLI command. Plugins are not updated automatically, however you will be notified when updates are available right within your Grafana.
1. Install the Data Source
Use the grafana-cli tool to install Flux (InfluxDB) [BETA] from the commandline:
grafana-cli plugins install The plugin will be installed into your grafana plugins directory; the default is /var/lib/grafana/plugins. More information on the cli tool.
Alternatively, you can manually download the .zip file for your architecture below and unpack it into your grafana plugins directory.
Alternatively, you can manually download the .zip file and unpack it into your grafana plugins directory.
2. Configure the Data Source
Accessed from the Grafana main menu, newly installed data sources can be added immediately within the Data Sources section.
Next, click the Add data source button in the upper right. The data source will be available for selection in the Type select box.
To see a list of installed data sources, click the Plugins item in the main menu. Both core data sources and installed data sources will appear.
Change Log
[7.0.0] - 2020-05-17
- Migrated to grafana backend plugin
- Signed for grafana 7.x
- Optimized for copy/paste from influxdb 2.0 data explorer. Create more complex queries in data explorer, and copy them into the flux query editor.
[5.4.1] - 2019-10-28
- Query editor bugfixes
[5.4.0] - 2019-10-09
- Slate fixes for Grafana 6.4.x
- Fix for queries which group by time, and return _start and _stop rather than _time
NOTE: This version is only compatible with Grafana v6.4+
[5.3.2] - 2019-07-07
- Fix for range error when expanding suggestion #39
[5.3.0] - 2019-06-11
- Update packages
- Add circleci publishing
- Add support for Influx V2.0 Alpha Server


