Plugins 〉Dynatrace
Dynatrace
Instantly visualize Dynatrace data in Grafana
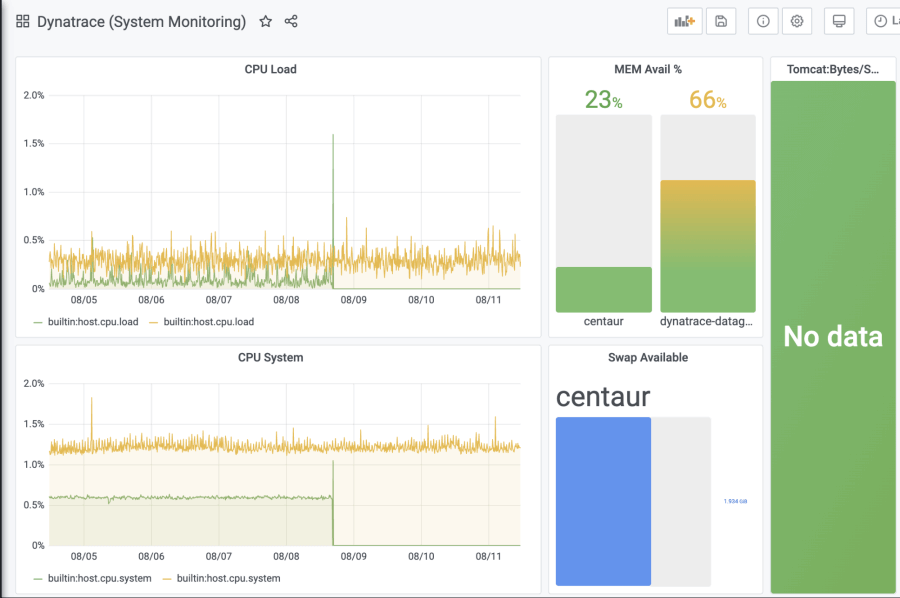
The Dynatrace data source plugin is the easiest way to pull Dynatrace data directly into Grafana dashboards.
- Visualize it either in isolation (one database) or blend it with other data sources.
- Discover correlations and covariances across all your data in minutes.
Grafana Cloud Free
- Free tier: Limited to 3 users
- Paid plans: $55 / user / month above included usage
- Access to all Enterprise Plugins
- Fully managed service (not available to self-manage)
Self-hosted Grafana Enterprise
- Access to all Enterprise plugins
- All Grafana Enterprise features
- Self-manage on your own infrastructure
Installing Dynatrace on Grafana Cloud:
Installing plugins on a Grafana Cloud instance is a one-click install; same with updates. Cool, right?
Note that it could take up to 1 minute to see the plugin show up in your Grafana.
Installing plugins on a Grafana Cloud instance is a one-click install; same with updates. Cool, right?
Note that it could take up to 1 minute to see the plugin show up in your Grafana.
Installing plugins on a Grafana Cloud instance is a one-click install; same with updates. Cool, right?
Note that it could take up to 1 minute to see the plugin show up in your Grafana.
Installing plugins on a Grafana Cloud instance is a one-click install; same with updates. Cool, right?
Note that it could take up to 1 minute to see the plugin show up in your Grafana.
Installing plugins on a Grafana Cloud instance is a one-click install; same with updates. Cool, right?
Note that it could take up to 1 minute to see the plugin show up in your Grafana.
Installing plugins on a Grafana Cloud instance is a one-click install; same with updates. Cool, right?
Note that it could take up to 1 minute to see the plugin show up in your Grafana.
Installing plugins on a Grafana Cloud instance is a one-click install; same with updates. Cool, right?
Note that it could take up to 1 minute to see the plugin show up in your Grafana.
For more information, visit the docs on plugin installation.
Installing on a local Grafana:
For local instances, plugins are installed and updated via a simple CLI command. Plugins are not updated automatically, however you will be notified when updates are available right within your Grafana.
1. Install the Data Source
Use the grafana-cli tool to install Dynatrace from the commandline:
grafana-cli plugins install The plugin will be installed into your grafana plugins directory; the default is /var/lib/grafana/plugins. More information on the cli tool.
Alternatively, you can manually download the .zip file for your architecture below and unpack it into your grafana plugins directory.
Alternatively, you can manually download the .zip file and unpack it into your grafana plugins directory.
2. Configure the Data Source
Accessed from the Grafana main menu, newly installed data sources can be added immediately within the Data Sources section.
Next, click the Add data source button in the upper right. The data source will be available for selection in the Type select box.
To see a list of installed data sources, click the Plugins item in the main menu. Both core data sources and installed data sources will appear.
Change Log
v3.21.4 - 2025-01-10
- ⚙️ Chore: Update backend dependencies
v3.21.3 - 2025-01-09
- ⚙️ Chore: backend dependencies compiled with latest go version
v3.21.2 - 2024-12-18
- ⚙️ Chore: Update backend dependencies
v3.21.1 - 2024-12-16
- ⚙️ Chore: Update backend dependencies
v3.21.0 - 2024-11-29
- 🚀 Feature: Add Timeout configuration for Http client to UI
v3.20.0 - 2024-11-28
- ⚙️ Chore: Bump backend dependencies
v3.19.7 - 2024-11-25
- ⚙️ Chore: Fix error source for loading cache errors
v3.19.6 - 2024-11-22
- ⚙️ Chore: Improve error handling
v3.19.5 - 2024-11-21
- ⚙️ Chore: Improve error handling
v3.19.4 - 2024-11-20
- 🐛 Chore: Improve error handling
v3.19.3 - 2024-11-12
- ⚙️ Chore: Updated backend dependencies
v3.19.2 - 2024-10-30
- ⚙️ Chore: migrate config editor page to use
@grafana/uicomponents
v3.19.1 - 2024-10-29
- 🐛 Fix: Fill null value when timeseries data is missing
v3.19.0 - 2024-10-28
- 🐛 Fix: Move query cache for Metric Dimensions onto Datasource instance from global scope
v3.18.7 - 2024-10-03
- ⚙️ Chore: Update frontend dependencies
- ⚙️ Chore: Minimal supported Grafana version is now
10.4.8
v3.18.6 - 2024-09-23
- ⚙️ Chore: Update backend dependencies
v3.18.5 - 2024-09-06
- 🐛 Fix: Fix error when management zone is not filled in
v3.18.4 - 2024-08-30
- ⚙️ Chore: update backend dependencies
v3.18.3 - 2024-08-23
- 🐛 Fix: Fix query options in alert setting
v3.18.2 - 2024-08-16
- 🐛 Fix: Fix timeout issue in healthcheck in config page
v3.18.1 - 2024-08-02
- 🐛 Fix: Support dashboard variable in metrics query in code mode
v3.18.0 - 2024-07-10
- 🐛 Fix: Fix supporting variables in management zones
v3.17.0 - 2024-06-27
- ⚙️ Chore: Added SLO metrics to the plugin
v3.16.0 - 2024-06-27
- 🚀 Feature: Support dashboard variable in management zone select
v3.15.0 - 2024-06-27
- 🚀 Feature: Support management zone both in builder and code mode for Metric Query
v3.14.8 - 2024-06-24
- 🚀 Feature: Support Alias in code mode in Metric Query
v3.14.7 - 2024-06-21
- ⚙️ Chore: update sdk license check
v3.14.6 - 2024-06-20
- 🐛 Fix: fix pagination
v3.14.5 - 2024-06-18
- 🚀 Feature: Support Problems V2, Events, Synthetic, Tokens Queries
v3.14.4 - 2024-06-13
- 🚀 Feature: Support SLO API query
v3.14.3 - 2024-06-06
- ⚙️ Chore: update dependencies
v3.14.2 - 2024-05-22
- 🚀 Feature: Support Nullable in Parse Individual Fields in Direct API Query
v3.14.1 - 2024-03-13
- ⚙️ Chore: Backend binaries are now compiled with Go version
1.22.1
v3.14.0 - 2024-03-01
- ⚙️ Chore: update dependencies
v3.13.0 - 2024-02-27
- ⚙️ Chore: Add error source for returned responses
v3.12.1 - 2023-11-23
- 🐛 Fix: fixes an issue when querying data in safari
v3.12.0 - 2023-11-09
- ⚙️ Chore: Update backend and frontend dependencies
- ⚙️ Chore: Minimal supported Grafana version is now
9.5.13
v3.11.3 - 2023-09-13
- 🐛 Fix: use labels in code editor mode in variable editor
v3.11.2 - 2023-09-12
- ⚙️ Chore: migrate to create-plugin
v3.11.1 - 2023-08-11
- 🐛 Fix: fix annotation editor for query type - problem
v3.11.0 - 2023-07-19
- 🚀 Variable editor Added support for
textandvaluepair when raw url query type used in variable editor query - ⚙️ Chore Grafana enterprise SDK updated to latest
v3.10.2 - 2023-06-08
- ⚙️ Chore: backend libs updated with golang:1.20.5
v3.10.1 - 2023-06-01
- ⚙️ Chore: update plugin sdk go version
v3.10.0 - 2023-05-10
- 🚀 Feature: Secure socks proxy support added
v3.9.2 - 2023-05-03
- ⚙️ Chore: Backend binaries are now compiled with golang 1.20.4
v3.9.1 - 2023-04-19
- ⚙️ Chore: Backend binaries are now compiled with golang 1.20.3
v3.9.0 - 2023-02-28
- ⚙️ Chore: Removed legacy AngularJS dependencies
- ⚙️ Chore: Backend binaries are now compiled with Go 1.19.6
v3.8.1 - 2022-02-16
- 🐛 Fix: Alias tooltip hanging/blocking
v3.8.0 - 2022-01-10
- 🚀 Feature: (Enhancement) Faster Metric Selector using less memory
v3.7.2 - 2022-12-02
- 🐛 Fix: Apply Management zone filter on Entity query
v3.7.1 - 2022-12-13
- ⚙️ Chore: Backend binaries are now compiled with Go 1.19.4
- ⚙️ Chore: Grafana enterprise SDK updated to latest to fix licensing issues
- ⚙️ Chore: Grafana backend plugin SDK updated to v0.145.0
- ⚙️ Chore: Backend third party dependencies updated
v3.7.0 - 2022-12-02
- 🚀 Feature: Management zone filter on Metrics query
v3.6.0 - 2022-12-02
- 🚀 Feature: Added management zone queries
v3.5.5 - 2022-11-25
- 🐛 Fix: Fixed a bug in variable queries where results weren't showing when using direct api access query type
v3.5.4 - 2022-11-03
- ⚙️ Chore: Backend binaries compiled with latest go version 1.19.3
v3.5.3 - 2022-10-25
- 🐛 Fix: Fixed an issue where the direct API access in variable results produce inconsistent results.
- ⚙️ Chore: Backend binaries compiled with latest go version 1.19.2
v3.5.2 - 2022-09-20
- 🐛 Fix: Fixed a bug where direct api access throws error when response contains null value
- 🐛 Fix: Fixed a bug where query editor doesn't show query when using metrics raw query
- 🐛 Fix: Fixed a bug where dynatrace alerting throws
coarser resolutionerror due to incorrect interval resolution
v3.5.1 - 2022-09-16
- 🐛 Fix: Fixed an issue with the json editor in the query editor for direct api access
v3.5.0 - 2022-09-06
- 🚀 Feature: Support for querying Logs from DynaTrace (beta)
- 🚀 Feature: Support for querying Audit Logs
- 🚀 Feature: Addition of variable query editor
v3.4.4 - 2022-07-28
- Made alias templating fully configurable with template variables in the metric builder editor
v3.4.3 - 2022-07-08
- 🐛 Fix: Fixed a bug where filters data is getting saved in the dashboard json unnecessarily which causes increase in dashboard json size
v3.4.2 - 2022-05-18
- 🐛 Fix: Fixed a bug where dynatrace queries stopped working with error
error loading cache(MetricDefaultAggregation un-marshal error)
v3.4.1 - 2022-03-24
- New builds with go 1.18 to address CVE-2022-24921
v3.4.0 - 2022-03-21
- 🚀 Feature: (Config) Allow Skip TLS verify
- 🚀 Feature: (Config) Allow uploading custom CA certs
- ⚙️ Chore: Support for enabling the HTTP logger debugging tool
v3.3.4 - 2022-03-14
- Direct API: Removed limitation of only 5 json fields
- Direct API: Updated JSON path parser to solve inconsistencies in json path implementations
- Problems: Variable and tag filtering for problems queries
v3.3.3 - 2022-02-11
- Metrics: Fixed an issue where filter values are not loaded for some type of entities
- Metrics: Fixed an issue where dimensions were incorrectly mapped in the metrics alias
- Metrics: Fixed an issue where the query fails to run when directly into code editor
- USQL: Fixed an issue where the wild card queries like
select * from foodoesn't work in some cases earlier - USQL: Query inspector now shows the corresponding API query sent
- ⚙️ Chore: Fixed an issue in variables editor where the queries doesn't show values for first time
v3.3.2 - 2021-12-06
- ⚙️ Chore: Enterprise license check update
v3.3.1 - 2021-12-06
- 🐛 Fix: Management zones are not resolved correctly
- 📝 Documentation: Updated docs to reflect new query editor options
- 📝 Documentation: Added more detail around provisioning
- 📝 Documentation: Added screenshots
v3.3.0 - 2021-11-12
- 🚀 Feature: Implemented USQL searches
- 🚀 Feature: Implemented raw api queries
- 🚀 Feature: Implemented raw metric selector access
- 🐛 Fix: Fixed a bug where datasource doesn't return data in mixed mode
- 🚀 Feature: Added annotation support
v3.2.4 - 2021-07-28
- Fixed transformations. The query editor will migrate queries when first opened. If not opened
there is no difference in query behavior. The migration is done so that the
:namestransformation can be removed, if the merge transformation is required.
v3.2.3 - 2021-07-21
- 🚀 Feature: You will find entities under a separate heading or "options container" in the filters
- 🚀 Feature: Configure dynatrace by URL
- 🐛 Fix: Fixed issue with aggregations, including the percentile aggregation
v3.2.2 - 2021-05-27
- Updated CHANGELOG
v3.2.1 - 2021-05-27
- Error with multi tags filters
- After upgrade, Dynatrace panels throw 400 error "no metrics found using Metric ID"
- Tags filters not working
- Dynatrace health check sometimes consuming a LOT of memory
- Invalid API token returns unhelpful error message
- Invalid domain returns unhelpful error message
- Invalid Environment ID returns unhelpful error message
- Update Dynatrace Documentation
- Synthetic monitor selection in adhoc template variable results in error
- enabling Expanded details on problem queries has not effect = no additional details
v3.2.0 - 2021-04-26
- 🚀 Feature: Only metric names or ad hoc query variables supported for Dynatrace
- 🐛 Fix: Queries can not be reused between panels
v3.1.4 - 2021-04-12
- ⚙️ Chore: Update SDK
- Enabling Expanded details on problem queries has not effect = no additional details
- Disabling of queries not respected
- Percentile aggregation error reading
- Template variables are not supported in problems queries
- Splitting out problems over multiple dimensions
- Synthetic monitor selection in adhoc template variable results in error
v3.1.2 - 2021-03-05
- Series name is using the internal dynatrace ID's in the table view
- Error code 400 message "unexpected colon expecting key package component or namespace, consider adding a preceding tilde if the token is meant literally"
v3.1.1 - 2021-02-10
- Empty filter value drop down when selecting new metric from the dashboard variable drop down
- 🐛 Fix: Fix to filter out dimensions that are not entities
- Fetching entities should only be done on type = ENTITY
- 🐛 Fix: Cannot read property 'transformations' of undefined error when closing panel options
- Empty filter value drop down when selecting new metric from the dashboard variable drop down
v3.1.0 - 2020-11-10
- 🚀 Feature: Problems API support
- 🚀 Feature: Support merge transformations
- 🚀 Feature: Support tag filtering in the v2 metrics API
- 🐛 Fix: Query with filters stop working when upgrading from 2.1.1 to 3.0.2
- 🐛 Fix: Can't import the datasource dashboard
- 🐛 Fix: Images not loading in the plugin readme
v3.0.2 - 2020-09-09
- 🐛 Fix: Fix for missing filter options (timeseries limit of 1000).
- Use entities api to get filter key/values instead of metric/query results.
v3.0.1 - 2020-08-03
- Query Migration updated to handle filter groups and values
- 🐛 Fix: Fix for missing data
- 🐛 Fix: Fix filter options
- 🐛 Fix: Fix single value issue
- 🐛 Fix: Fix for dimension iteration
- 🐛 Fix: Fix using name as value for template label
- 🐛 Fix: Fix for Alias Regex matching
- Update to backend HealthCheck
v3.0.0 - 2020-07-09
- Full alerting support
- Migration to backend plugin
- Carryover of new features from 2.0.x
- Ad-hoc filter support
- More readable filter/dimension names
- Bug fixes: Aliases are not working & persisted
- Bug fixes: Host-ID -> how to get a more human readable name from the API
- Bug fixes: V2 API depreciation messages observed during demo in network inspector
v2.0.0 - 2020-04-10
- V2 metrics api support
- Support for synthetic tags
- Support for monitoring VMware ESXi
- Performance improvements (subject to delay pending):
- The amount of data requested
- The bandwidth/latency of the internet/data connection
- Support for custom metrics
- Full templating support for metrics
- Full templating support for aliases
- Fully backwards compatible with previous dashboards
- Requires Grafana 6.5 and up.
v0.9.3 - 2019-09-26
- Implement alpha metric names api
- Fixed tag query manager to pull tags based on source type
v0.9.2 - 2019-08-13
- 🐛 Fix: Tag Query Editor bugs
- Update packages
v0.9.1 - 2019-08-06
- Add migration for old tag format to new (fixes breaking change noted in 0.7.0)
- 🐛 Fix: Fix tag queries for custom/auto and manual tags
- Update packages
v0.9.0 - 2019-07-15
- refactor and fix filter editor
- add migration method for dashboards using old format (0.5.3 and earlier) (Issue #21)
v0.8.0 - 2019-06-07
- 🐛 Fix: Fix for saving template variables in tags
v0.7.0 - 2019-05-16
- BREAKING CHANGE: This release includes a breaking change for TAGS. Any queries that leverage tags will need to be updated manually.
- Bugfixes and Feature additions
- Updated packages
- Updated circleci
v0.6.0 - 2019-05-09
- Template variables support
- Ad hoc filters support
- Tags support
- Able to select metrics by ID or by name
- Query model was changed, panels may be broken
v0.5.3 - 2019-03-29
- Use plugin routes for secure authentication
- Able to configure SaaS or Management environments
- Cache sources query
- Metrics without aggregation is not supported
v0.5.2 - 2019-03-23
- Percentile support
- Cannot do percentile aggregations
v0.5.0 - 2019-02-19
- Regex filtering support
- Bug when no filter specified
- Use ID instead of Display Name to avoid duplicates


