Plugins 〉Discourse Datasource
Discourse Datasource
WARNING: Breaking Change in version 2.0
In Version 2.0.0, we replaced the aging configuration UI with a newer, more extensible version. These V2-style configurations will allow much finer control over networking details. V1-style configurations, unfortunately, must be re-entered using the new UI.
Grafana Discourse data source
The Discourse data source plugin allows users to search and view topics, posts, users, tags, categories, and reports on a given Discourse forum. It uses 5 different queries; 3 are public while 2 require an API key:
Reports
requires an API key
grants access to the 40+ reports available to Discourse Admins
Users
requires an API key but only when searching
staff. Otherwise, public.returns top users
Tags (Overview)
public
returns general data for all tags
Tag (Detailed)
public
drills down into details and posts related to a specific tag
Search
public
a near-complete replica of the Discourse expanded search UI (like this one)
In other words, you can connect this plugin to any public Discourse forum and query everything except the reporting and staff users features. With an API key, you can access these last two.
Demo
Demo dashboard for Topics and Replies
The dashboard above is used to track some statistics for the hosted Discourse website for Grafana.
Configuring the Data Source WITHOUT an API Key
- Find the
HTTPsection in the plugin's configuration editor. For theURLinput box, enter the URL for your Discourse instance or another public Discourse instance. For example,https://community.grafana.com/, orhttps://meta.discourse.org/

- press
Test and Save
Configuring the Data Source WITH an API Key
Create an API key in hosted Discourse
- Navigate to the Admin -> API -> Keys section and click on the New API Key button.
- Fill in a description for the new key.
- Choose the User Level - either
All Usersor a specific single user. - Check the
Global Key (allow all actions)option to get the permissions needed to access admin reports. - Save the key and copy it to your clipboard
Add the API key and Username to the Discourse Configuration
- Scroll down to the
Custom HTTP Headerssection of the plugin configuration page. - Click
Add header - Enter
Api-Keyand then paste your new API key as thevalue. (NOTE:Api-Keyis case sensitive) - Click
Add headeragain. - Enter
Api-Usernameand then enter the username associated with your API Key OR entersystemif you chose theAll Usersoption for theUser Level.

- Scroll down to the
Click
Test and SaveCreate a new panel, add the datasource, and verify that the
Reportsfeature works.
Creating Queries
There are five types of queries - Reports, Users, Tags, Tag, and Search. The ability to do queries is limited but using the Transformations feature, you can manipulate or do maths on the returned data to do more powerful queries.
Report queries
The report queries are the reports that are available in the admin section in Discourse. For the example, the Topics report: https://community.xxx.com/admin/reports/topics?end_date=2020-08-03&start_date=2020-07-03
Using Grafana you can combine multiple reports in one panel, which you cannot do in Discourse. The included dashboard uses the Topics report and the Topics with no reply report to visualize how many topics are getting replies in one panel.
User queries
There are two user queries - the Top Public Users query and the Staff query. This return statistics on individual users in a table format.
Tags (General) queries
This query returns general statistics for every tag in a discourse instance
Tag (Specific) queries
This query allows you to drill down into a specific tag. It will return topics that include the chosen tag in a table format.
Search queries
This query allows you to perform expanded searches into Discourse, exactly like you can using the internal search feature. You can search topics, posts, tags, and users. The topics & posts query includes many optional parameters, just like Discourse's internal expanded search.
An Example of Using Transformations
The statistics for topics from the Grafana Community site is a more advanced example of what you can do with transformations.
The goal is to take two queries, total the results over a time period and then subtract one from the other and we will use the transformations feature in Grafana to achieve this.
Start with two queries - Topics and Topics with no replies and choose the Stat visualization. In the Panel options, change the
CalculationtoTotaland change theOrientationtoHorizontal.Switch to the transformations tab and add two
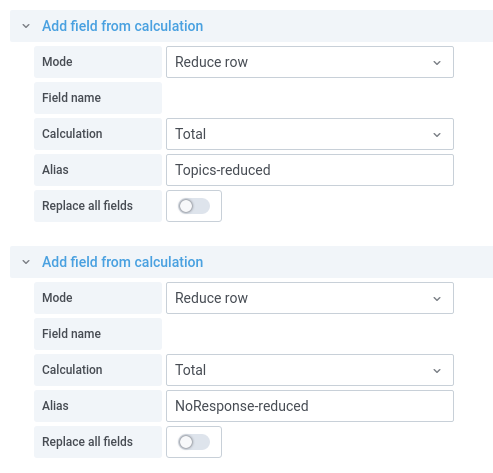
Add field from calculationtransformations and reduce the two fields,TopicsandTopics with no replies. We do this in case we have any gaps in the data to avoid NaN errors. Use theReduce rowmode and choose theTotalcalculation. Choose an appropriate alias for each. You should now see four stats, the two original fields and the two reduced fields.
Add a third
Add field from calculationtransformation and chooseBinary operationasMode. For the maths operation, choose your two reduced fields and the minus operation.
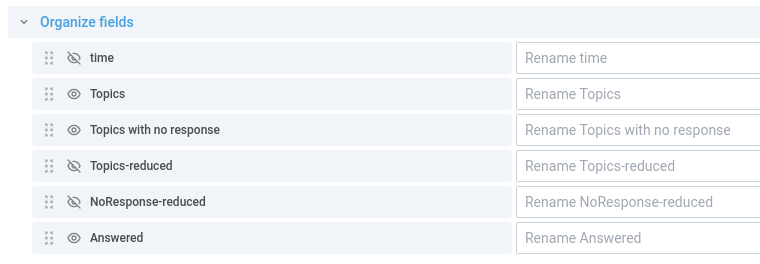
Now you should have five stats and we only want to show three and hide the calculated fields. Hide the fields you don't want to show by adding a
Organize fieldstransformation.
Grafana Cloud Free
- Free tier: Limited to 3 users
- Paid plans: $55 / user / month above included usage
- Access to all Enterprise Plugins
- Fully managed service (not available to self-manage)
Self-hosted Grafana Enterprise
- Access to all Enterprise plugins
- All Grafana Enterprise features
- Self-manage on your own infrastructure
Installing Discourse Datasource on Grafana Cloud:
Installing plugins on a Grafana Cloud instance is a one-click install; same with updates. Cool, right?
Note that it could take up to 1 minute to see the plugin show up in your Grafana.
Installing plugins on a Grafana Cloud instance is a one-click install; same with updates. Cool, right?
Note that it could take up to 1 minute to see the plugin show up in your Grafana.
Installing plugins on a Grafana Cloud instance is a one-click install; same with updates. Cool, right?
Note that it could take up to 1 minute to see the plugin show up in your Grafana.
Installing plugins on a Grafana Cloud instance is a one-click install; same with updates. Cool, right?
Note that it could take up to 1 minute to see the plugin show up in your Grafana.
Installing plugins on a Grafana Cloud instance is a one-click install; same with updates. Cool, right?
Note that it could take up to 1 minute to see the plugin show up in your Grafana.
Installing plugins on a Grafana Cloud instance is a one-click install; same with updates. Cool, right?
Note that it could take up to 1 minute to see the plugin show up in your Grafana.
Installing plugins on a Grafana Cloud instance is a one-click install; same with updates. Cool, right?
Note that it could take up to 1 minute to see the plugin show up in your Grafana.
For more information, visit the docs on plugin installation.
Installing on a local Grafana:
For local instances, plugins are installed and updated via a simple CLI command. Plugins are not updated automatically, however you will be notified when updates are available right within your Grafana.
1. Install the Data Source
Use the grafana-cli tool to install Discourse Datasource from the commandline:
grafana-cli plugins install The plugin will be installed into your grafana plugins directory; the default is /var/lib/grafana/plugins. More information on the cli tool.
Alternatively, you can manually download the .zip file for your architecture below and unpack it into your grafana plugins directory.
Alternatively, you can manually download the .zip file and unpack it into your grafana plugins directory.
2. Configure the Data Source
Accessed from the Grafana main menu, newly installed data sources can be added immediately within the Data Sources section.
Next, click the Add data source button in the upper right. The data source will be available for selection in the Type select box.
To see a list of installed data sources, click the Plugins item in the main menu. Both core data sources and installed data sources will appear.
Changelog
2.0.2
Signed release, see README about new UI and features
2.0.1
Not released
2.0.0
Not released
1.1.0
- Adds filtering for top level categories for report queries that enables getting metrics for a specific top-level category. #4
1.0.0
The initial version of the data source.
- Support for hosted Discourse only
- Support for Reports and User queries


