Plugins 〉Datadog
Datadog
Instantly visualize Datadog data in Grafana
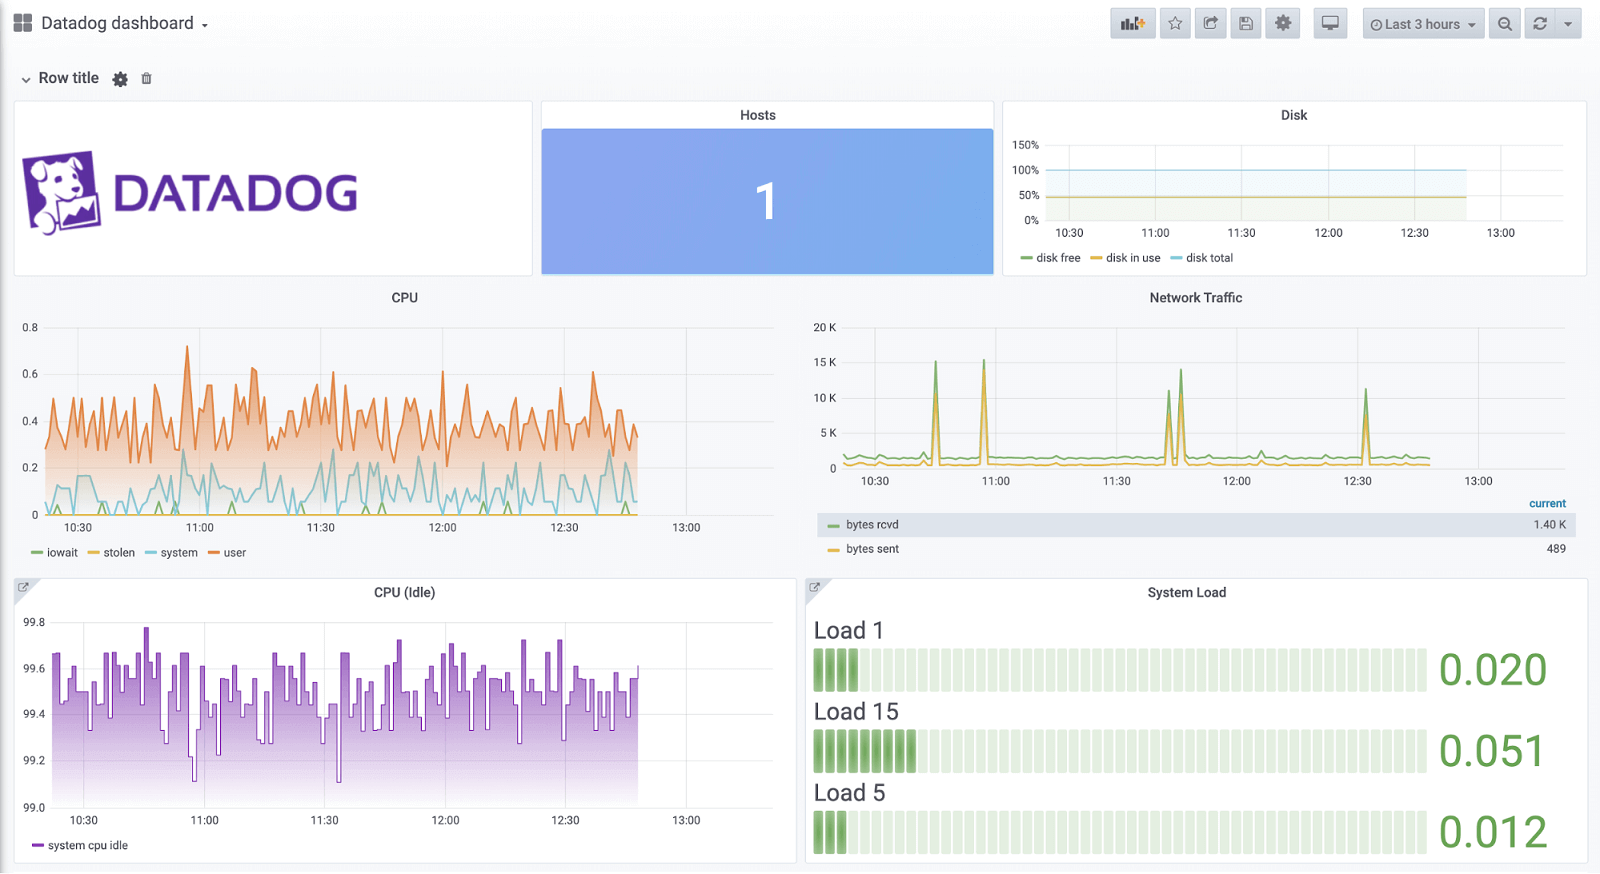
The Datadog data source plugin is the easiest way to pull Datadog data directly into Grafana dashboards.
- Visualize it either in isolation (one database) or blend it with other data sources.
- Discover correlations and covariances across all your data in minutes.
Grafana Cloud Free
- Free tier: Limited to 3 users
- Paid plans: $55 / user / month above included usage
- Access to all Enterprise Plugins
- Fully managed service (not available to self-manage)
Self-hosted Grafana Enterprise
- Access to all Enterprise plugins
- All Grafana Enterprise features
- Self-manage on your own infrastructure
Grafana Cloud Free
.h4 . .mb-0 }
- Free tier: Limited to 3 users
- Paid plans: $55 / user / month above included usage
- Access to all Enterprise Plugins
- Fully managed service (not available to self-manage)
Self-hosted Grafana Enterprise
- Access to all Enterprise plugins
- All Grafana Enterprise features
- Self-manage on your own infrastructure
Grafana Cloud Free
- Free tier: Limited to 3 users
- Paid plans: $55 / user / month above included usage
- Access to all Enterprise Plugins
- Fully managed service (not available to self-manage)
Self-hosted Grafana Enterprise
- Access to all Enterprise plugins
- All Grafana Enterprise features
- Self-manage on your own infrastructure
Installing Datadog on Grafana Cloud:
Installing plugins on a Grafana Cloud instance is a one-click install; same with updates. Cool, right?
Note that it could take up to 1 minute to see the plugin show up in your Grafana.
Installing plugins on a Grafana Cloud instance is a one-click install; same with updates. Cool, right?
Note that it could take up to 1 minute to see the plugin show up in your Grafana.
Installing plugins on a Grafana Cloud instance is a one-click install; same with updates. Cool, right?
Note that it could take up to 1 minute to see the plugin show up in your Grafana.
Installing plugins on a Grafana Cloud instance is a one-click install; same with updates. Cool, right?
Note that it could take up to 1 minute to see the plugin show up in your Grafana.
Installing plugins on a Grafana Cloud instance is a one-click install; same with updates. Cool, right?
Note that it could take up to 1 minute to see the plugin show up in your Grafana.
Installing plugins on a Grafana Cloud instance is a one-click install; same with updates. Cool, right?
Note that it could take up to 1 minute to see the plugin show up in your Grafana.
Installing plugins on a Grafana Cloud instance is a one-click install; same with updates. Cool, right?
Note that it could take up to 1 minute to see the plugin show up in your Grafana.
For more information, visit the docs on plugin installation.
Installing on a local Grafana:
For local instances, plugins are installed and updated via a simple CLI command. Plugins are not updated automatically, however you will be notified when updates are available right within your Grafana.
1. Install the Data Source
Use the grafana-cli tool to install Datadog from the commandline:
grafana-cli plugins install The plugin will be installed into your grafana plugins directory; the default is /var/lib/grafana/plugins. More information on the cli tool.
Alternatively, you can manually download the .zip file for your architecture below and unpack it into your grafana plugins directory.
Alternatively, you can manually download the .zip file and unpack it into your grafana plugins directory.
2. Configure the Data Source
Accessed from the Grafana main menu, newly installed data sources can be added immediately within the Data Sources section.
Next, click the Add data source button in the upper right. The data source will be available for selection in the Type select box.
To see a list of installed data sources, click the Plugins item in the main menu. Both core data sources and installed data sources will appear.
Change Log
v3.11.1 - 2024-11-12
- ⚙️ Chore: Updated backend dependencies
v3.11.0 - 2024-11-01
- 🚀 Feature: Support Percentile Aggregation function in Metrics Query
v3.10.4 - 2024-10-18
- ⚙️ Chore: Update frontend dependencies
v3.10.3 - 2024-10-03
- ⚙️ Chore: Update frontend dependencies
- ⚙️ Chore: Minimal supported Grafana version is now
10.4.8
v3.10.2 - 2024-09-23
- ⚙️ Chore: Update backend dependencies
v3.10.1 - 2024-08-30
- ⚙️ Chore: update backend dependencies
v3.10.0 - 2024-07-19
- ⚙️ Chore: Capture error source
v3.9.0 - 2024-06-25
- ⚙️ Chore: Added SLO metrics to the plugin
v3.8.0 - 2024-06-19
- ⚙️ Chore: Update sdk and use new license check method
v3.7.4 - 2024-06-19
- ⚙️ Chore: update backend dependencies
v3.7.3 - 2024-06-04
- 🚀 Feature: Support http proxy
v3.7.2 - 2024-03-13
- ⚙️ Chore: Backend binaries are now compiled with Go version
1.22.1
v3.7.1 - 2023-12-19
- ⚙️ Chore: Update backend dependencies to capture error source
v3.7.0 - 2023-10-30
- ⚙️ Chore: Update backend and frontend dependencies
- ⚙️ Chore: Minimal supported Grafana version is now
9.5.13
v3.6.4 - 2023-10-25
- 🐛 Fix: fix raw query type
v3.6.3 - 2023-10-20
- ⚙️ Chore: update rate limit message
v3.6.2 - 2023-10-12
- 🐛 Fix: Fix metrics API call
v3.6.1 - 2023-09-12
- ⚙️ Chore: migrate to create-plugin
v3.6.0 - 2023-09-01
- 🚀 Feature: Added ability block API requests based on upstream rate limits (for metric queries)
v3.5.0 - 2023-08-31
- 🚀 Feature: Log aggregation / analytics support added
v3.4.0 - 2023-06-12
- 🚀 Feature: UI and UX improvements to the plugin configuration page
v3.3.1 - 2023-06-08
- ⚙️ Chore: backend libs updated with golang:1.20.5
v3.3.0 - 2023-06-05
- 🚀 Feature Datasource config page UX improvements
- ⚙️ Chore: Backend binaries are now compiled with Go version
1.20.4which contains security fixes - ⚙️ Chore: Grafana backend plugin SDK updated to v0.161.0
v3.2.2 - 2023-04-19
- ⚙️ Chore: Backend binaries are now compiled with
golang:1.20.3which contain security fixes - ⚙️ Chore: Backend grafana SDK dependencies are updated
v3.2.1 - 2023-03-20
- RUM - Added option for missing aggregation functions P90 and Cardinality
- RUM - Added options to pass custom interval in RUM aggregation queries
v3.2.0 - 2023-02-02
- 🚀 Feature: Updated UI, tooltips and error messages
v3.1.3 - 2023-01-26
- RUM - Fixed a bug where min interval is not honoured by aggregation queries
- RUM - Added option to limit the result in group by aggregations
- ⚙️ Chore: Error messages improved and show proper errors when rate limited
v3.1.2 - 2023-01-04
- RUM - Fixed a bug where RUM aggregate queries where failing with
Too many time bucketserror
v3.1.1 - 2022-12-14
- ⚙️ Chore: Backend binaries are now compiled with Go 1.19.4
- ⚙️ Chore: Grafana enterprise SDK updated to latest to fix licensing issues
- ⚙️ Chore: Grafana backend plugin SDK updated to v0.145.0
- ⚙️ Chore: Backend third party dependencies updated
v3.1.0 - 2022-11-23
- SLO Added display options for SLO/SLI values
- Logs Logs search results now include attributes
- RUM Fixed a bug where dashboard interval settings were not passed in RUM aggregation queries
v3.0.4 - 2022-11-03
- ⚙️ Chore: Backend binaries compiled with latest go version 1.19.3
- Expression - Fixed an issue where the grafana expressions not working when queries are hidden
v3.0.3 - 2022-10-27
- HealthCheck - Fixed an issue with the health check for grafana patch releases
v3.0.2 - 2022-10-25
- ⚙️ Chore: Backend binaries compiled with latest go version 1.19.2
- ⚙️ Chore: Grafana plugin SDK updated to latest
v3.0.1 - 2022-09-13
- Monitor Added Executed Query URL / CURL command to the monitors query type
v3.0.0 - 2022-06-29
- Events Events query support added (beta)
- RUM Search RUM events query support added (beta)
- Logs Log events search query support added (beta)
- Monitor Search monitor group status (beta)
- ⚙️ Chore: Added support for enabling the HTTP logger debugging tool
- ⚙️ Chore: Removed AngularJS dependencies
BREAKING CHANGES
- Minimum required grafana runtime is now updated to 8.4.7
- Removed plugin level caching settings in favour of Grafana enterprise query caching feature. Configure query caching as described here.
v2.3.14 - 2022-06-01
- Added support for
$__tag_tagNameand$__scope_scopeNamealias
v2.3.13 - 2022-03-24
- New builds with go 1.18 to address CVE-2022-24921
v2.3.12 - 2021-12-17
- Enterprise license check update
v2.3.11 - 2021-11-01
- Increase variable tag response size limit to 1000
v2.3.10 - 2021-10-12
- Docs update
v2.3.9 - 2021-09-14
- Docs update
v2.3.8 - 2021-09-13
- Docs update
v2.3.7 - 2021-08-26
- Added config option to disable monitor data links
v2.3.6 - 2021-07-29
- Fixed a bug where removing groupBy option removed other filters
- Fixed a bug where aliasBy was not setting a displayName for the value field
- Variable filtering performance improvements
v2.3.5 - 2021-07-22
- Docs update
v2.3.4 - 2021-05-26
- #250: Retain path suffix in settings URL
v2.3.3 - 2021-05-24
- #244: Support for
$__searchFiltermacro forscopeandtagvariables
v2.3.2 - 2021-04-29
Fixes
- #209: Update to v2 API for fetching all metric tags
v2.3.1 - 2021-04-12
- ⚙️ Chore: Update SDK
[2.3.0] 09-Apr-2021
Features
- #229: Monitor API
- #229: Default Dashboard: Monitors Explorer
[2.2.2] 31-Mar-2021
Fixes
- #214: Sort hosts by
namewhen looking for tag values - #219: Show query error message
- #222: Fix panic when no hosts are returned
[2.2.1] 01-Mar-2021
Fixes
- #199: Fix cache settings unmarshal when changed through UI
[2.2.0] 16-Feb-2021
Features
- #197: Added support for Basic Auth credentials
Enhancements
- #199: Use a struct to unmarshal settings
- #191: Fix and enable e2e tests
[2.1.1] 25-Jan-2021
Enhancements
- #164: Added tests for ad-hoc filters
Fixes
- #166: Update annotations editor screenshot in README
- #176: SLO dropdown is not sorted or sortable
- #177: SLO dropdown typeahead search does not work
- #185: Annotations editor does not display the query
[2.1.0] 07-Dec-2020
Enhancements
- #146: Support SLO History endpoint
Fixes
- #150: AdHoc Filters not working
- #168: Update to new SDK to support individual plugin licensing
- #167: Add the ability to ALIAS BY without regex
- #166: Update plugin documentation
- #152: Metric name empty when editing query
- #159: From clause does not show all options
- #163: Duplicate values in ad-hoc filter drop-downs
- #166: Documentation page for the plugin is old
- #164: Can't remove an ad-hoc filter if the request fails
[2.0.4]
Fix
- Metric Select filtering
[2.0.3]
Added
- Metric Select Paging and Server side filtering
[2.0.2]
Fix
- Add check for resource cache limit error and log warning
- Use map for static cache - client is hitting cache limit
v2.0.1 - 2020-08-19
Fixed
- Query fails without aggregate selected
- Hitting cache limit causes call to fail, don't fail and return notice
- Add setting to adjust cache limit
v2.0.0 - 2020-08-13
Added
- #103 Add backend datasource to support Alerting
- #108 Health check
- Caching to improve performance/reduce hitting rate limits
- #112 Metrics select - virtual scrolling for large lists
- #112 Metrics cache and manual refresh
- #111 Allow setting Datadog URL
Fixed
- #109 Move credentials to secure json
- #105 typo in query editor
- #106 Selecting template variable crashes UI
v1.4.9 - 2020-05-05
- Conversion to react
- Support for alternate SaaS endpoints
v1.4.8 - 2020-04-10
- Add migration for regex
v1.4.7 - 2019-10-23
- Added regex match and alias by fields to raw query editor
- Changed default alias to something more useable, being the one returned from datadog.
v1.4.6 - 2019-09-09
- Add migration for regex
v1.4.5 - 2019-09-06
- 🐛 Fix: styles for functions in Query Editor
v1.4.4 - 2019-08-26
- 🐛 Fix: for Query Editor
- Updated packages
- Now uses toolkit
v1.4.3 - 2019-05-17
- Fixes for issue https://github.com/grafana/datadog-datasource/issues/62
- Fixes for issue https://github.com/grafana/datadog-datasource/issues/63
- Fixes for issue https://github.com/grafana/datadog-datasource/issues/65
- updated packages and jest configuration
v1.4.0 - 2019-02-15
- Caching for API queries. Limits calls to Datadog to 1 per minute per unique query
- Tags. Adds support for all tag groups and fixes a bug that limited the number of tag groups when using ad hoc queries.
v1.3.1 - 2019-01-14
Fixed
- Error when adding new datasource (proxy error: unsupported protocol scheme) (#54)
- Metric editor broken if query type is not the one of 'arithmetic' or 'query'
v1.3.0 - 2019-01-10
Added
- Support arithmetic (#31)
Fixed
- Show all tags in ad-hoc filter (#52)
- 🐛 Fix: error while getting tags in ad-hoc filter (Error: this.request is not a function) (#50)
v1.2.0 - 2018-11-29
Added
- Support template variable for annotations (#38)
Fixed
- Invalid space aggregator error when no aggregation selected (#42)
v1.1.0 - 2018-10-04
Added
- Metric arithmetic using a number (multiply a metric value by 100 for example) (#33)
- Adds three Datadog functions (#32):
- Arithmetic -> Log10 function
- Smoothing -> Auto Smoother
- Regression -> Trend Line
v1.1.0 - 2018-09-19
Added
- Improved Legend Formatting - The Alias By field in the Query Editor now allows you to specify which part of the metric name you want to use. It also now supports regexp for full control over the legend item/alias format.


