Plugins 〉Google BigQuery
Google BigQuery
Google BigQuery data source for Grafana
The Google BigQuery data source plugin allows you to query and visualize Google BigQuery data from within Grafana.
Install the plugin
Navigate to BigQuery plugin homepage.
From the left-hand menu, click the Install plugin button.
The Installation tab is displayed.
Verify that the plugin is installed
- In Grafana, navigate to Configuration > Data sources.
- From the top-right corner, click the Add data source button.
- Search for Google BigQuery in the search field, and hover over the Google BigQuery search result.
- Click the Select button for Google BigQuery. If you can click the Select button, then it is installed.
Configure the Google BigQuery data source in Grafana
Follow these instructions to add a new Google BigQuery data source, and enter configuration options:
Requirements
The following Google APIs need to be enabled for the plugin to work:
Authentication
Google BigQuery datasource provides two ways of authentication:
- By uploading Google Service Account key
- By automatically retrieving credentials from the Google Metadata Server (only available when running Grafana on a GCE virtual machine)
Google Service Account authentication
Create a Google Cloud Platform (GCP) Service Account. The BigQuery Data Viewer role and the Job User role provide all the permissions that Grafana needs.
Google metadata server
When Grafana is running on a Google Compute Engine (GCE) virtual machine, it is possible for the Google BigQuery datasource to automatically retrieve the default project id and authentication token from the metadata server. For this to work, you need to make sure that you have a service account that is setup as the default account for the virtual machine and that the service account has been given read access to the BigQuery API.
Provisioning
It is possible to configure data sources using configuration files with Grafana’s provisioning system. To read about how it works, including and all the settings that you can set for this data source, refer to Provisioning Grafana data sources.
Below you will find some provisioning examples
Using service account
# config file version (with private key in secureJsonData)
apiVersion: 1
datasources:
  - name: BigQuery DS
    type: grafana-bigquery-datasource
    editable: true
    enabled: true
    jsonData:
      authenticationType: jwt
      clientEmail: your-client-email
      defaultProject: your-default-bigquery-project
      tokenUri: https://oauth2.googleapis.com/token
    secureJsonData:
      privateKey: your-private-key
# config file version (with private key path in jsonData)
apiVersion: 1
datasources:
  - name: BigQuery DS
    type: grafana-bigquery-datasource
    editable: true
    enabled: true
    jsonData:
      authenticationType: jwt
      clientEmail: your-client-email
      defaultProject: your-default-bigquery-project
      tokenUri: https://oauth2.googleapis.com/token
      privateKeyPath: '/etc/secrets/bigquery.pem'
Using Google Metadata Server
# config file version
apiVersion: 1
datasources:
  - name: BigQuery DS
    type: grafana-bigquery-datasource
    editable: true
    enabled: true
    jsonData:
      authenticationType: gce
Importing queries created with DoiT International BigQuery DataSource plugin
For everyone using Grafana 8.5+, it’s possible to import queries created with the DoiT International BigQuery community plugin by simply changing the data source to Grafana BigQuery. Please note that queries will be imported as raw SQL queries.
Query the data source
The query editor allows you to query Google BigQuery datasource. Queries can contain macros which simplify syntax and allow for dynamic parts.
SQL query editor
SQL query editor comes with a rich support for standard SQL as well as verbose autocompletion for:
- BigQuery standard SQL language syntax.
- BigQuery datasets, tables and columns.
- Macros and template variables.
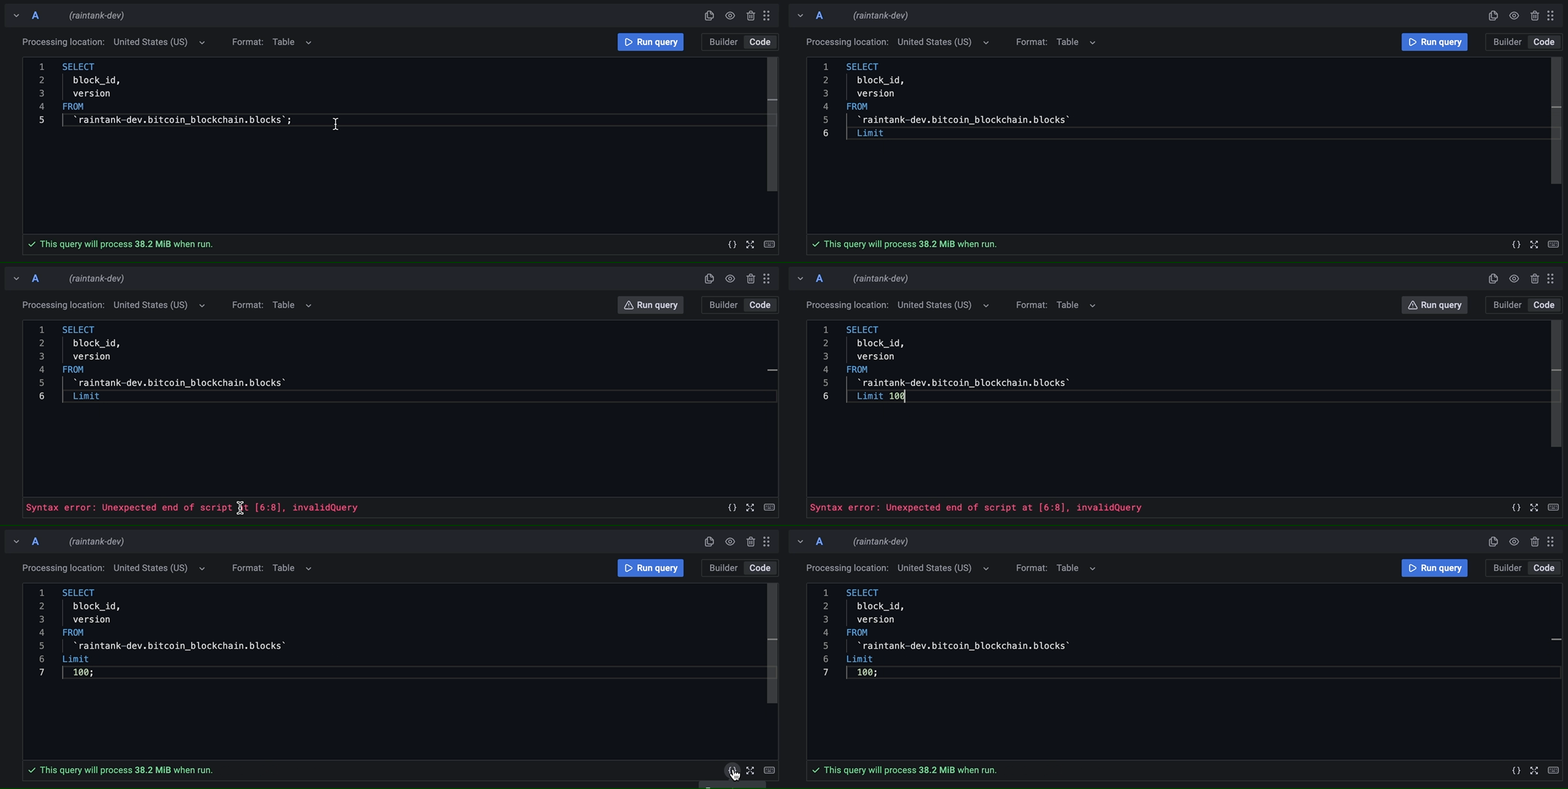
SQL query editor also supports query validation and code formatting.

Query validation
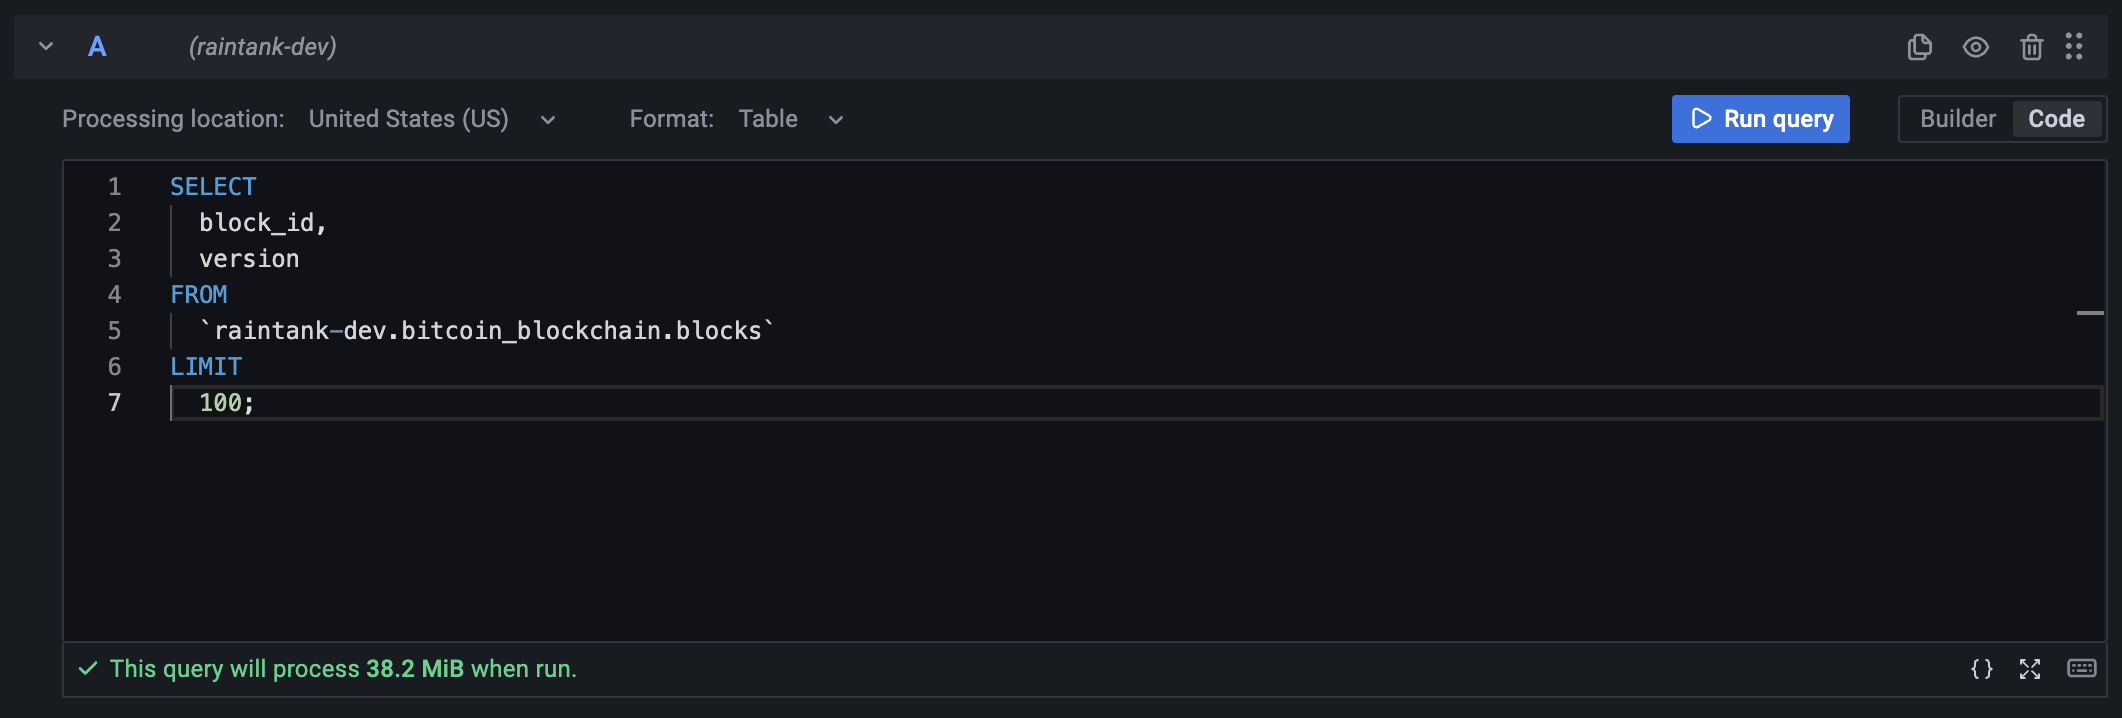
SQL query editor validates the query providing you with a meaningful information about what's wrong with the query. If the query is valid, an estimated query size is shown.

Extended code editor
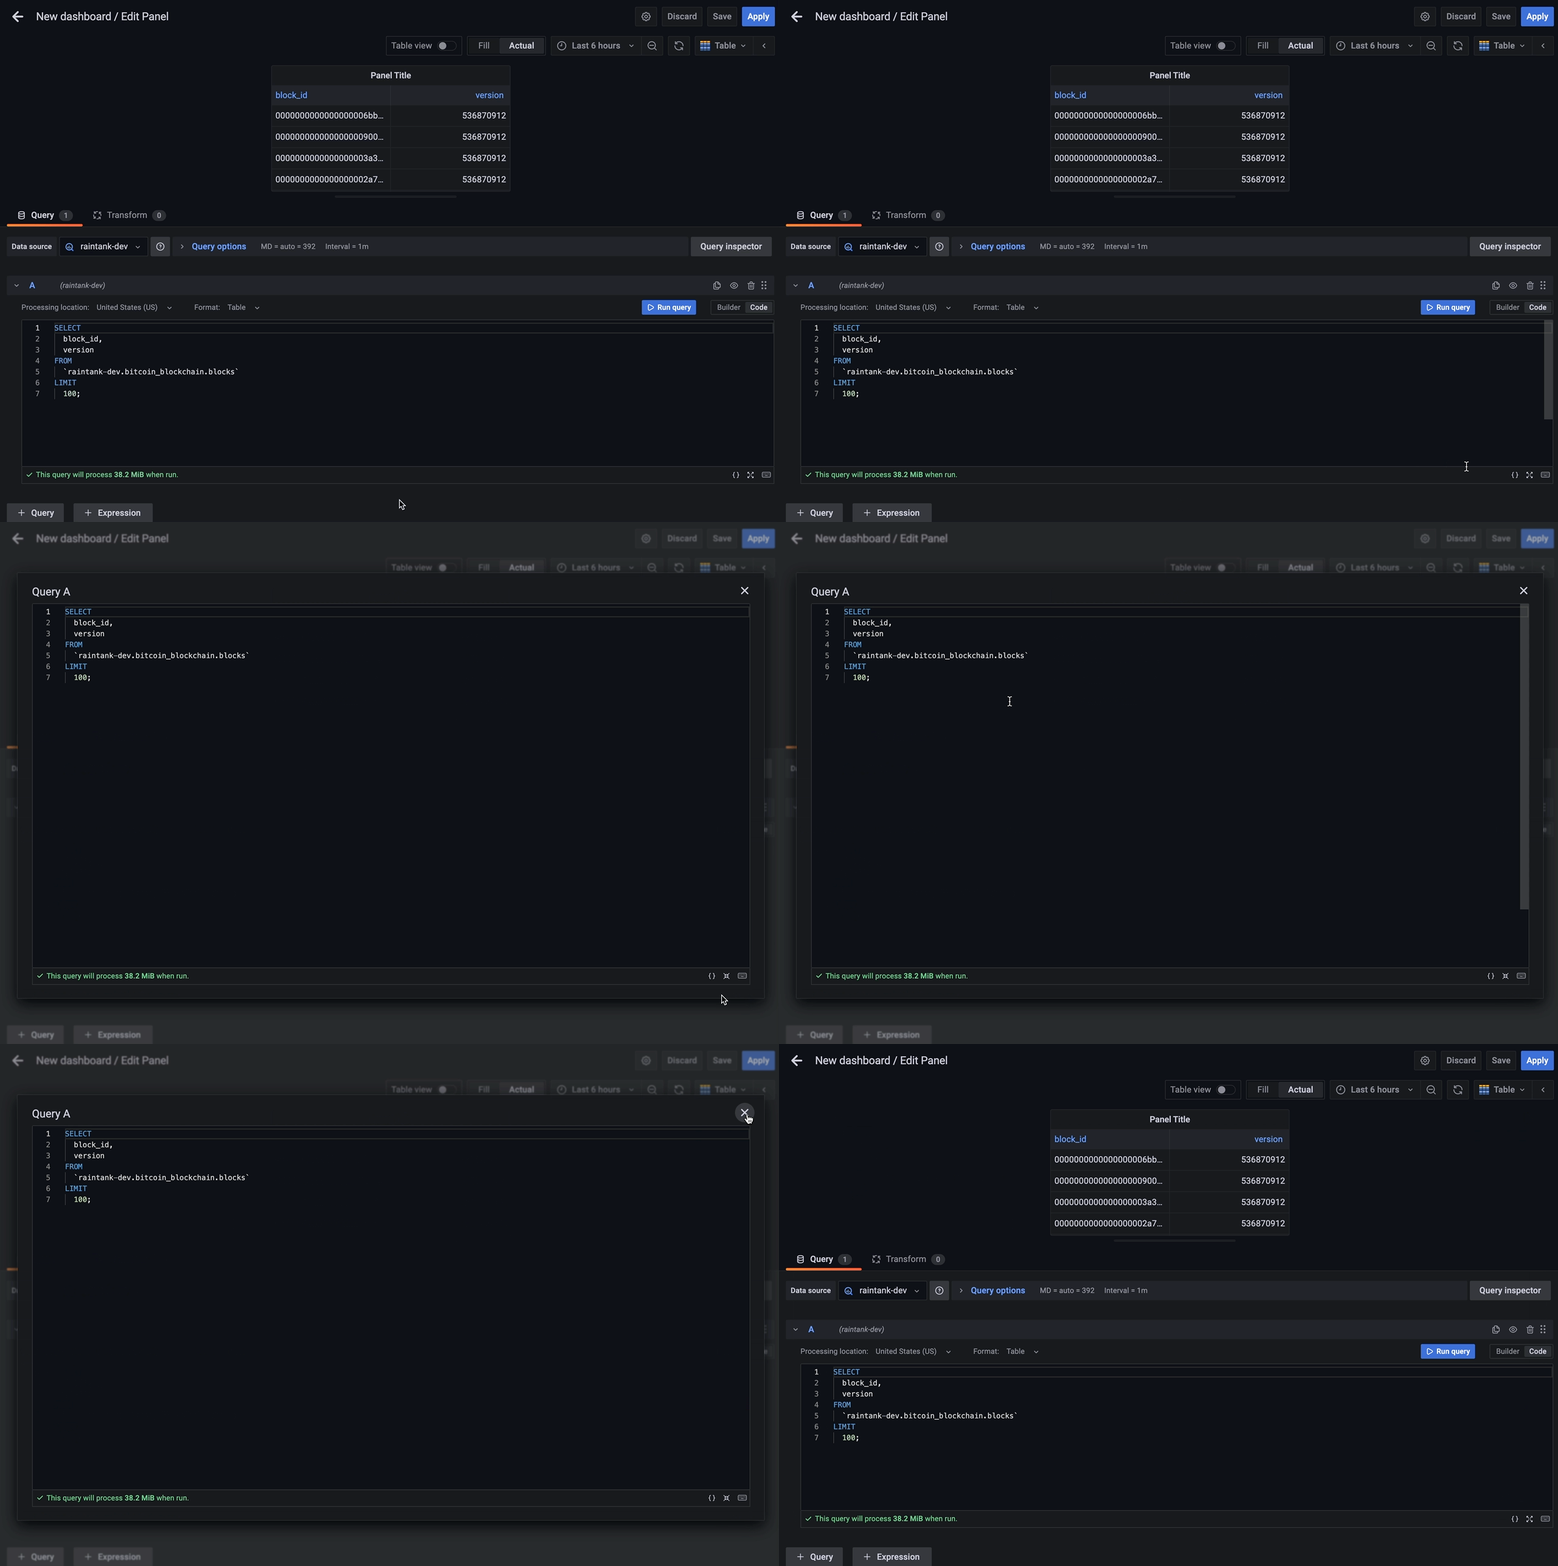
SQL query editor allows editing the query in a full screen code editor making it easy to work with long queries:

Keyboard shortcuts
CMD/Ctrl + Return- Run query
Visual query editor
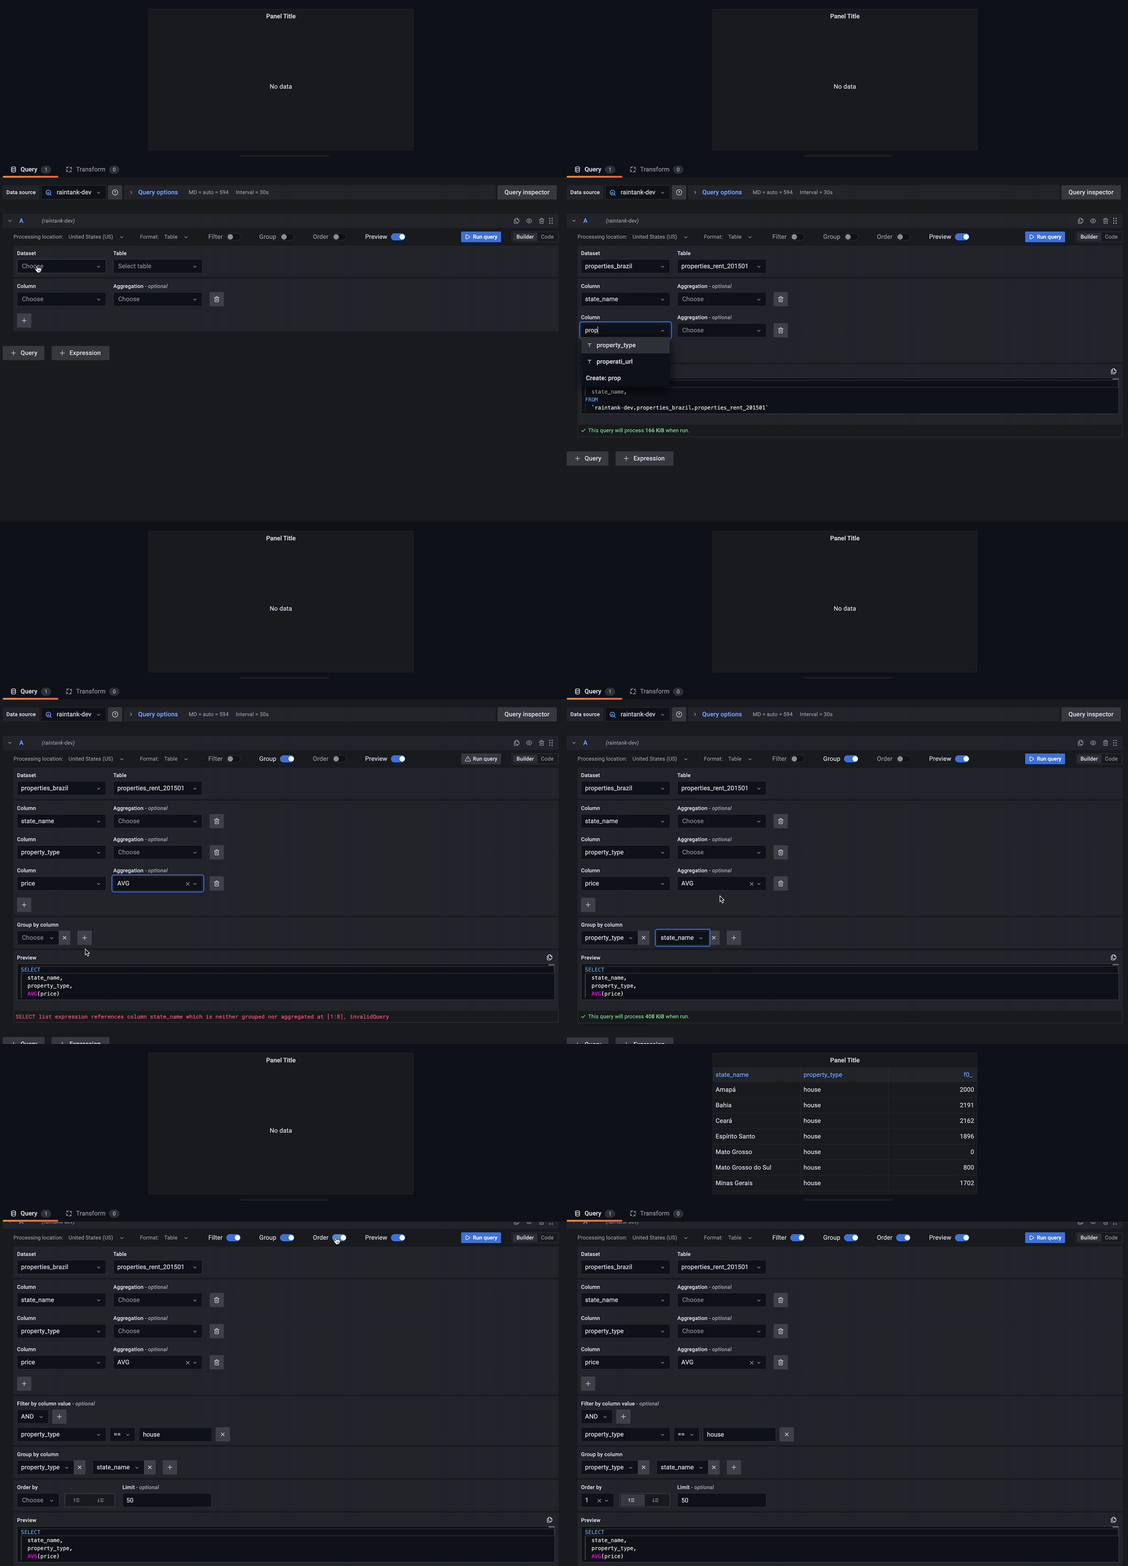
Visual query editor allows creating simple BigQuery queries without SQL knowledge. It comes with basic aggregations support, filtering, grouping, ordering and raw query preview. Similar to SQL query editor, the Visual query editor also validates your query as it's being created.

Query as time series
Time series visualization options are selectable after adding TIMESTAMP field to your query. This field will be used as the timestamp. You can select time series visualization using the visualization options. Grafana interprets timestamp rows without explicit time zone as UTC. Any column except time is treated as a value column.
Query as table
Table visualizations will always be available for any valid Google BigQuery query.
Macros
To simplify syntax and to allow for dynamic parts, like date range filters, the query can contain macros.
Here is an example of a query with a macro that will use Grafana's time filter:
SELECT
      time_column,
      value_column,
FROM `project.dataset.table`
WHERE $__timeFilter(time_column)
| Macro example | Description |
|---|---|
| $__timeFilter(timeColumn) | Will be replaced by a time range filter using the specified name. |
| $__timeGroup(timeColumn,interval) | Will be replaced by an expression usable in the GROUP BY clause. |
Templates and variables
To add a new Google BigQuery query variable, refer to Add a query variable.
After creating a variable, you can use it in your Google BigQuery queries by using Variable syntax. For more information about variables, refer to Templates and variables.
Learn more
- Add Annotations.
- Configure and use Templates and variables.
- Add Transformations.
- Set up alerting; refer to Alerts overview.
Grafana Cloud Free
- Free tier: Limited to 3 users
- Paid plans: $55 / user / month above included usage
- Access to all Enterprise Plugins
- Fully managed service (not available to self-manage)
Self-hosted Grafana Enterprise
- Access to all Enterprise plugins
- All Grafana Enterprise features
- Self-manage on your own infrastructure
Installing Google BigQuery on Grafana Cloud:
Installing plugins on a Grafana Cloud instance is a one-click install; same with updates. Cool, right?
Note that it could take up to 1 minute to see the plugin show up in your Grafana.
Installing plugins on a Grafana Cloud instance is a one-click install; same with updates. Cool, right?
Note that it could take up to 1 minute to see the plugin show up in your Grafana.
Installing plugins on a Grafana Cloud instance is a one-click install; same with updates. Cool, right?
Note that it could take up to 1 minute to see the plugin show up in your Grafana.
Installing plugins on a Grafana Cloud instance is a one-click install; same with updates. Cool, right?
Note that it could take up to 1 minute to see the plugin show up in your Grafana.
Installing plugins on a Grafana Cloud instance is a one-click install; same with updates. Cool, right?
Note that it could take up to 1 minute to see the plugin show up in your Grafana.
Installing plugins on a Grafana Cloud instance is a one-click install; same with updates. Cool, right?
Note that it could take up to 1 minute to see the plugin show up in your Grafana.
Installing plugins on a Grafana Cloud instance is a one-click install; same with updates. Cool, right?
Note that it could take up to 1 minute to see the plugin show up in your Grafana.
For more information, visit the docs on plugin installation.
Installing on a local Grafana:
For local instances, plugins are installed and updated via a simple CLI command. Plugins are not updated automatically, however you will be notified when updates are available right within your Grafana.
1. Install the Data Source
Use the grafana-cli tool to install Google BigQuery from the commandline:
grafana-cli plugins install The plugin will be installed into your grafana plugins directory; the default is /var/lib/grafana/plugins. More information on the cli tool.
Alternatively, you can manually download the .zip file for your architecture below and unpack it into your grafana plugins directory.
Alternatively, you can manually download the .zip file and unpack it into your grafana plugins directory.
2. Configure the Data Source
Accessed from the Grafana main menu, newly installed data sources can be added immediately within the Data Sources section.
Next, click the Add data source button in the upper right. The data source will be available for selection in the Type select box.
To see a list of installed data sources, click the Plugins item in the main menu. Both core data sources and installed data sources will appear.
Changelog
2.0.2
Patch Changes
⚙️ Bump github.com/grafana/grafana-plugin-sdk-go to 0.263.0
2.0.1
- Chore: Update release workflow
2.0.0
- Chore: Plugin now requires Grafana 10.4.8 or newer
1.9.3
- Chore: Bump
uplotfrom 1.6.31 - Chore: Bump
github.com/grafana/grafana-plugin-sdk-gofrom 0.250.0 to 0.258.0
1.9.2
- Chore: Bump
path-to-regexpfrom 1.8.0 to 1.9.0 (#296) - Chore: Bump
github.com/grafana/grafana-plugin-sdk-gofrom 0.245.0 to 0.250.0 (#297) - Chore: Bump
dompurifyfrom 3.1.0 to 3.1.6 (#298)
1.9.1
- Chore: Update
github.com/grafana/grafana-plugin-sdk-goto v0.245.0 (#293) - Chore: Update
micromatchfrom 4.0.5 to 4.0.8 (#292) - Chore: Update
webpackfrom 5.86.0 to 5.94.0 (#291)
1.9.0
- Feature: Add support for custom service endpoint (#266)
- Chore: Add logging for custom service endpoint (#286)
- Chore: Update
github.com/grafana/grafana-plugin-sdk-gotov0.241.0(#285)
1.8.0
- Fix: Make editor labels clickable (#276)
- Chore: Plugin now requires Grafana 10.3.6 or newer (#275)
1.7.1
- Fix: Remove change incompatible with grafana9 (#273)
1.7.0
- Feature: Allow specifying Max Billable Bytes (#254)
- Fix: Handle sub-second intervals in the timeGroup macro (#262)
- Fix: Fixed log line formatting (#255)
- Fix: Make editor labels clickable (#256)
- Fix: Update docs to list correct macros (#259)
- Chore: Update dependencies (#264)
- Chore: Consistent icons (#261)
1.6.1
- Chore: Update dependencies
1.6.0
- Chore: Update dependencies, plugin keywords
- Feature: Query editor: Automatic location selection (#244)
- Feature: Query editor: Better project selection flow (#239)
1.5.0
- Chore: Add missing processing locations (#231)
- Feature: Hide sensitive project information from the Frontend (#236)
- Chore: Update create-plugin and dependencies #240
- Feature: Attach grafana-http-headers as config labels for queries (#241)
1.4.1
- Feature: Add macros autocomplete for code editor
- Feature: Update configuration page to follow best practices
- Chore: Upgrade grafana-plugin-sdk-go to latest
1.4.0
- Chore: Update go and npm dependencies.
- Fix: Fix A11y issues in the query editor.
- Feature: Add support for querying databases from drive.
1.3.1
- Chore: Update the grafana-plugin-sdk-go to 0.171.0
1.3.0
- Feature: Add support for PDC.
1.2.9
- Chore: Use SQLDS in every plugin instance.
1.2.8
- Fix: Variable query error because missing refId #180
1.2.7
- Chore: Update variable editor to use new API. This will also fix an issue with timeFilter macro. #174
1.2.6
- Chore - Backend binaries are now compiled with golang 1.20.4
1.2.5
- Chore: Bump go version
1.2.4
- Chore: Upgrade to latest grafana-google-sdks #166
- Chore: Migrate to create-plugin #165
- Added processing locations: Columbus (Ohio), Madrid, Milan and Paris #161
1.2.3
- Chore: Upgrade grafana/experimental to 1.0.1 #144
- Fix: Update time macros to unquote time variables #155
- Fix: Don't panic in macro timegroup #156
1.2.2
- Chore: Update to Golang 1.19 #149
1.2.1
- Querying: Fix an issue when query location would not be set correctly. (#140)
1.2.0
- Datasource config: Add support for using private key path in datasource configuration.
1.1.1
- Fix: Compatibility issue with Grafana version 8.0.0. (#121)
1.1.0
This release comes with a new feature that enables using multiple BigQuery projects using a single data source. In order to see GCP projects listed in the query editor, you need to enable the Google Cloud Resource Manager API.
- Feature: Add support for multi-project setup. (#112)
- Chore: Update @grafana/experimental dependency. (#115)
- Fix: Processing location is no longer reset when code editor query changes. (#114)
1.0.3
- Data types support: Add support for querying array of primitive types.
- Fix: Interpolate
$__intervaland$__interval_msvariables when validating query.
1.0.2
- Fix: Use configured default project when using GCE authentication.
1.0.1
- Authentication: Allow configuring default project when using GCE authentication.
1.0.0
- Visual Query Builder: Support IS [NOT] NULL operator.
- Code editor: Add template variables suggestions.
- Query builder: Automatically import doitintl-bigquery-datasource queries when changing data source to google-bigquery-datasource. Works only with Grafana 8.5+.
0.1.15
- Data types support Add support for GEOGRAPHY, BIGNUMERIC and BYTES data types.
- Code editor: Add possibility to edit query in an expanded editor.
- Visual Query Builder: Support asterisk in select.
- Visual Query Builder: Format preview.
- Visual Query Builder: Open group by when aggregation selected.
- Fix: Reset query on dataset change.
- Fix: Remove not used config settings.
- Fix: Perform query validation on processing location change.
- Update list of available processing locations.
- Update minimal Grafana version.
0.1.14
- Fix: Reset query in visual query builder when table is changed.
- Fix: Remove debounced state updates in visual query builder.
- Fix: Format template variables and macros correctly in code editor.
- Fix: Do not run hidden queries.
- Fix: Interpolate template variables correctly for validation requests.
0.1.13
- Data source settings: Fix bug, that made it impossible to reset and change JWT token used for authentication.
0.1.12
- Annotations: Add annotation support.
- Visual Query Builder: Visual query builder has now a default limit set for a query (50).
- Visual Query Builder: Queries built with visual query builder are no longer automatically executed- the Run query button is shown as in code editor.
- Visual Query Builder: Query produced by visual query builder has table wrapped in backticks.
- Visual Query Builder: Add aggregated columns to Order By select.
- Visual Query Builder: Fix bug when the user changes the filter operator.
- Autocomplete: Add completion for macros.
- Query validation: Add time range to query validation API call. Fixes query validation errors when macros using the time range is used.
- Query validation: Return validation when an unsupported macro is used.
- Fix: timeGroup macro should now be interpolated correctly.
0.1.11
- Fix: Allow running script queries.
- Query validation: Add interpolated to validation response.
0.1.10
- Code editor: Add option to format the query.
- Code editor: Do not run the query when user blurs the code editor.
- Query validation: Do not re-validate query if it hasn't changed.
0.1.9
- Autocomplete: Add suggestions for columns in WHERE clause.
- Query validation: Actively run query validation on query change rather than on blur.
- Code editor: Run query when CTRL/CMD+Return is pressed.
0.1.8
- Autocomplete: Improve tables suggestions.
- Query validation: Interpolate template variables and macros before performing dry run.
0.1.7
- Autocomplete: Add suggestions for ingestion-time partitioned table filters.
- Code editor: Make autocomplete case insensitive for keywords and operators.
- Code editor: Make query bytes estimate more user friendly.
0.1.6
- Code editor: Add validation with query dry run.
0.1.5
- Autocomplete: Fixed the broken dataset/table suggestions.
0.1.4
- Visual Query Builder: Introducing visual query builder.
- Code editor: Make raw query editor work in Grafana < 8.2.x.
0.1.3
- Autocomplete: Deduplicate logical operators.
- Code editor: Do not run query on blur, improve query header component.
0.1.2
- Data types support: Handle NUMERIC data type.
0.1.1
- Autocomplete: Fixed the broken dataset/table suggestions if project id or dataset id contains a keyword defined in Monaco's default SQL language definition.
0.1.0
Initial Beta release.


