What you'll learn
- How Grafana 8 alerting compares to the old Grafana dashboard alerts
- How Grafana 8 alerting greatly improves upon Grafana Cloud alerting and complex Prometheus-style alerts
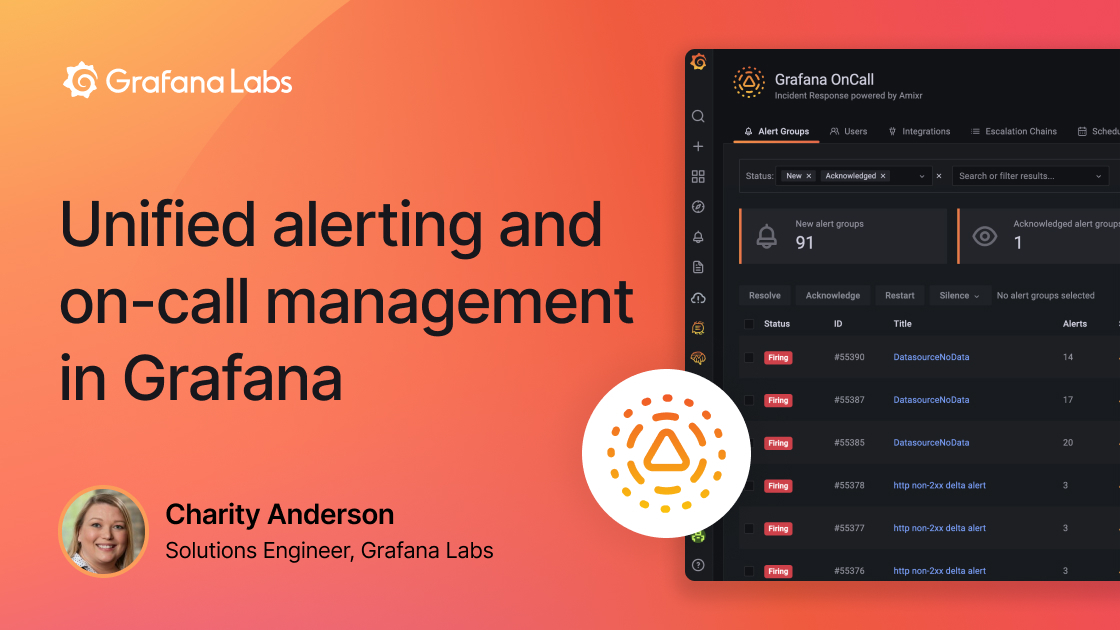
- How Grafana OnCall gives you a centralized view of incidents thanks to the automated grouping and many integrations
- How to manage on-call scheduling, define escalation policies with flexible routing and implement best practices
- How to integrate unified alerting with Grafana OnCall
The Grafana, Prometheus, and Alertmanager stack is the de facto standard for generating alerts. In this webinar, we’ll give you a walkthrough of the Grafana 8 unified alerting system. For users of the old traditional Grafana dashboard alerts, we’ll talk about alerting improvements we’ve made along the way. For users of Prometheus-style alerts and Grafana Cloud alerting, we’ll also explore how the new system makes it easier than ever to manage these alerts, all directly within Grafana. Finally, we will introduce Grafana OnCall, an easy-to-use on-call management tool built to help DevOps and site reliability engineering (SRE) teams improve their collaboration and ultimately resolve incidents faster — right within Grafana.
Your guides


