What you'll learn
- How you can reduce your observability total cost of ownership (TCO) with the Grafana Stack
- What cost elements you need to consider when assessing the TCO of any observability stack
- What value engineering (VE) is, and what the typical VE tools are
- How VE can be used to measure the TCO of an observability solution
Navigating observability costs: Value engineering with the Grafana Stack
Nowadays, companies can choose from a wide variety of open source and proprietary technologies to implement their observability strategy. These technologies bring positive business outcomes such as reducing the impact of downtime, improving customer experience, or boosting operational excellence. However, determining the true value of a solution can become a difficult task when observability practitioners get caught up in the implementation details of their projects.
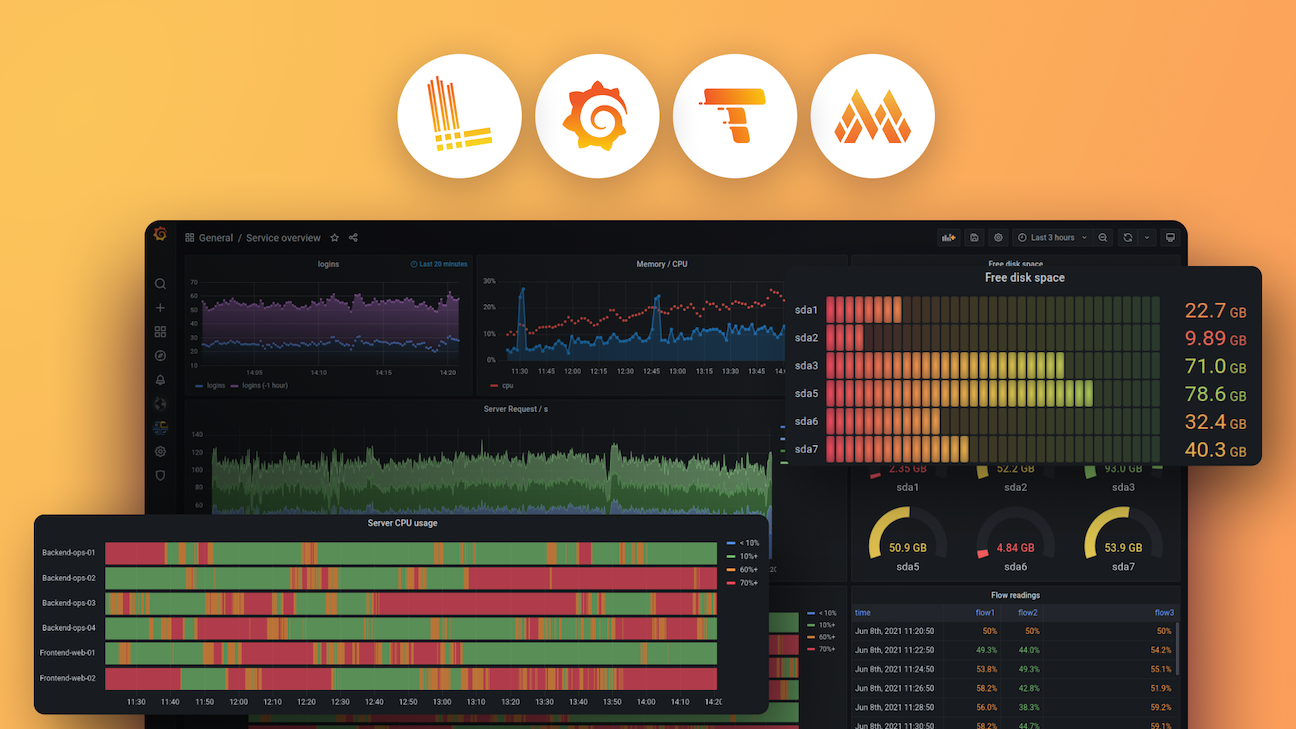
In this webinar, we’ll show you how the Grafana Stack, from Prometheus for metrics, Loki for logs, Tempo for tracing, and more, can demystify the true cost of observability, and how you can reduce the total cost of ownership (TCO) through value engineering (VE). We will show you how to build and customize a TCO tool to produce holistic, quantifiable, and actionable metrics for business stakeholders. Whether you are justifying a budget for a new observability project or looking for data to ask for a promotion, you can leverage your newly gained knowledge to help guide decision makers when confronted with a buffet of all seemingly good options.
Our commitment to the open-source community knows no boundaries. We host this webinar series across various timezones to connect with users worldwide. Explore the same content by Grafana Labs team members in your timezone:


