Webinar

How to scale your metrics, logs, and traces with the Grafana Enterprise Stack

Sign up for this webinar
Note: By registering, you agree to be emailed information about this event recording and related product-level information.
Sign up for this webinar
Note: By registering, you agree to be emailed information about this event recording and related product-level information.
Join the webinar
Note: By registering, you agree to be emailed information about this event recording and related product-level information.
Get notified about the on-demand recording
Note: By registering, you agree to be emailed information about this event recording and related product-level information.
Register to watch the on-demand recording
Note: By registering, you agree to be emailed information about this event recording and related product-level information.
You are registered for this webinar Thanks for registering
You'll receive an email confirmation, and a reminder on the day of the event. You'll receive an email when the on-demand video is available.
Scaling your observability with the Grafana LGTM Stack

What you'll learn

  1. Set up the Grafana Stack so you can go from zero to observability in just a few minutes
  2. Collect, visualize, and alert on all of your data

Join the Grafana Labs team for a 30-minute demo of how to get started with the Grafana Enterprise Stack, so you can go from zero to observability in just a few minutes.

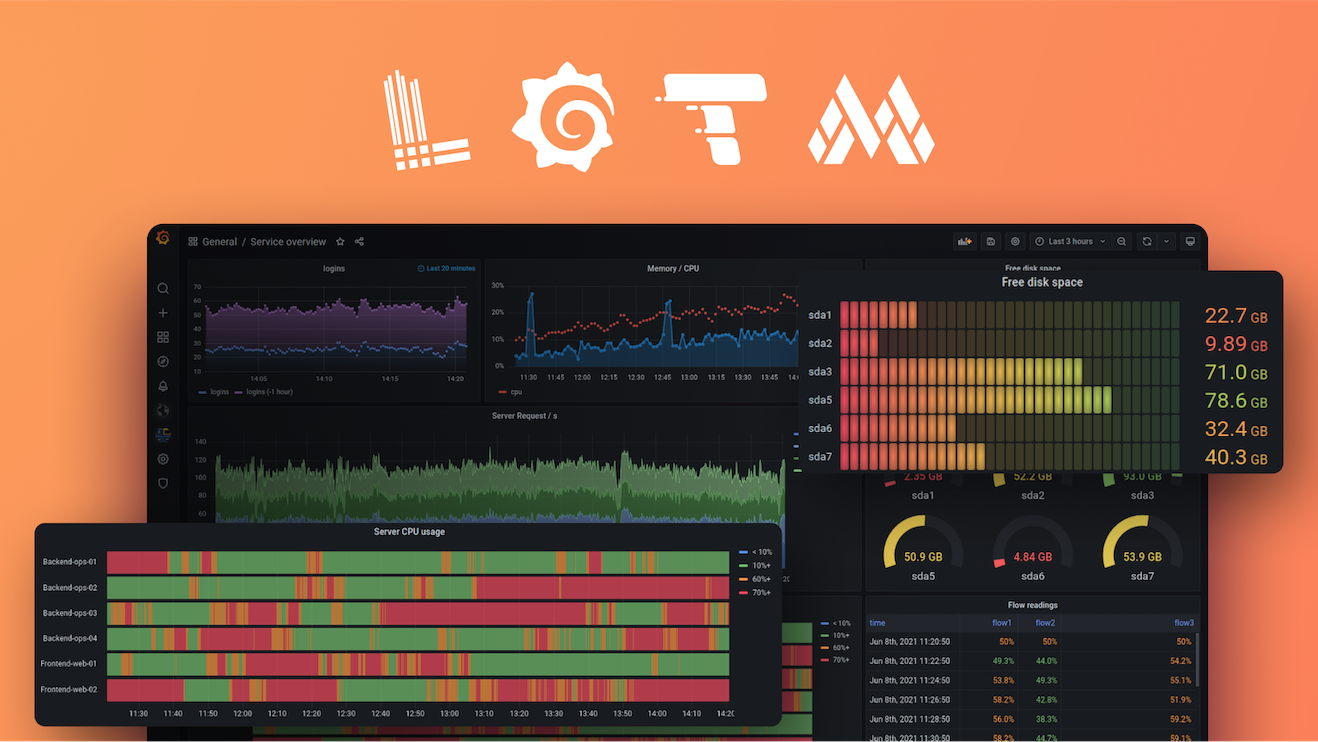
We’ll walk through the Grafana user interface while showing how to set up monitoring for a web service that uses Prometheus and Loki to visualize metrics and logs, as well as use and setup Enterprise plugins such as Splunk.

You’ll learn how to connect, explore, and correlate data in Grafana to gain valuable insights into your application. We’ll also speak to several other Grafana Enterprise features such as data source permissions, PDF reporting, and more.

Additional resources to explore:


Your guide

Chris Wilkes
Chris Wilkes
Senior Solutions Engineer
Resources