What you'll learn
- Learn how the Grafana LGTM (Loki-Grafana-Tempo-Mimir) Stack and Grafana OnCall for on-call management can help reduce MTTI/MTTR by correlating disparate data sources.
- Get an overview of Grafana OnCall and several Grafana plugins, including their integrations with other commercial monitoring tools.
- See a live demo of Grafana OnCall and how to correlate your metrics, logs, and traces.
Over the years, many organizations will organically adopt a number of different monitoring tools. This strategy gives them flexibility and best-of-breed technologies. Unfortunately, this also makes monitoring and root cause analysis slow and challenging. Jumping between tools, aligning timeframes, and switching context and language lead to higher mean time to identify (MTTI) and mean time to resolution (MTTR).
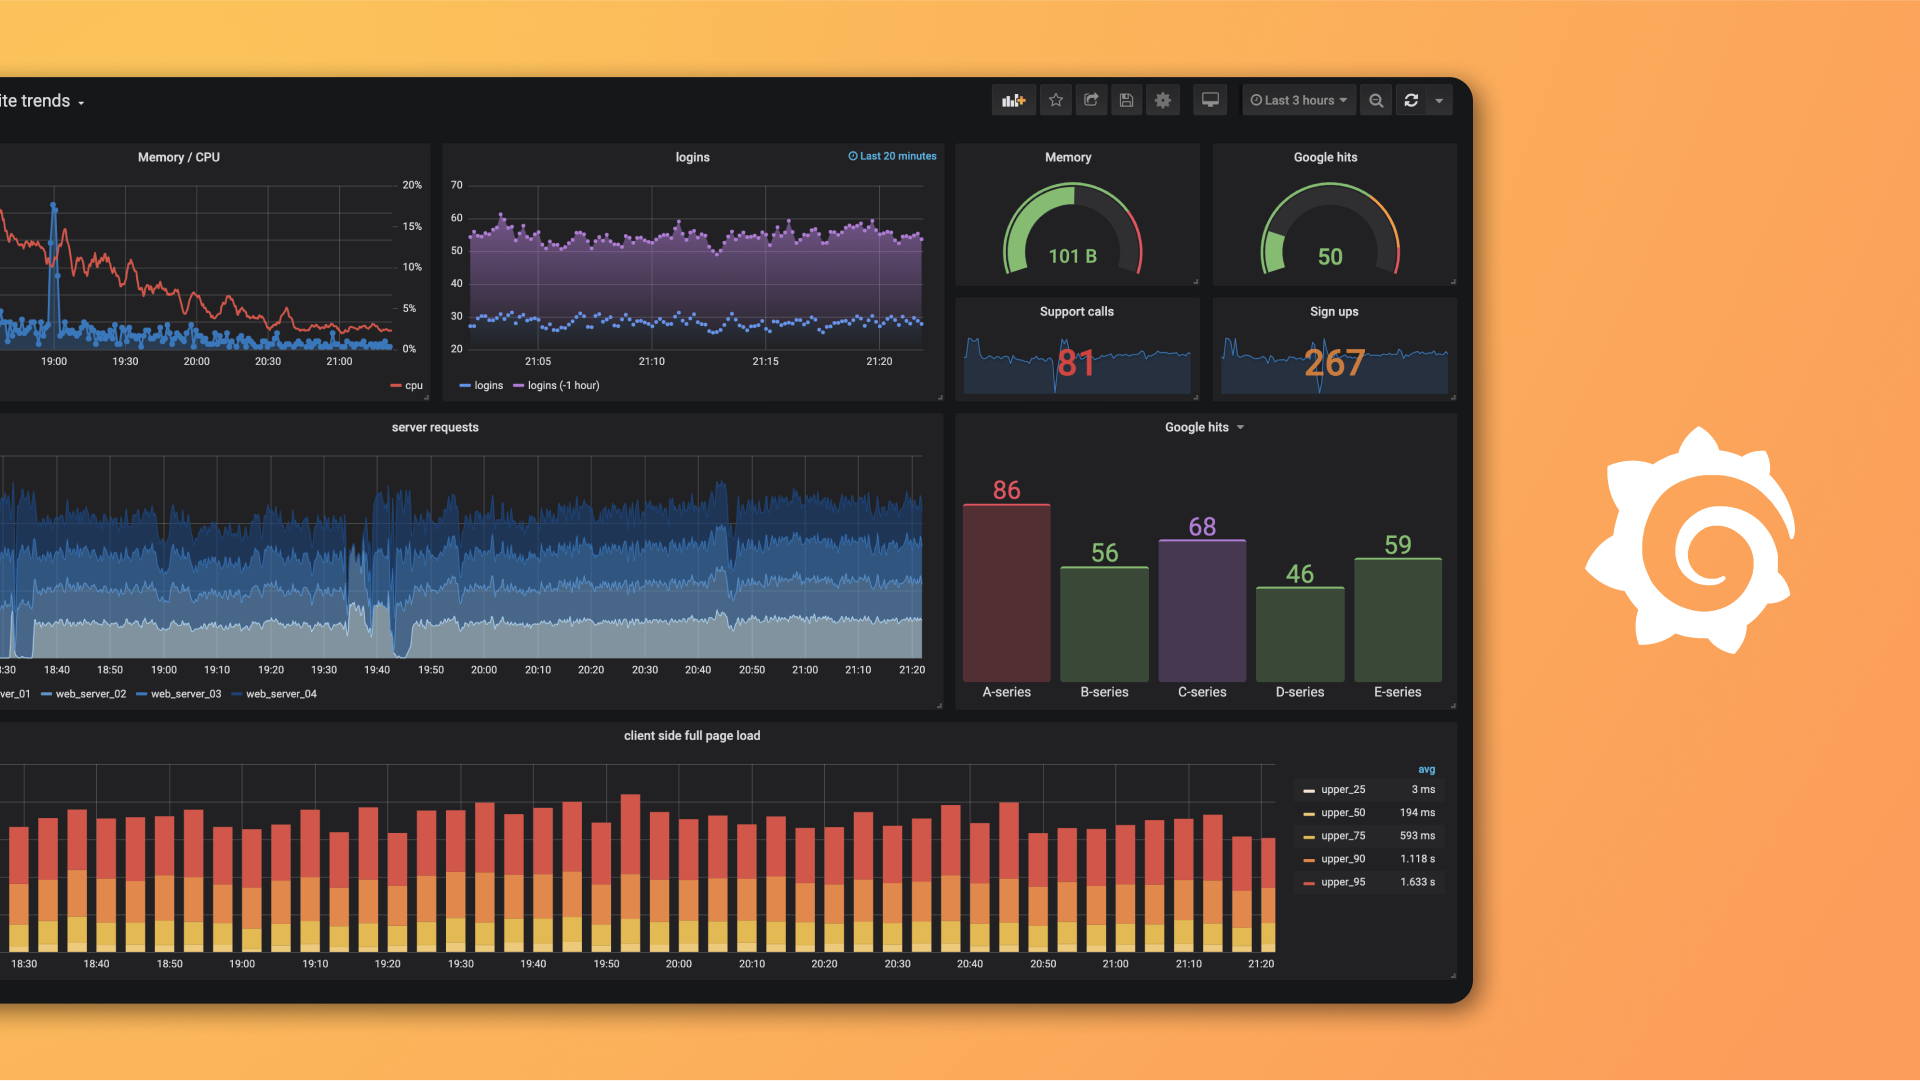
Grafana’s ecosystem of plugins allows you to connect to your existing data sources easily and visualize them together in a dashboard. This means you can get the best out of your complex, expensive monitoring solutions in an easier and more effective way. And with Grafana OnCall, you can integrate your on-call management with your alerting sources and monitoring tools, all in Grafana. The Grafana “single pane of glass” approach allows you to reduce your MTTI/MTTR and provides all the required features for building a central observability platform.
Additional resources to explore:
- Webinar: Getting started with the Grafana LGTM Stack
- Webinar: Scaling your observability with the Grafana LGTM Stack
- Request a demo: Grafana Enterprise
Your guide


