What you'll learn
- The importance of metrics as part of your observability strategy
- The challenges that come up when scaling Prometheus metrics
- How to overcome the scaling challenge with different Grafana Labs offerings - Grafana Mimir, Grafana Cloud Metrics and Grafana Enterprise Metrics
- How to choose between the different Grafana offerings
- How to get started with Grafana Cloud using your existing metrics system
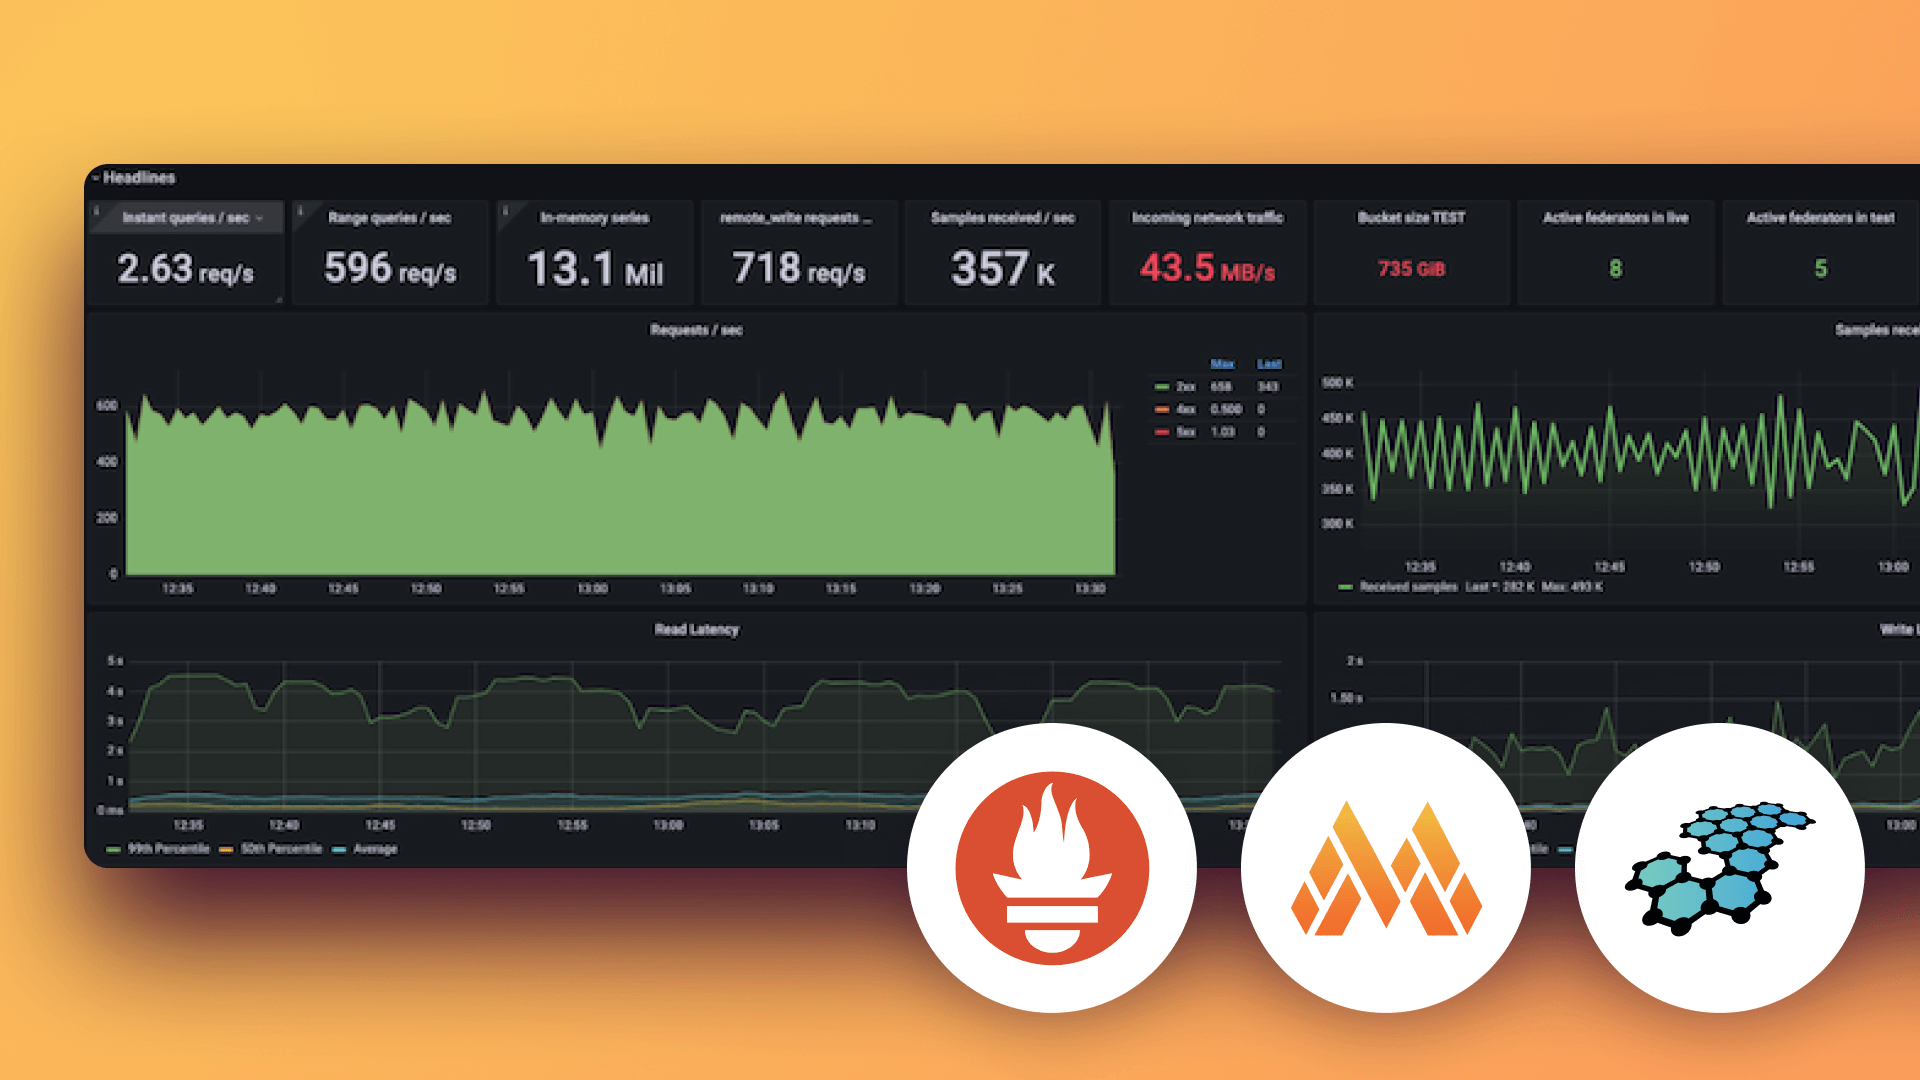
Scale Prometheus with Grafana Mimir, visualize and query metric data with Grafana.
Prometheus has become the metrics management standard for modern and cloud native applications. However, enterprises that use Prometheus at scale face scalability, availability, legacy, and security challenges. Grafana Labs provides a simple and scalable solution for unifying your metrics across multiple systems, enabling both real-time and historical analysis in Grafana Cloud or self-hosted on your own infrastructure.
In this session, we’ll talk about some of the challenges users encounter when scaling their metrics systems, with a particular focus on Prometheus, Grafana Mimir and Grafana Cloud - the fully managed observability stack from Grafana Labs. Then we’ll cover how Grafana helps organizations address these problems so they can easily store, query, and manage their metrics.
Our commitment to the open-source community knows no boundaries. We host this webinar series across various timezones to connect with users worldwide. Explore the same content by Grafana Labs team members in your timezone:
Your guide


