Webinar

Correlate your metrics, logs, and traces with the Grafana LGTM Stack

Sign up for this webinar
Note: By registering, you agree to be emailed information about this event recording and related product-level information.
Sign up for this webinar
Note: By registering, you agree to be emailed information about this event recording and related product-level information.
Join the webinar
Note: By registering, you agree to be emailed information about this event recording and related product-level information.
Get notified about the on-demand recording
Note: By registering, you agree to be emailed information about this event recording and related product-level information.
Register to watch the on-demand recording
Note: By registering, you agree to be emailed information about this event recording and related product-level information.
You are registered for this webinar Thanks for registering
You'll receive an email confirmation, and a reminder on the day of the event. You'll receive an email when the on-demand video is available.
Correlate your metrics, logs, and traces with the Grafana LGTM Stack

What you'll learn

  1. To use multiple data sources such as Prometheus, Grafana Loki, and Grafana Tempo.
  2. How you can weave these three together.
  3. To build a true single-pane-of-glass view into your system.
  4. How this can help reduce MTTI/MTTR

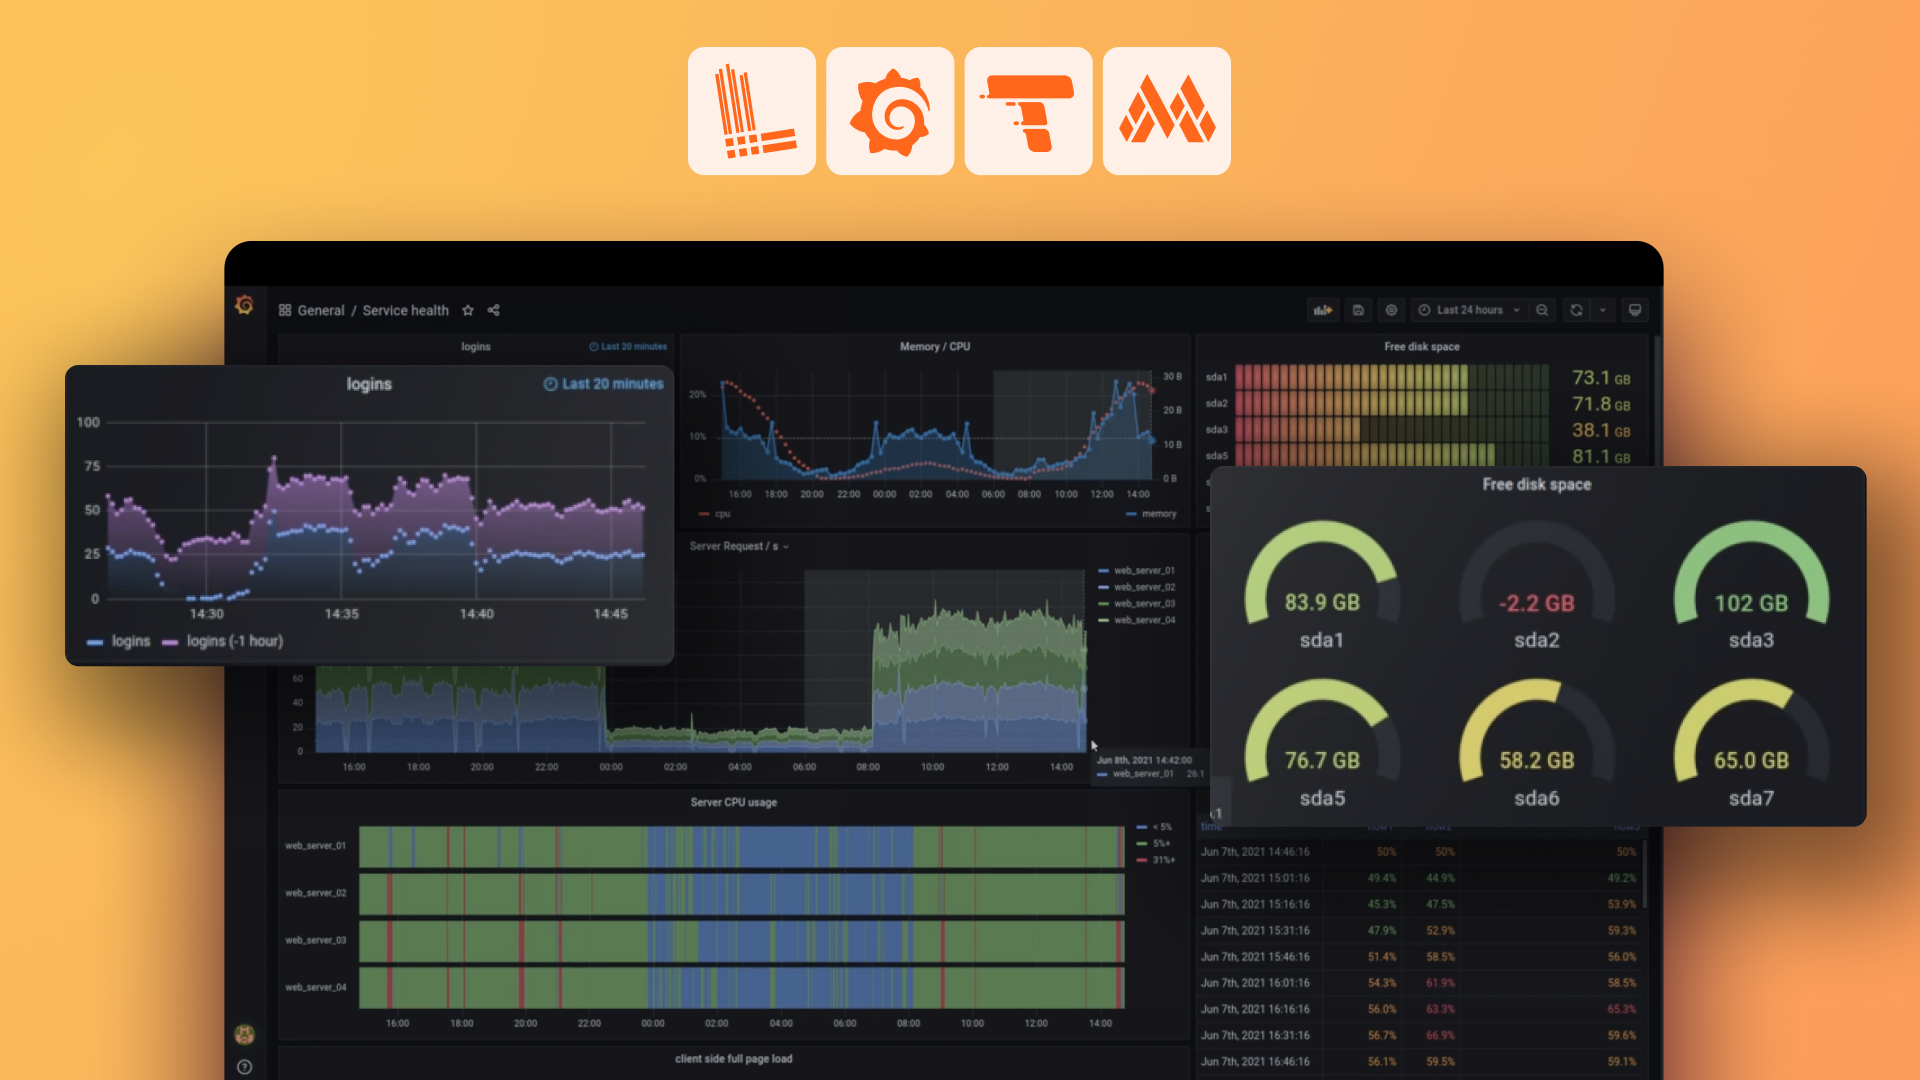
At Grafana Labs, we believe that users should have the freedom to use the tools they know and love. In this webinar, we’ll talk about taking metrics, logs, and traces from different data sources and visualizing all of it side-by-side in Grafana, where everyone in the organization can view it, interact with it, and correlate it. By using Grafana, you can reduce MTTR and focus your time and energy on the projects that have the most impact on your business: less time firefighting, more time innovating.

Additional resources to explore:


Your guide

Ashley Somerville
Ashley Somerville
Senior Solutions Engineer
Resources