That’s a wrap on ObservabilityCON on the Road Singapore
Be the first to know updates on future ObservabilityCON events
The annual open source observability conference from Grafana Labs
Open source observability updates
Hear what’s new in the open source observability landscape and connect with community members
Technical tips and tricks
See how recent developments in the LGTM stack can help you optimize telemetry costs, shift left with performance testing, and streamline incident response
Expert advice
Get your technical questions about Prometheus, OpenTelemetry, and other open source observability topics answered by Grafana Labs experts
Community success stories
Learn from users who are transforming their approach to observability, managing exploding telemetry data volumes, and slashing MTTR
Agenda
- 12:00 PM 1:00 PM
Registration + Expo
Network with attendees and explore Grafana demos in the Expo Hall - 1:00 PM 1:45 PM
ObservabilityCON on the Road Keynote
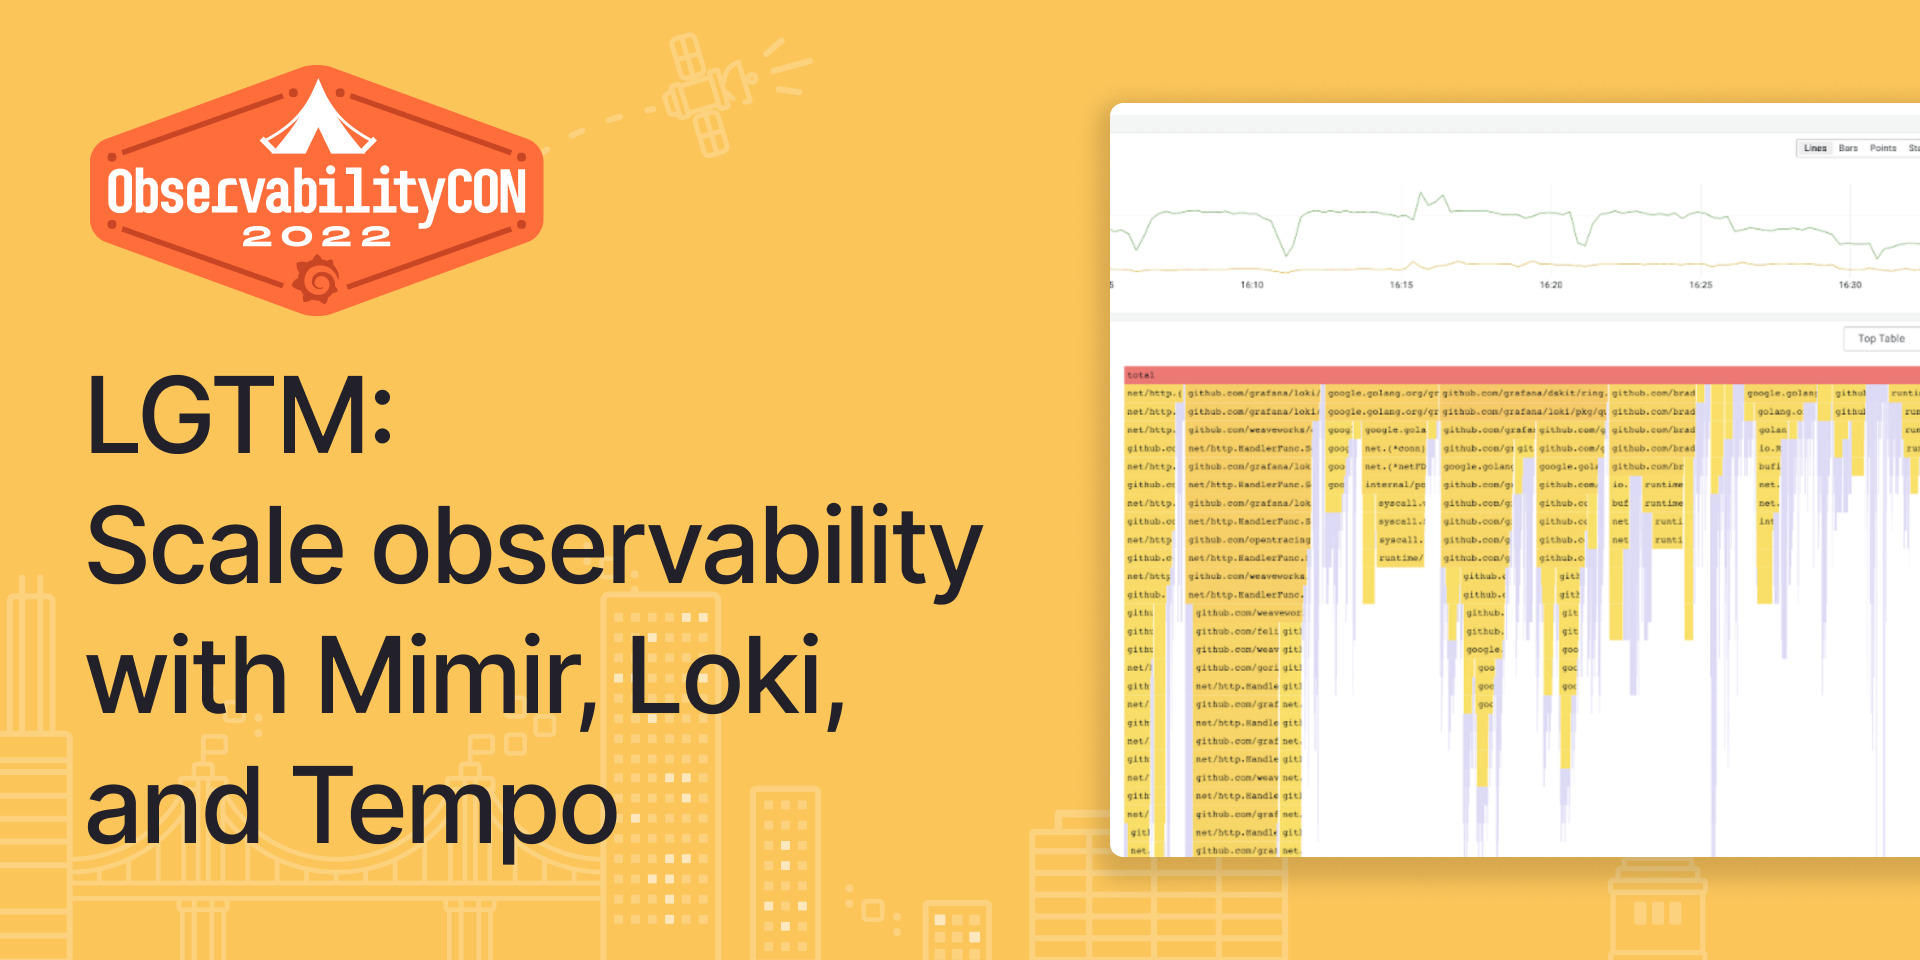
Live in Singapore, it’s ObservabilityCON on the Road! Join Grafana Labs Co-Founder Anthony Woods and CTO Tom Wilkie for a look at the latest trends across the observability ecosystem and developments in the open and composable LGTM (Loki-Grafana-Tempo-Mimir) observability stack.

- Anthony Woods, Co-Founder, Grafana Labs
- Tom Wilkie, Chief Technology Officer, Grafana Labs
- 1:45 PM 2:15 PM
How to reduce observability costs by controlling metrics growth
The shift to cloud native architectures and increased developer autonomy to instrument applications has caused an explosive growth of metrics data and cardinality. But more data does not mean better observability: It can be difficult to balance scale while managing costs.
Learn how Grafana Cloud can help lower your observability bills. By regulating metrics growth through governance and unique customized aggregations, you optimize your costs and pay closer to what you actually use.

- Ward Bekker, Senior Principal Solutions Engineer, Grafana Labs
- 2:15 PM 2:45 PM
Observability journey in a secure and controlled environment
Join Roshan Mohammed and Sakthi Raam R K from DBS, Asia’s leading financial services group. Roshan and Sakthi will discuss their experiences of moving away from proprietary software solutions to open source tooling, and how they tackled the various pillars of observability along the way.
In this session, they’ll dive into how the Investment & Trading Technology team at DBS has enabled observability of their microservices and auto-instrumentation of their applications. They’ll also show how they derived an error budget based on service performance indicators, the challenges they faced in setting up an observability infrastructure in a controlled and shared environment, and the process of gaining SRE certification for applications.
- Roshan Mohammed, Vice President, DBS
- Sakthi Raam R K, Assistant Vice President - SRE, DBS
- 2:45 PM 3:15 PM
Break
- 3:15 PM 3:45 PM
How to prioritize critical resources through SLO-driven Incident Response & Management
Prioritizing performance issues based on business impact is often challenging because it is hard to quantify the right SLO/SLI levels.
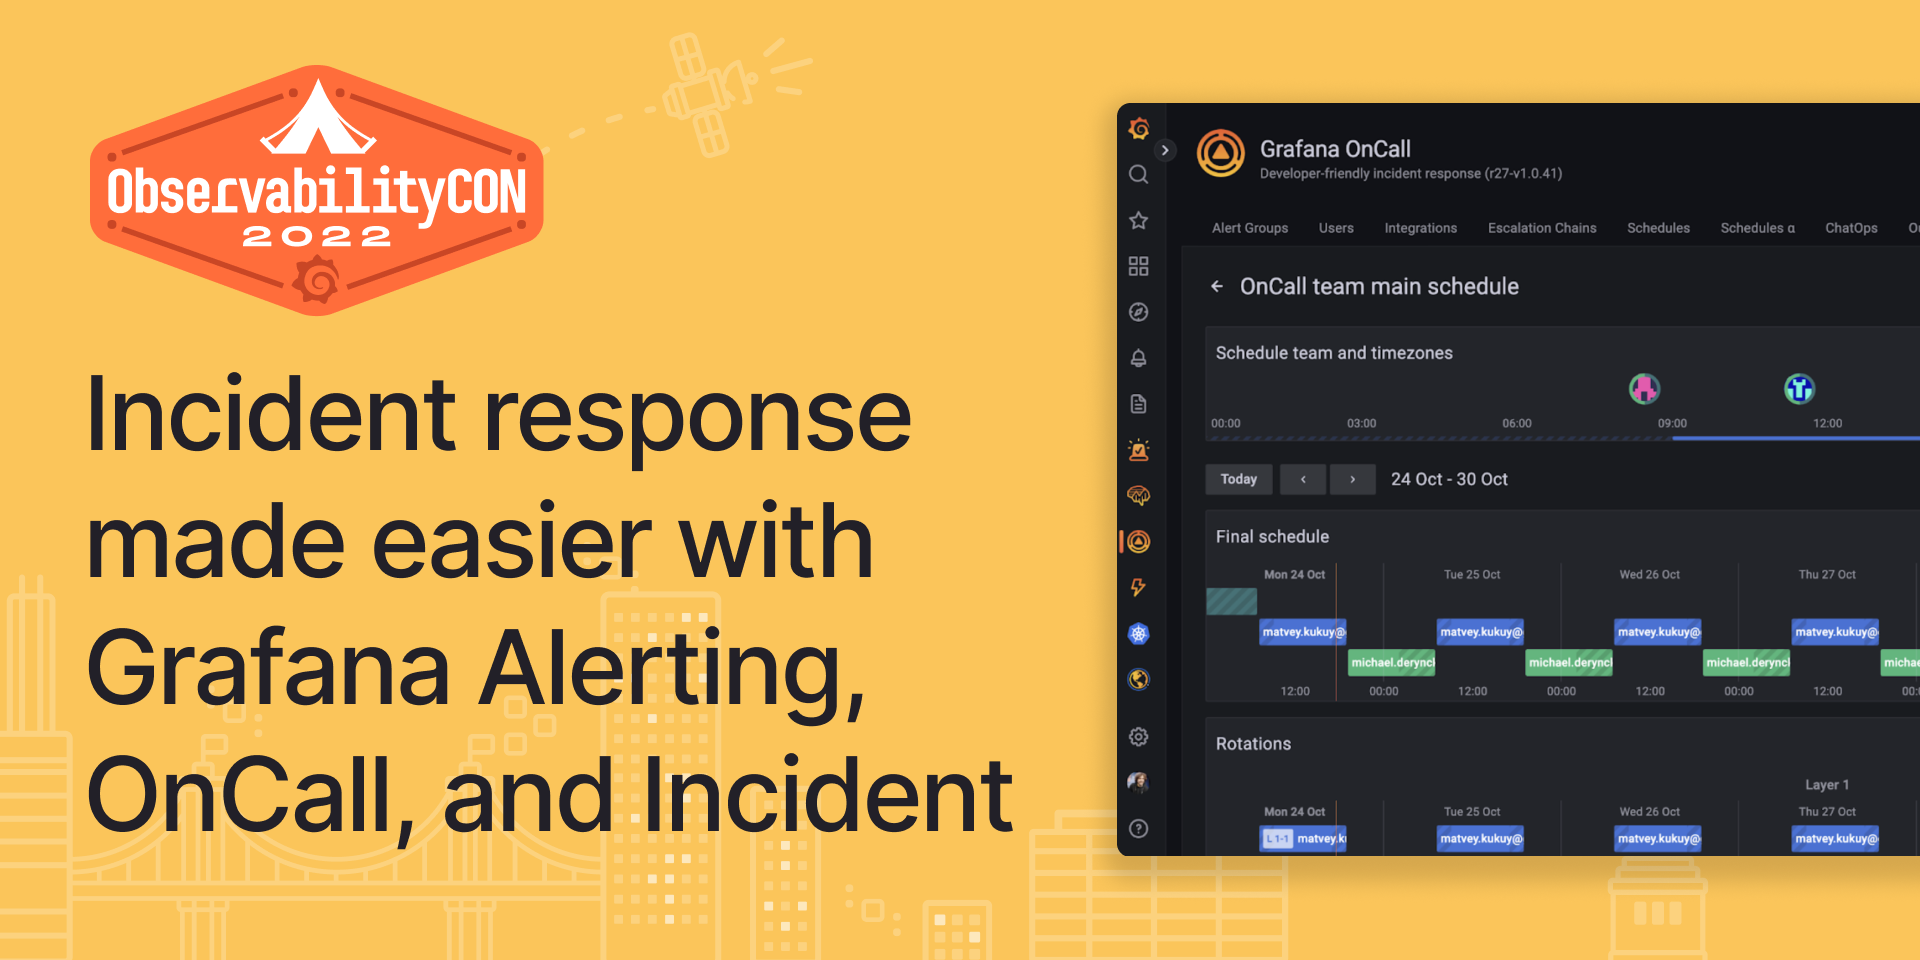
Learn how you can build an SLO framework that unifies data from multiple disparate tools and is integrated into a seamless incident management workflow with Grafana OnCall and Incident. You can then prioritize responding to the most critical error budget burndowns, allowing your critical developers to focus on innovation rather than firefighting performance issues.

- Cyril Amsellem, Lead Solutions Engineer, APAC, Grafana Labs
- 3:45 PM 4:15 PM
How to avoid the most common Kubernetes monitoring mistakes
Which metrics should you collect? What dashboards are best suited to effectively monitor Kubernetes clusters? How do you measure resource utilization for capacity planning? Often, this is all a game of trial and error – and one that business-critical services cannot afford.
Learn how Grafana Cloud’s K8s monitoring solution was built so you can avoid the guessing game and kickstart your K8s observability strategy in minutes. In this session, we break down the most common Kubernetes monitoring mistakes and share best practices on how to set up Kubernetes monitoring the optimal way.

- Nicole van der Hoeven, Developer Advocate, k6
- 4:15 PM 5:15 PM
Reception + Expo
Join us for appetizers and beverages while networking with attendees and meeting Grafana experts in the Expo hall
Not what you were looking for?
Find a Grafana Labs event near you
From local meetups to virtual webinars and in-person GrafanaLive events, there’s plenty more to explore.
See all eventsBest of ObservabilityCON 2022 in New York
See what popped up under the big tent at our flagship ObservabilityCON this past October.


