Ride share tutorial with Pyroscope
This tutorial demonstrates a basic use case of Pyroscope by profiling a “Ride Share” application. In this example, you learn:
- How an application is instrumented with Pyroscope, including techniques for dynamically tagging functions.
- How to view the resulting profile data in Grafana using the Profiles View.
- How to integrate Pyroscope with Grafana to visualize the profile data.
Before you begin
You need to have the following prerequisites to complete this tutorial:
- Git
- Docker
- The Docker Compose plugin (included with Docker Desktop)
Tip
Try this tutorial in an interactive learning environment: Ride share tutorial with Pyroscope.
It’s a fully configured environment with all the dependencies installed.
Provide feedback, report bugs, and raise issues in the Grafana Killercoda repository.
Background
In this tutorial, you will profile a simple “Ride Share” application. The application is a Python Flask app that simulates a ride-sharing service. The app has three endpoints which are found in the server.py file:
/bike: calls theorder_bike(search_radius)function to order a bike/car: calls theorder_car(search_radius)function to order a car/scooter: calls theorder_scooter(search_radius)function to order a scooter
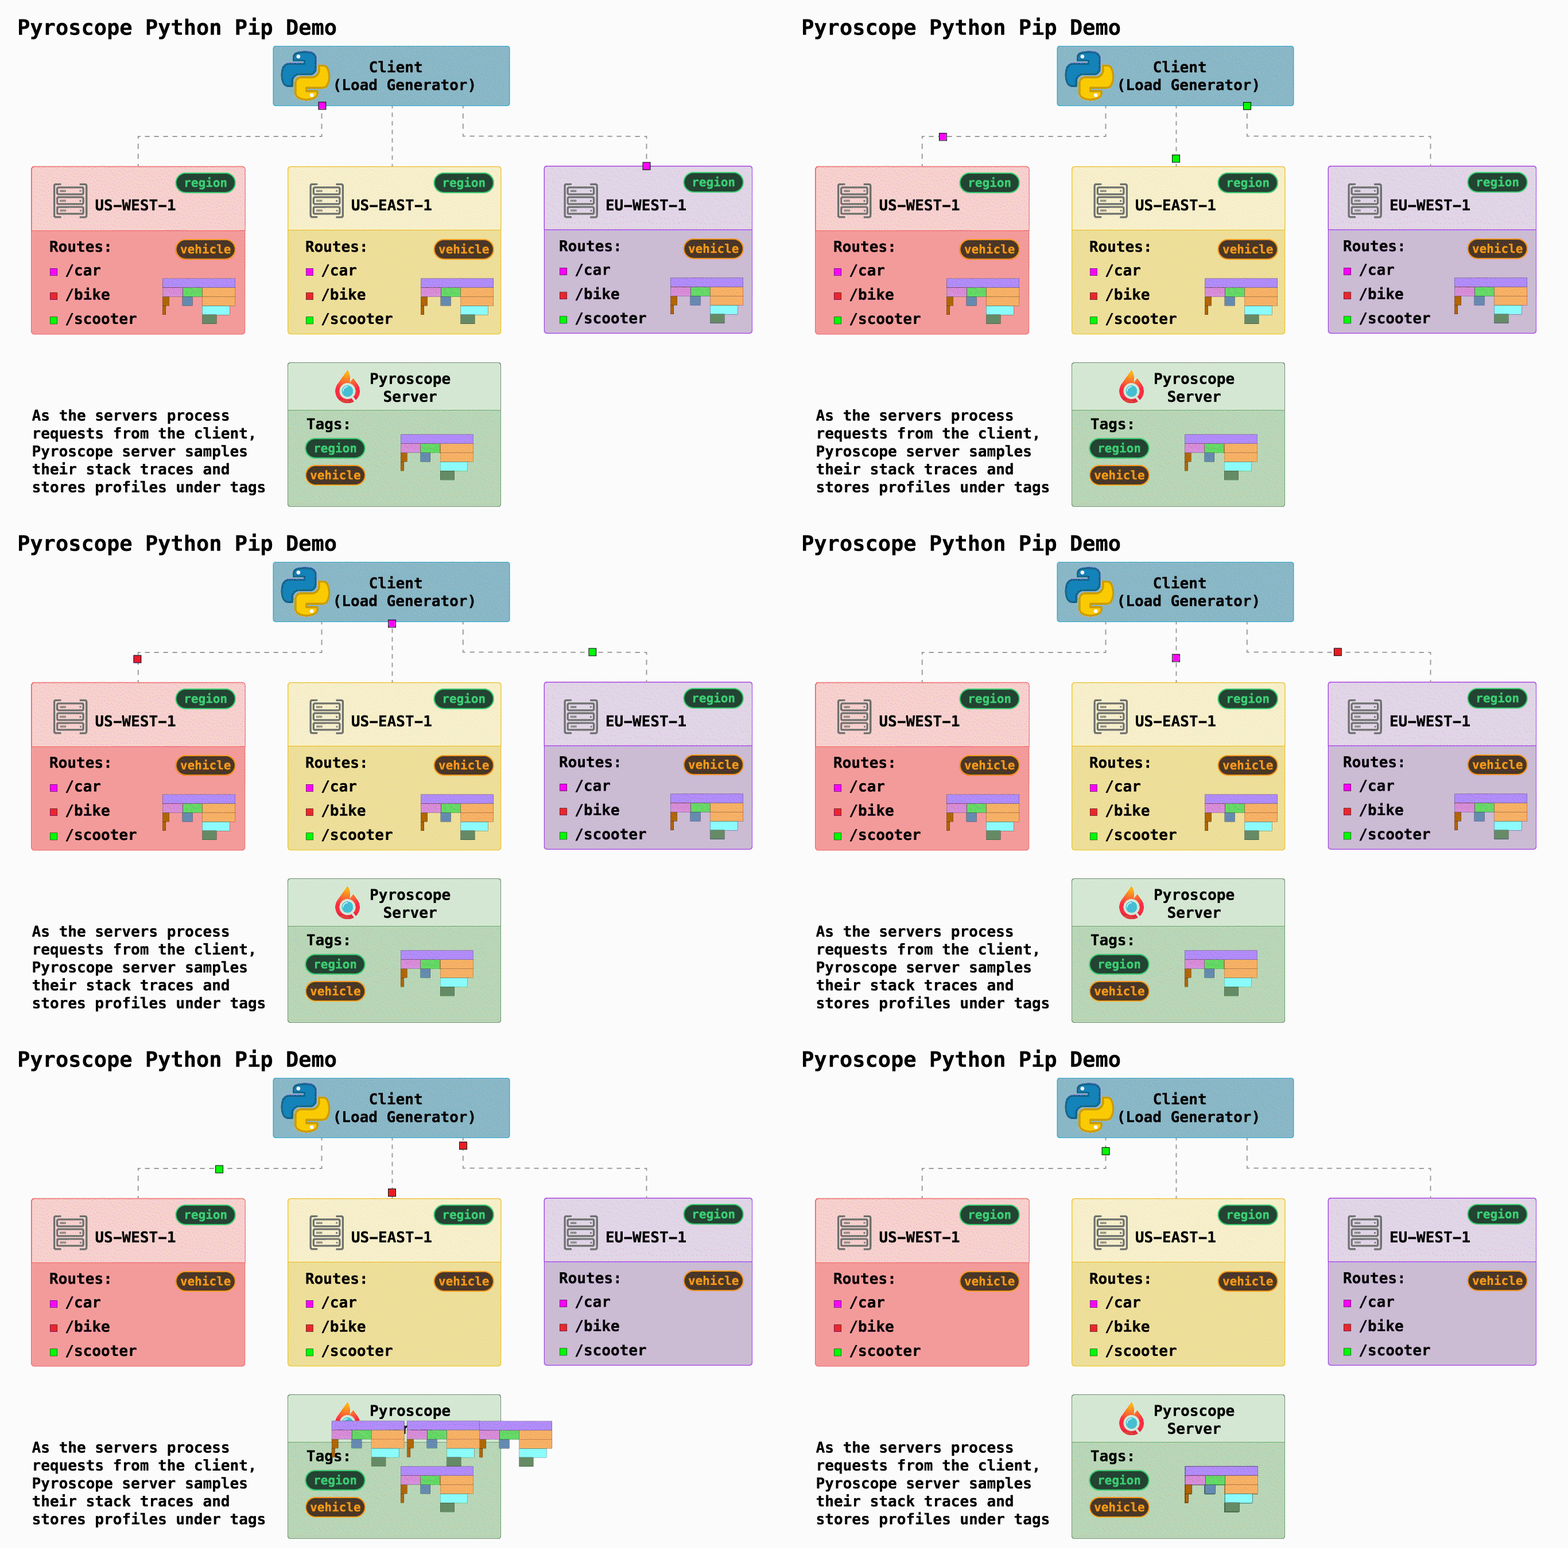
To simulate a highly available and distributed system, the app is deployed on three distinct servers in 3 different regions:
- us-east
- eu-north
- ap-south
This is simulated by running three instances of the server in Docker containers. Each server instance is tagged with the region it represents.

In this scenario, a load generator will send mock-load to the three servers as well as their respective endpoints. This lets you see how the application performs per region and per vehicle type.
Clone the repository
Clone the repository to your local machine:
git clone https://github.com/grafana/pyroscope.git && cd pyroscopeNavigate to the tutorial directory:
cd examples/language-sdk-instrumentation/python/rideshare/flask
Start the application
Start the application using Docker Compose:
docker compose up -dThis may take a few minutes to download the required images and build the demo application. Once ready, you will see the following output:
 ✔ Network flask_default  Created
 ✔ Container flask-ap-south-1  Started
 ✔ Container flask-grafana-1  Started
 ✔ Container flask-pyroscope-1  Started
 ✔ Container flask-load-generator-1 Started
 ✔ Container flask-eu-north-1 Started
 ✔ Container flask-us-east-1 Started
Optional: To verify the containers are running, run:
docker ps -aAccessing Explore Profiles in Grafana
Grafana includes the Explore Profiles app that you can use to view profile data. To access Explore Profiles, open a browser and navigate to http://localhost:3000/a/grafana-pyroscope-app/profiles-explorer.
How tagging works
In this example, the application is instrumented with Pyroscope using the Python SDK. The SDK allows you to tag functions with metadata that can be used to filter and group the profile data in the Explore Profiles. This example uses static and dynamic tagging.
To start, let’s take a look at a static tag use case. Within the server.py file, find the Pyroscope configuration:
 pyroscope.configure(
     application_name = app_name,
     server_address   = server_addr,
     basic_auth_username = basic_auth_username, # for grafana cloud
     basic_auth_password = basic_auth_password, # for grafana cloud
     tags             = {
         "region":   f'{os.getenv("REGION")}',
     }
 )
This tag is considered static is because the tag is set at the start of the application and doesn’t change. In this case, it’s useful for grouping profiles on a per region basis, which lets you see the performance of the application per region.
- Open Grafana using the following url: http://localhost:3000/a/grafana-pyroscope-app/profiles-explorer.
- In the main menu, select Explore > Profiles.
- Select Labels in the Exploration path.
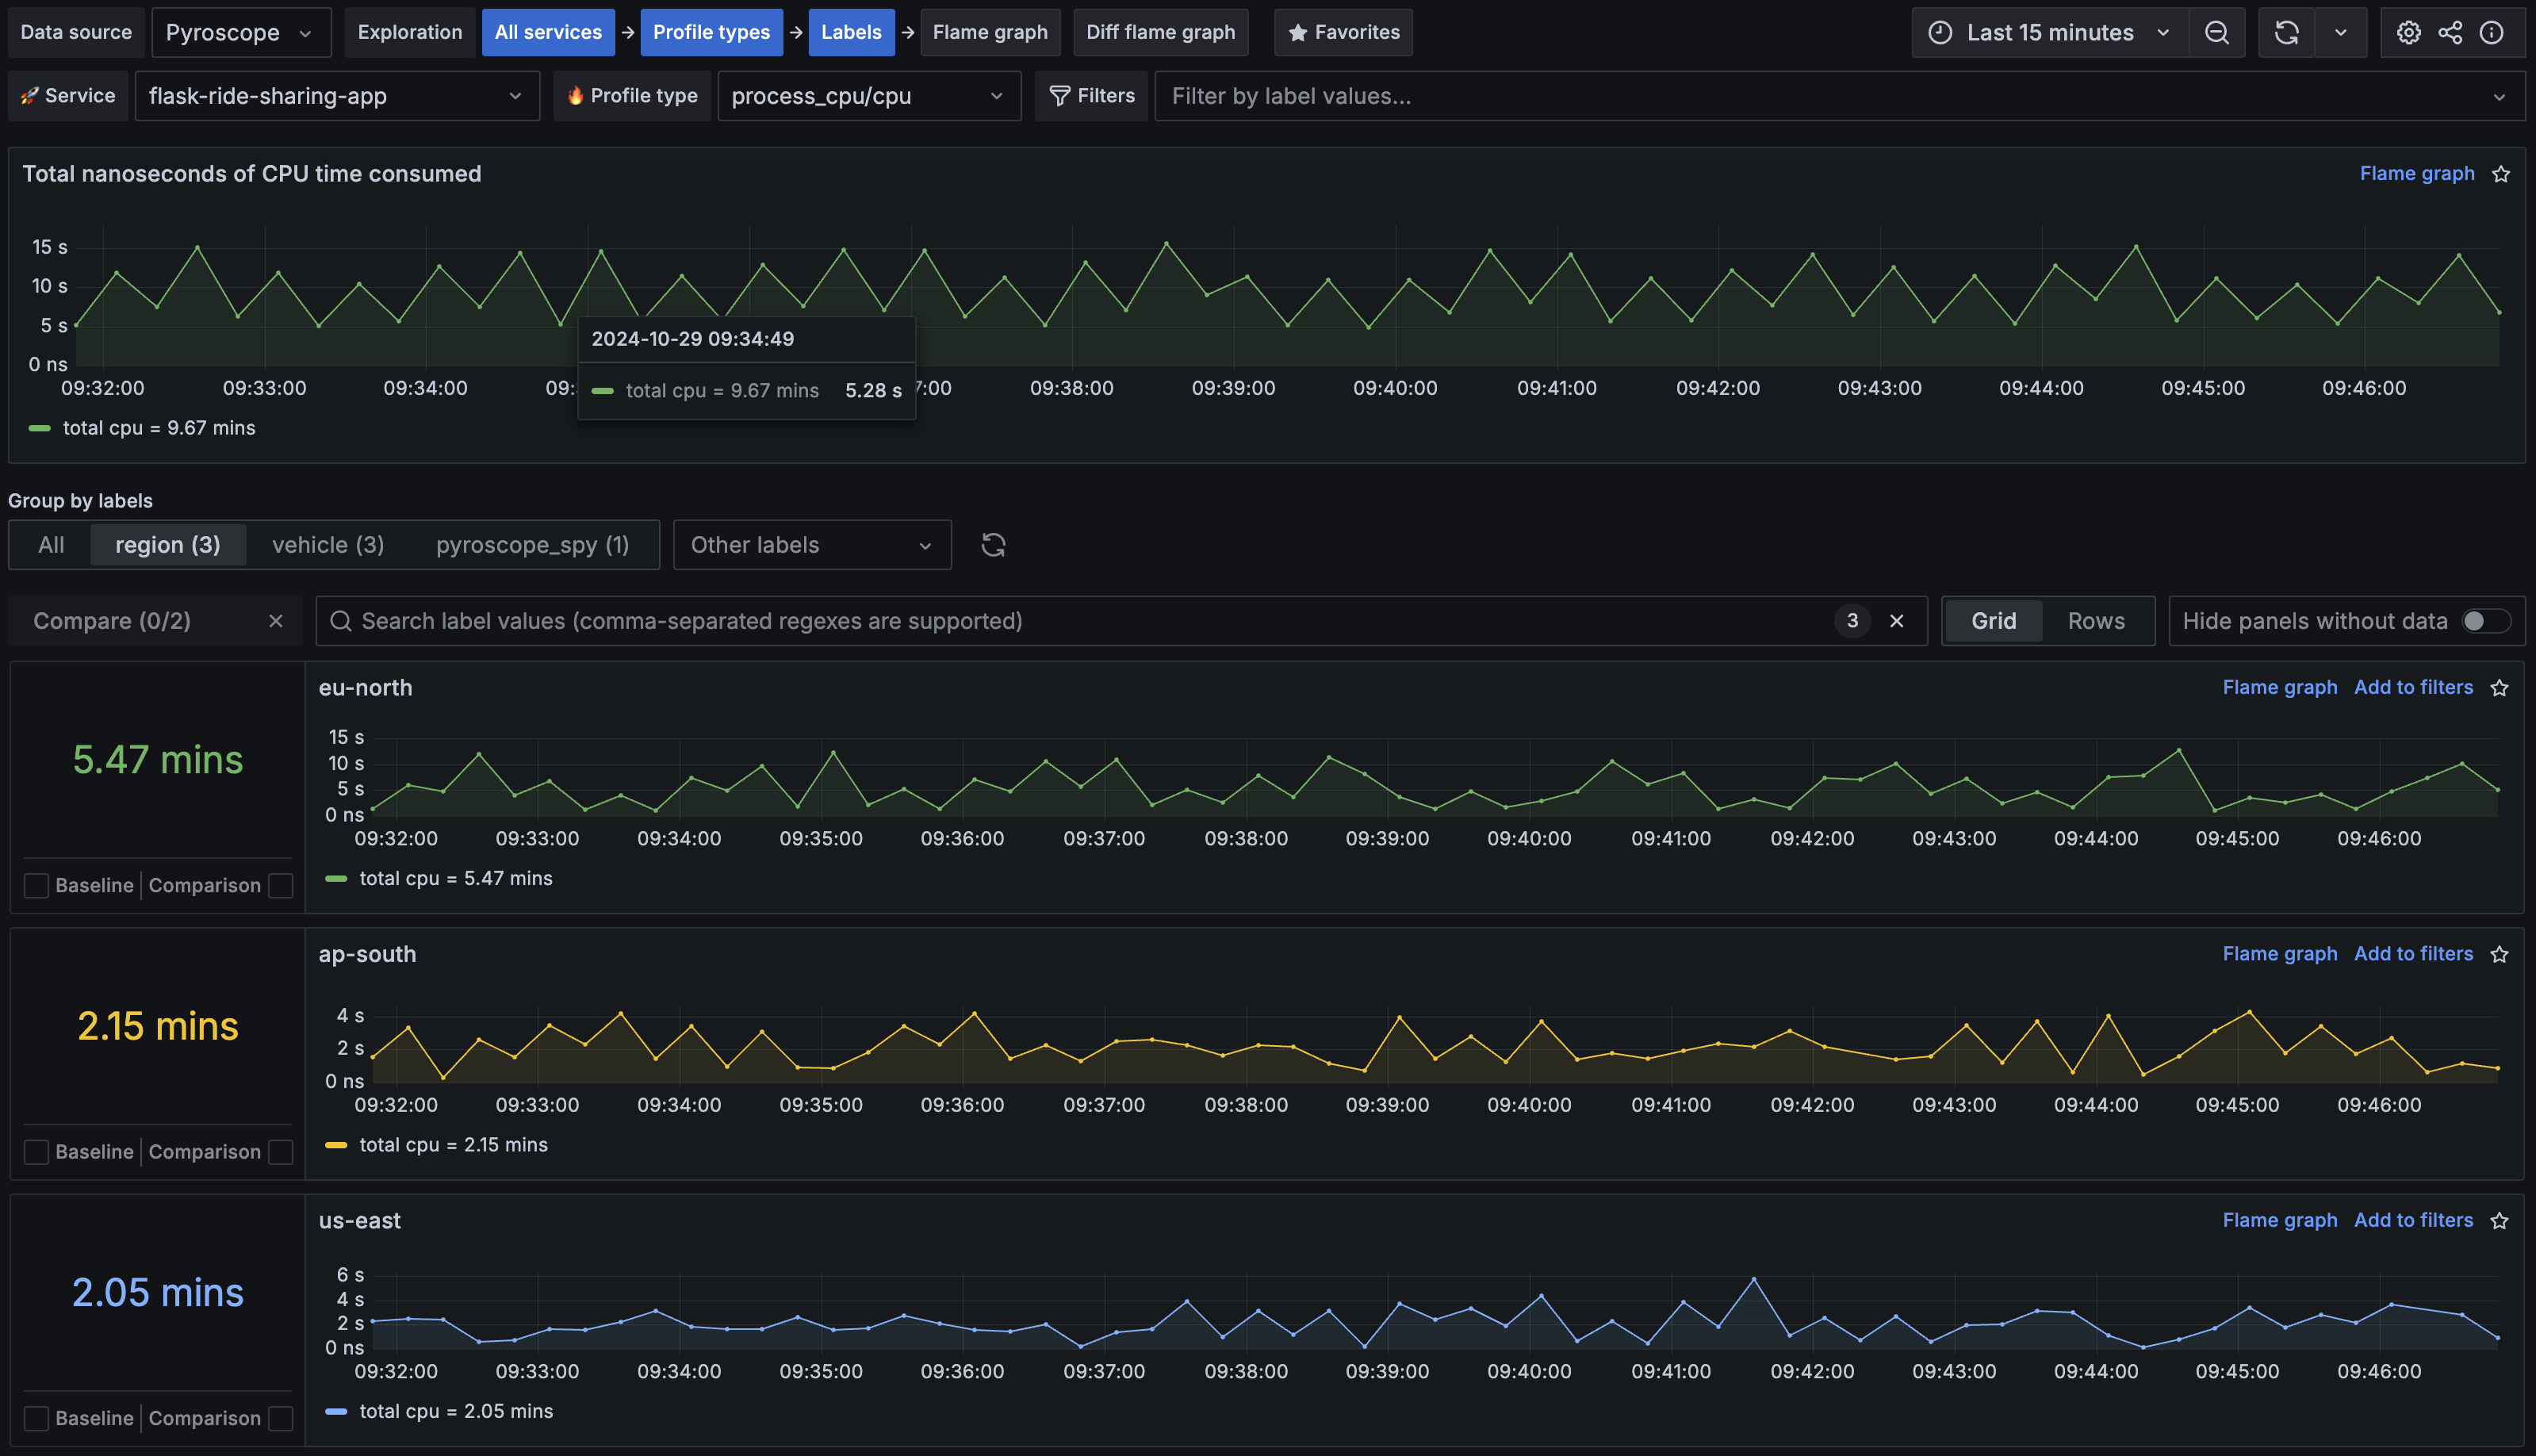
- Select the region tab in the Group by labels section.
You should now see a list of regions that the application is running in. You can see that eu-north is experiencing the most load.

Next, look at a dynamic tag use case. Within the utils.py file, find the following function:
 def find_nearest_vehicle(n, vehicle):
     with pyroscope.tag_wrapper({ "vehicle": vehicle}):
         i = 0
         start_time = time.time()
         while time.time() - start_time < n:
             i += 1
         if vehicle == "car":
             check_driver_availability(n)
This example uses tag_wrapper to tag the function with the vehicle type.
Notice that the tag is dynamic as it changes based on the vehicle type.
This is useful for grouping profiles on a per vehicle basis. Allowing us to see the performance of the application per vehicle type being requested.
Use Explore Profiles to see how this tag is used:
- Open Explore Profiles using the following url: http://localhost:3000/a/grafana-pyroscope-app/profiles-explorer.
- Select on Labels in the Exploration path.
- In the Group by labels section, select the vehicle tab.
You should now see a list of vehicle types that the application is using. You can see that car is experiencing the most load.
Identifying the performance bottleneck
The first step when analyzing a profile outputted from your application, is to take note of the largest node which is where your application is spending the most resources. To discover this, you can use the Flame graph view:
- Open Explore Profiles using the following url: http://localhost:3000/a/grafana-pyroscope-app/profiles-explorer.
- Select Flame graph from the Exploration path.
- Verify that
ride-sharing-appis selected in the Service drop-down menu andprocess_cpu/cpuin the Profile type drop-down menu.
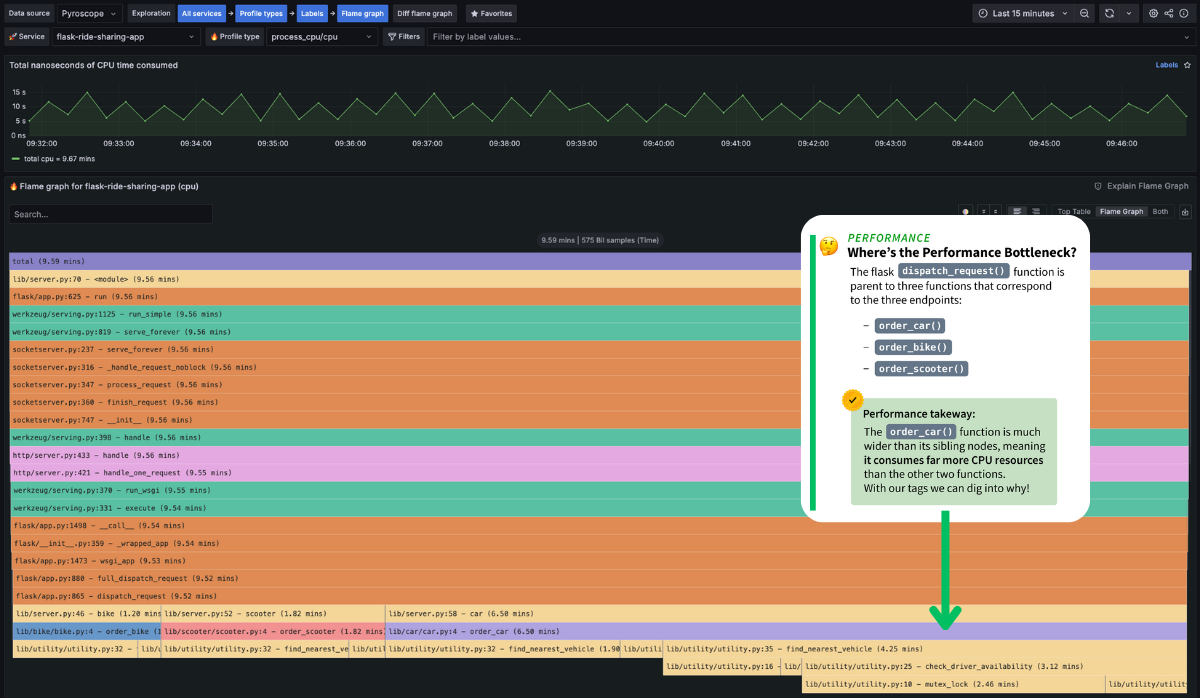
It should look something like this:

The flask dispatch_request function is the parent to three functions that correspond to the three endpoints of the application:
order_bikeorder_carorder_scooter
By tagging both region and vehicle and looking at the Labels view, you can hypothesize:
- Something is wrong with the
/carendpoint code wherecarvehicle tag is consuming 68% of CPU - Something is wrong with one of our regions where
eu-northregion tag is consuming 54% of CPU
From the flame graph, you can see that for the eu-north tag the biggest performance impact comes from the find_nearest_vehicle() function which consumes close to 68% of cpu.
To analyze this, go directly to the comparison page using the comparison dropdown.
Comparing two time periods
The Diff flame graph view lets you compare two time periods side by side.
This is useful for identifying changes in performance over time.
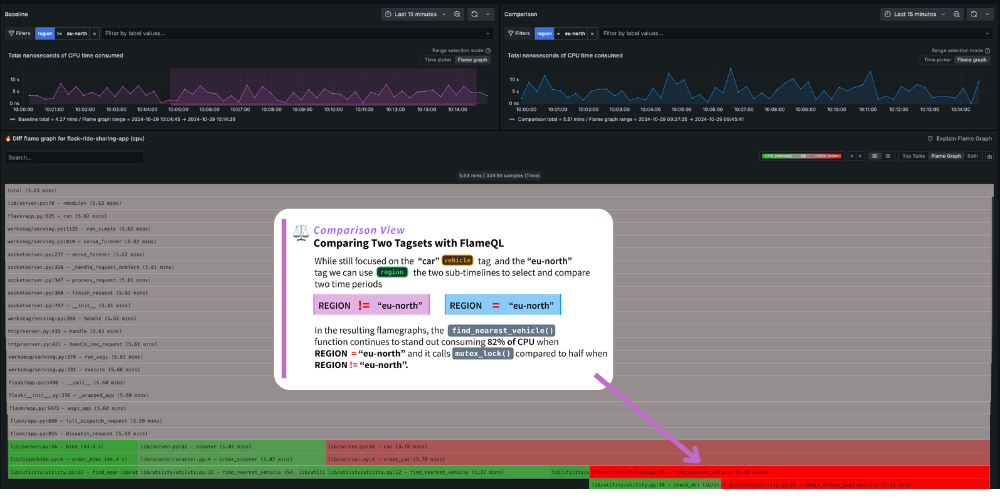
This example compares the performance of the eu-north region within a given time period against the other regions.
- Open Explore Profiles in Grafana using the following url: http://localhost:3000/a/grafana-pyroscope-app/profiles-explorer.
- Select Diff flame graph in the Exploration path.
- In Baseline, filter by
regionand select!= eu-north. - In Comparison, filter by
regionand select== eu-north. - In Baseline, select the time period you want to compare against.
Scroll down to compare the two time periods side by side.
Note that the eu-north region (right side) shows an excessive amount of time spent in the find_nearest_vehicle function.
This looks to be caused by a mutex lock that is causing the function to block.

How was Pyroscope integrated with Grafana in this tutorial?
The docker-compose.yml file includes a Grafana container that’s pre-configured with the Pyroscope plugin:
  grafana:
    image: grafana/grafana:latest
    environment:
    - GF_INSTALL_PLUGINS=grafana-pyroscope-app
    - GF_AUTH_ANONYMOUS_ENABLED=true
    - GF_AUTH_ANONYMOUS_ORG_ROLE=Admin
    - GF_AUTH_DISABLE_LOGIN_FORM=true
    volumes:
    - ./grafana-provisioning:/etc/grafana/provisioning
    ports:
    - 3000:3000
Grafana is also pre-configured with the Pyroscope data source.
Challenge
As a challenge, see if you can generate a similar comparison with the vehicle tag.
Summary
In this tutorial, you learned how to profile a simple “Ride Share” application using Pyroscope. You have learned some of the core instrumentation concepts such as tagging and how to use Explore Profiles identify performance bottlenecks.
Next steps
- Learn more about the Pyroscope SDKs and how to instrument your application with Pyroscope.
- Deploy Pyroscope in a production environment using the Pyroscope Helm chart.
- Continue exploring your profile data using Explore Profiles


