Splunk Infrastructure Monitoring data source for Grafana
The Splunk Infrastructure Monitoring data source plugin allows you to query and visualize Splunk Infrastructure Monitoring metrics from within Grafana.
Requirements
This plugin has the following requirements:
- A Splunk Infrastructure Monitoring (previously SignalFx) account
- One of the following account types:
- Available for users with a Grafana Cloud Free, Advanced or Trial account or with an activated Grafana Enterprise license.
Known limitations
There are no known limitations for this plugin.
Install the plugin
Navigate to the Splunk Infrastructure Monitoring plugin homepage.
From the left-hand menu, click the Install plugin button.
The Installation tab is displayed.
Meet compatibility requirements
For this plugin, there are no compatibility requirements.
Verify that the plugin is installed
- In Grafana Enterprise from the left-hand menu, navigate to Configuration > Data sources.
- From the top-right corner, click the Add data source button.
- Search for
Splunk Infrastructure Monitoringin the search field, and hover over the Splunk Infrastructure Monitoring search result. - Click the Select button for Splunk Infrastructure Monitoring.
- If you can click the Select button, then it is installed.
- If the button is missing or disabled, then the plugin is not installed. Check to see if your Grafana Enterprise license is valid, and reinstall the plugin. If you still need help, contact Grafana Labs.
Configure the data source in Grafana

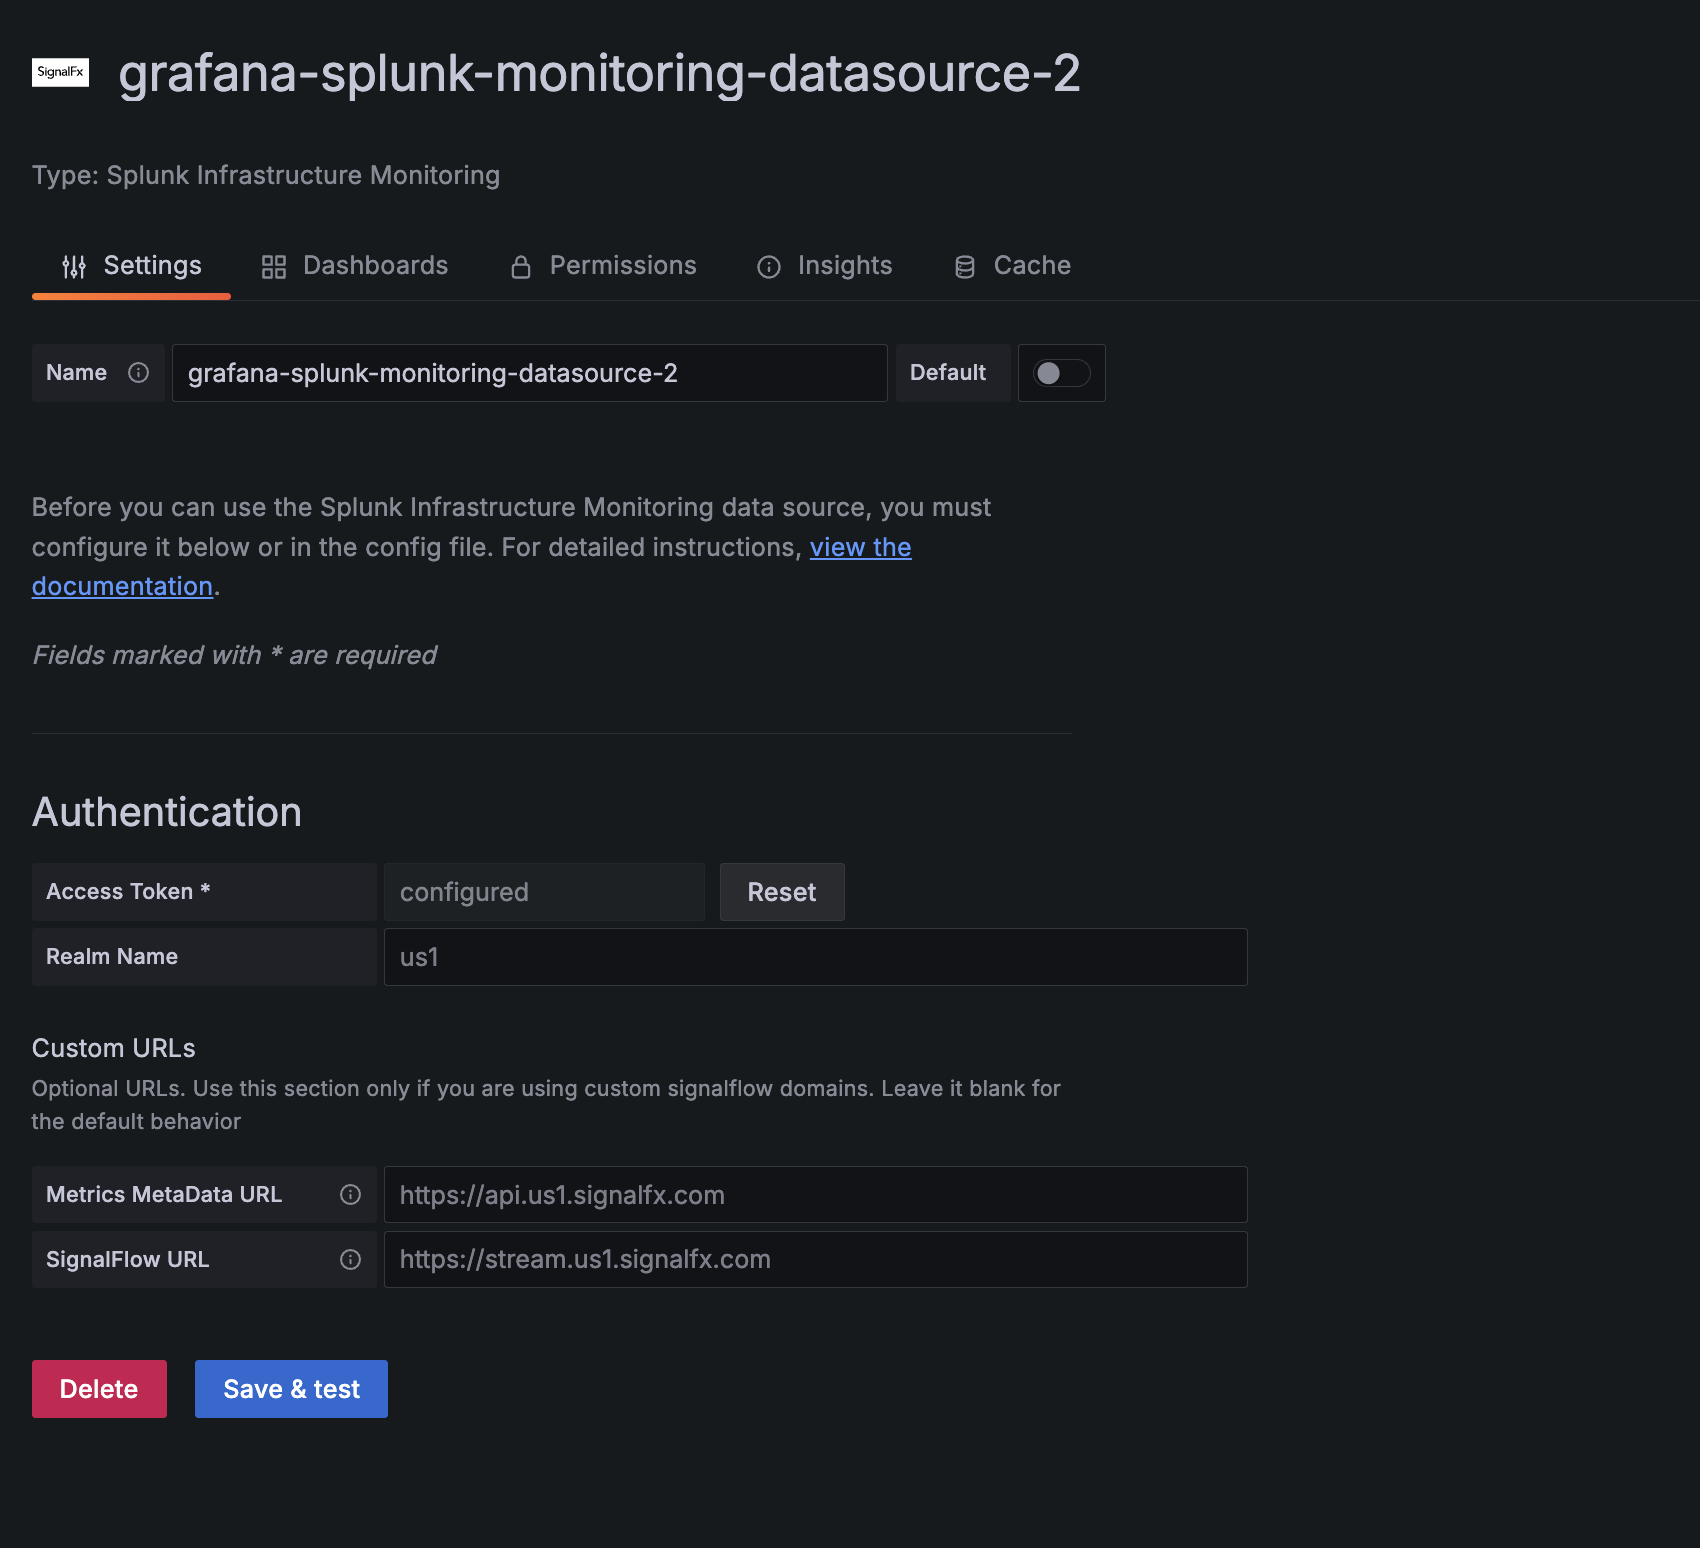
Follow these instructions to add a new Splunk Infrastructure Monitoring data source, and fill out these fields:
- Access Token
- Enter the access token generated by your SignalFx account. There are multiple types to choose from. To learn more about access token types, refer to authentication tokens.
- Realm
- Enter a realm which is a self-contained deployment that hosts your organization. You can find your realm name on your profile page when signed in to the SignalFx user interface.
Configure the data source with provisioning
It is possible to configure data sources using config files with Grafana’s provisioning system. You can read more about how it works and all the settings you can set for data sources on the provisioning docs page
Here are some provisioning examples for this data source using basic auth
apiVersion: 1
datasources:
  - name: Splunk Infrastructure Monitoring
    type: grafana-splunk-monitoring-datasource
    access: proxy
    basicAuth: false
    editable: true
    enabled: true
    jsonData:
      realmName: Realm name
    secureJsonData:
      accessToken: access token
Query the data source
The query editor accepts a SignalFlow program/query. To learn more about SignalFlow, refer to SignalFlow Analytics Language.
Using Signalflow labels
Signalflow labels will be applied as metadata to the results. For example, publish(label = 'foo') adds a label="foo" to the meta data.
Templates and variables
To add a new Splunk Infrastructure Monitoring query variable, refer to Add a query variable. Use your Splunk Infrastructure Monitoring data source as your data source and select one of the following query types:
- Dimensions
- Choose a dimension name from the dropdown list. To learn more about dimensions, refer to dimension.
- Metrics
- To learn more about dimensions, refer to metric.
- Tags
- To learn more about dimensions, refer to tag.
After creating a variable, you can use it in your Splunk Infrastructure Monitoring queries by using Variable syntax. For more information about variables, refer to Templates and variables.
Learn more
- Add Annotations.
- Configure and use Templates and variables.
- Add Transformations.
- Set up alerting; refer to Alerts overview.
Additional annotations help
When creating Annotations, use SignalFlow Alerts or Events queries.
Example of getting Alerts for a detector:
alerts((detector_name = 'Deployment')).publish();Example of getting custom Events by type:
events((eventType = 'simulated')).publish();


