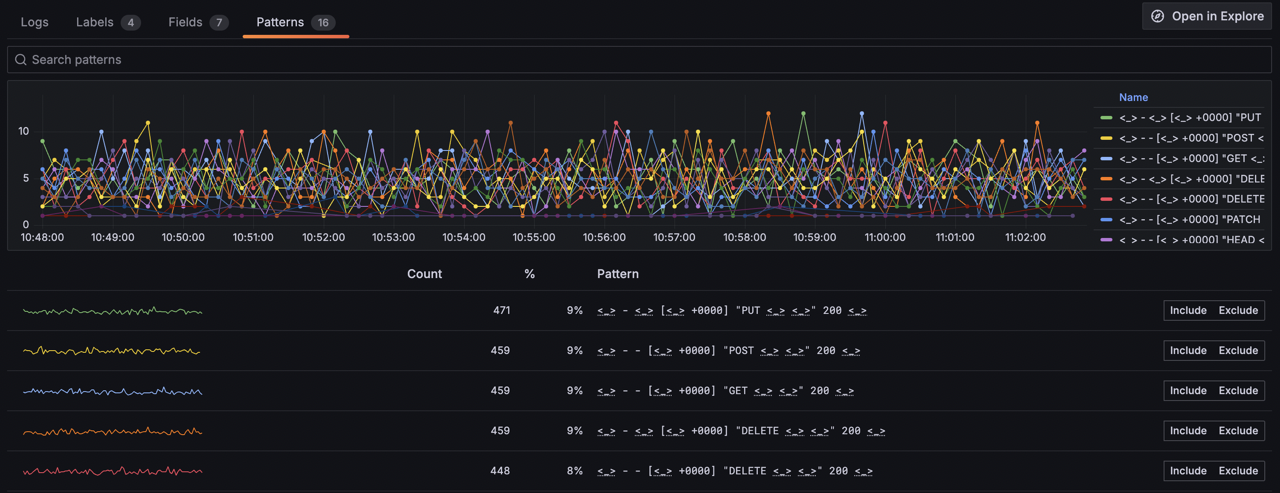
Log patterns
Log patterns let you work with groups of similar log lines. You can hide log patterns that are noisy, or focus only on the patterns that are most useful.
Loki automatically extracts patterns when your logs are ingested. Patterns are ephemeral and are only mined from the previous three hours of your logs.

The Grafana Logs Drilldown app shows you the patterns alongside their log volumes. From this view, you can investigate spikes and include or exclude specific log lines from your view.
Patterns can change over time as your logging evolves.
Use cases
Log patterns let you:
- Browse the log volume over time of different types of logs.
- Simplify log management by grouping similar log entries.
- Enhance log searches by focusing on relevant patterns.
- Improve troubleshooting efficiency by highlighting critical log lines.
- Reduce storage requirements by minimizing log data.
- Filter out noisy log lines during exploration.
- Identify specific log lines for targeted analysis.
Guided tour of log patterns
We’ve outlined the steps you’ll need to take to perform some common use cases.
Browse log volumes by type
Grafana Logs Drilldown proactively visualizes your log volume data per detected pattern, broken down in various ways. At a glance you can immediately spot spikes or other changes.
For example, if your HTTP service is suffering from a DDoS attack, the relevant graphs will clearly show the spikes. From here you can drill down to discover enough details about the attack to counter it.
Target your analysis
If you know the kind of log line you’re looking for, log patterns are an easy way to remove unwanted log lines from the view.
To view only a specific set of patterns, perform the following steps:
- From the Grafana main menu, select Explore > Logs.
- Select the relevant Service. (No services?)
- On the service details page, click the Patterns tab.
- Identify a pattern that matches the type of logs you’re interested in viewing. (No patterns?)
- Click the Include button for the pattern.
- Return to the Logs tab and notice the filtered view.
You can repeat steps 4 and 5 to include multiple patterns.
Hide noisy log lines
To hide noisy log lines, perform the following steps:
- From the Grafana main menu, select Explore > Logs.
- Select the relevant Service. (No services?)
- On the service details page, click the Patterns tab.
- Identify a pattern that represents noise in the logs that you want to remove. (No patterns?)
- Click the Exclude button to exclude that pattern.
- Return to the Logs tab and notice the noisy pattern has been removed.
You can repeat steps 4 and 5 to exclude multiple patterns.
Pattern extraction
Loki extracts patterns from a stream of log lines.
For example, if your service logs lines like this:
duration=255ms trace_id=abc001 GET /path/to/endpoint/2
user loaded: 25666
user loaded: 14544
duration=255ms trace_id=abc002 POST /path/to/endpoint/2
user loaded: 25666
duration=355ms trace_id=abc003 GET /path/to/endpoint/1
duration=355ms trace_id=abc004 POST /path/to/endpoint/1
duration=255ms trace_id=abc005 POST /path/to/endpoint/2
user loaded: 89255
duration=4244ms trace_id=abc006 GET /path/to/endpoint/1
user loaded: 25666
duration=255ms trace_id=abc007 GET /path/to/endpoint/2
Two patterns would emerge where the static tokens are preserved literally, and dynamic values are turned into placeholders:
Pattern 1: duration=<_> trace_id=<_> <_> /path/to/endpoint/<_>
Pattern 2: user loaded: <_>
Note
Since Loki 3.0, you can make queries using this simplified pattern match filter operator which is much faster than using regex.
What next?
See how Grafana Logs Drilldown works on your own data by following our Get started guide.


