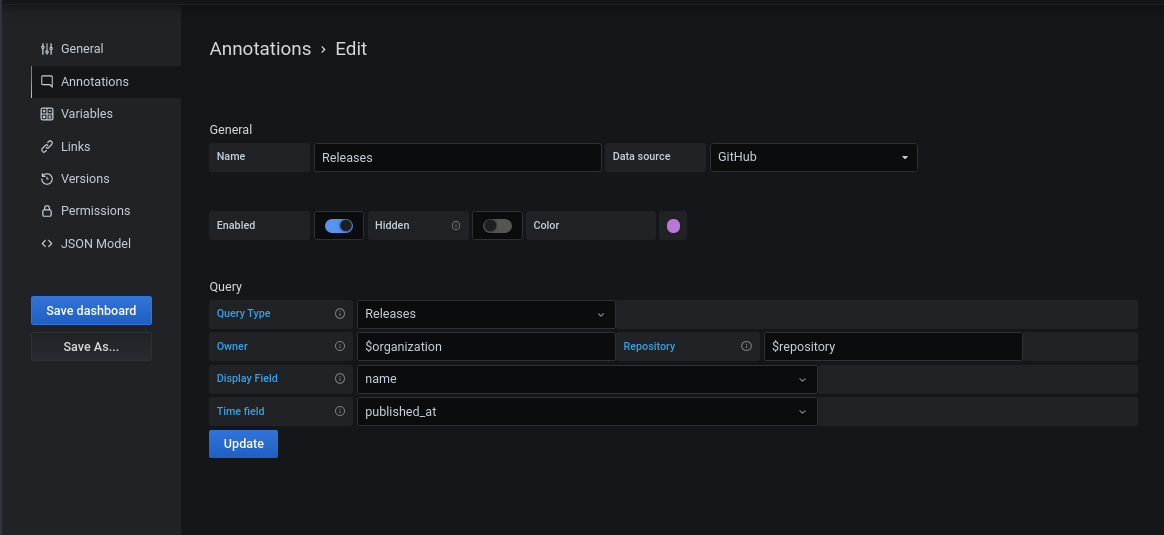
Create annotations with GitHub data source plugin for Grafana
Annotations let you extract data from a data source and use it to annotate a dashboard.
To create annotations, you need to specify at least the following two fields:
- A String field for the annotation text
- A Time field for the annotation time
Annotations overlay events on a graph.

With annotations, you can display the following GitHub resources on a graph:
- Commits
- Issues
- Pull requests
- Releases
- Tags
All annotations require that you select a field to display on the annotation, and a field that represents the time that the event occurred.

If you want to add titles or tags to the annotations, you can add additional fields with the appropriate types.
For more information on how to configure a query, refer to Built-in query editor.
Pull Requests and Issue times when creating annotations
While using annotations for pull request and issues, there two selection options. This is because as there are two times that affect an annotation:
- The time range of the dashboard or panel
- The time that should be used to display the event on the graph
The first selection is used to filter the events that display on the graph.
For example, if you select “closed at”, only events that were “closed” in your dashboard’s time range will be displayed on the graph.
The second selection is used to determine where on the graph the event should be displayed.
Typically these will be the same, however there are some cases where you may want them to be different.


