Kubernetes Monitoring Helm tutorial
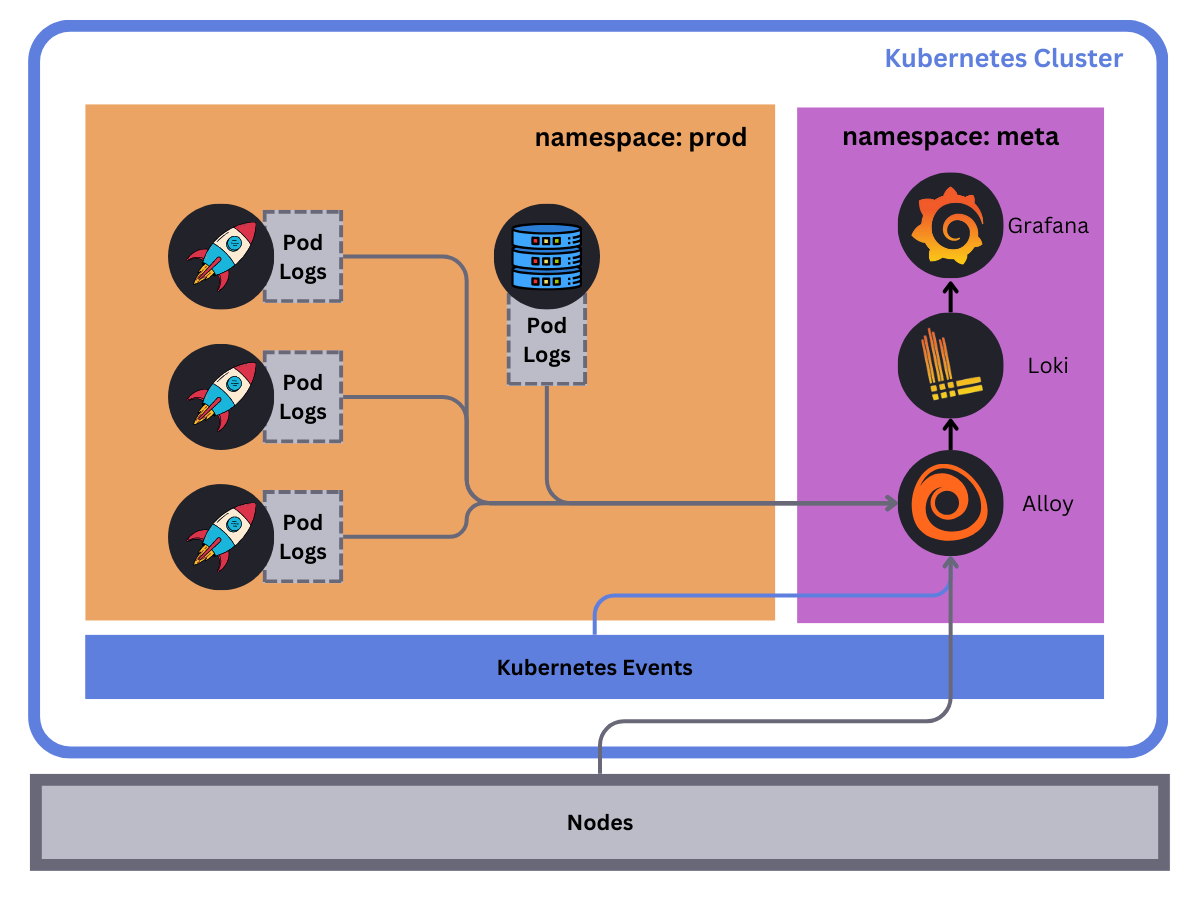
One of the primary use cases for Loki is to collect and store logs from your Kubernetes cluster. These logs fall into three categories:
- Pod logs: Logs generated by pods running in your cluster.
- Kubernetes Events: Logs generated by the Kubernetes API server.
- Node logs: Logs generated by the nodes in your cluster.

In this tutorial, we will deploy Loki and the Kubernetes Monitoring Helm chart to collect two of these log types: Pod logs and Kubernetes events. We will also deploy Grafana to visualize these logs.
Things to know
Before you begin, here are some things you should know:
- Loki: Loki can run in a single binary mode or as a distributed system. In this tutorial, we will deploy Loki as a single binary, otherwise known as monolithic mode. Loki can be vertically scaled in this mode depending on the number of logs you are collecting. Grafana Labs recommends running Loki in a distributed/microservice mode for production use cases to monitor high volumes of logs.
- Deployment: You will deploy Loki, Grafana, and Alloy (as part of the Kubernetes Monitoring Helm chart) in the
metanamespace of your Kubernetes cluster. Make sure you have the necessary permissions to create resources in this namespace. These pods will also require resources to run, so consider the amount of capacity your nodes have available. It also possible to just deploy the Kubernetes monitoring Helm chart (since it has a minimal resource footprint) within your cluster and write logs to an external Loki instance or Grafana Cloud. - Storage: In this tutorial, Loki will use the default object storage backend provided in the Loki Helm chart; MinIO. You should migrate to a more production-ready storage backend like S3, GCS, Azure Blob Storage or a MinIO Cluster for production use cases.
Prerequisites
Before you begin, you will need the following:
- A Kubernetes cluster running version
1.23or later. - kubectl installed on your local machine.
- Helm installed on your local machine.
Tip
Alternatively, you can try out this example in our interactive learning environment: Kubernetes Monitoring with Loki.
It’s a fully configured environment with all the dependencies already installed.
Provide feedback, report bugs, and raise issues in the Grafana Killercoda repository.
Create the meta and prod namespaces
The K8s Monitoring Helm chart will monitor two namespaces: meta and prod:
metanamespace: This namespace will be used to deploy Loki, Grafana, and Alloy.prodnamespace: This namespace will be used to deploy the sample application that will generate logs.
Create the meta and prod namespaces by running the following command:
kubectl create namespace meta && kubectl create namespace prodAdd the Grafana Helm repository
All three Helm charts (Loki, Grafana, and the Kubernetes Monitoring Helm) are available in the Grafana Helm repository. Add the Grafana Helm repository by running the following command:
helm repo add grafana https://grafana.github.io/helm-charts && helm repo updateAs well as adding the repo to your local helm list, you should also run helm repo update to ensure you have the latest version of the charts.
Clone the tutorial repository
Clone the tutorial repository by running the following command:
git clone https://github.com/grafana/alloy-scenarios.gitThen change directories to the alloy-scenarios/k8s/logs directory:
cd alloy-scenarios/k8s/logsThe rest of this tutorial assumes you are in the alloy-scenarios/k8s/logs directory.
Deploy Loki
Grafana Loki will be used to store our collected logs. In this tutorial we will deploy Loki with a minimal footprint and use the default storage backend provided by the Loki Helm chart, MinIO.
To deploy Loki run the following command:
helm install --values loki-values.yml loki grafana/loki -n metaThis command will deploy Loki in the meta namespace. The command also includes a values file that specifies the configuration for Loki. For more details on how to configure the Loki Helm chart refer to the Loki Helm documentation.
Deploy Grafana
Next we will deploy Grafana to the meta namespace. You will use Grafana to visualize the logs stored in Loki. To deploy Grafana run the following command:
helm install --values grafana-values.yml grafana grafana/grafana --namespace metaAs before, the command also includes a values file that specifies the configuration for Grafana. There are two important configuration attributes to take note of:
adminUserandadminPassword: These are the credentials you will use to log in to Grafana. The values areadminandadminadminadminrespectively. The recommended practice is to either use a Kubernetes secret or allow Grafana to generate a password for you. For more details on how to configure the Grafana Helm chart, refer to the Grafana Helm documentation.datasources: This section of the configuration lets you define the data sources that Grafana should use. In this tutorial, you will define a Loki data source. The data source is defined as follows:datasources: datasources.yaml: apiVersion: 1 datasources: - name: Loki type: loki access: proxy orgId: 1 url: http://loki-gateway.meta.svc.cluster.local:80 basicAuth: false isDefault: false version: 1 editable: false
This configuration defines a data source named Loki that Grafana will use to query logs stored in Loki. The url attribute specifies the URL of the Loki gateway. The Loki gateway is a service that sits in front of the Loki API and provides a single endpoint for ingesting and querying logs. The URL is in the format http://loki-gateway.<NAMESPACE>.svc.cluster.local:80. The loki-gateway service is created by the Loki Helm chart and is used to query logs stored in Loki. If you choose to deploy Loki in a different namespace or with a different name, you will need to update the url attribute accordingly.
Deploy the Kubernetes Monitoring Helm chart
The Kubernetes Monitoring Helm chart is used for gathering, scraping, and forwarding Kubernetes telemetry data to a Grafana stack. This includes the ability to collect metrics, logs, traces, and continuous profiling data. The scope of this tutorial is to deploy the Kubernetes Monitoring Helm chart to collect pod logs and Kubernetes events.
To deploy the Kubernetes Monitoring Helm chart run the following command:
helm install --values ./k8s-monitoring-values.yml k8s grafana/k8s-monitoring -n meta Within the configuration file k8s-monitoring-values.yml we have defined the following:
---
cluster:
  name: meta-monitoring-tutorial

destinations:
  - name: loki
    type: loki
    url: http://loki-gateway.meta.svc.cluster.local/loki/api/v1/push


clusterEvents:
  enabled: true
  collector: alloy-logs
  namespaces:
    - meta
    - prod

nodeLogs:
  enabled: false

podLogs:
  enabled: true
  gatherMethod: kubernetesApi
  collector: alloy-logs
  labelsToKeep: ["app_kubernetes_io_name","container","instance","job","level","namespace","service_name","service_namespace","deployment_environment","deployment_environment_name"]
  structuredMetadata:
    pod: pod  # Set structured metadata "pod" from label "pod"
  namespaces:
    - meta
    - prod

# Collectors
alloy-singleton:
  enabled: false

alloy-metrics:
  enabled: false

alloy-logs:
  enabled: true
  # Required when using the Kubernetes API to pod logs
  alloy:
    mounts:
      varlog: false
    clustering:
      enabled: true

alloy-profiles:
  enabled: false

alloy-receiver:
  enabled: false
To break down the configuration file:
- Define the cluster name as
meta-monitoring-tutorial. This a static label that will be attached to all logs collected by the Kubernetes Monitoring Helm chart. - Define a destination named
lokithat will be used to forward logs to Loki. Theurlattribute specifies the URL of the Loki gateway. If you choose to deploy Loki in a different namespace or in a different location entirely, you will need to update theurlattribute accordingly. - Enable the collection of cluster events and pod logs:
collector: specifies which collector to use to collect logs. In this case, we are using thealloy-logscollector.labelsToKeep: specifies the labels to keep when collecting logs. Note this does not drop logs. This is useful when you do not want to apply a high cardanility label. In this case we have removedpodfrom the labels to keep.structuredMetadata: specifies the structured metadata to collect. In this case, we are setting the structured metadatapodso we can retain the pod name for querying. Though it does not need to be indexed as a label.zwnamespaces: specifies the namespaces to collect logs from. In this case, we are collecting logs from themetaandprodnamespaces.
- Disable the collection of node logs for the purpose of this tutorial as it requires the mounting of
/var/log/journal. This is out of scope for this tutorial. - Lastly, define the role of the collector. The Kubernetes Monitoring Helm chart will deploy only what you need and nothing more. In this case, we are telling the Helm chart to only deploy Alloy with the capability to collect logs. If you need to collect K8s metrics, traces, or continuous profiling data, you can enable the respective collectors.
Accessing Grafana
To access Grafana, you will need to port-forward the Grafana service to your local machine. To do this, run the following command:
export POD_NAME=$(kubectl get pods --namespace meta -l "app.kubernetes.io/name=grafana,app.kubernetes.io/instance=grafana" -o jsonpath="{.items[0].metadata.name}") && \
kubectl --namespace meta port-forward $POD_NAME 3000 --address 0.0.0.0
Tip
This will make your terminal unusable until you stop the port-forwarding process. To stop the process, press
Ctrl + C.
This command will port-forward the Grafana service to your local machine on port 3000.
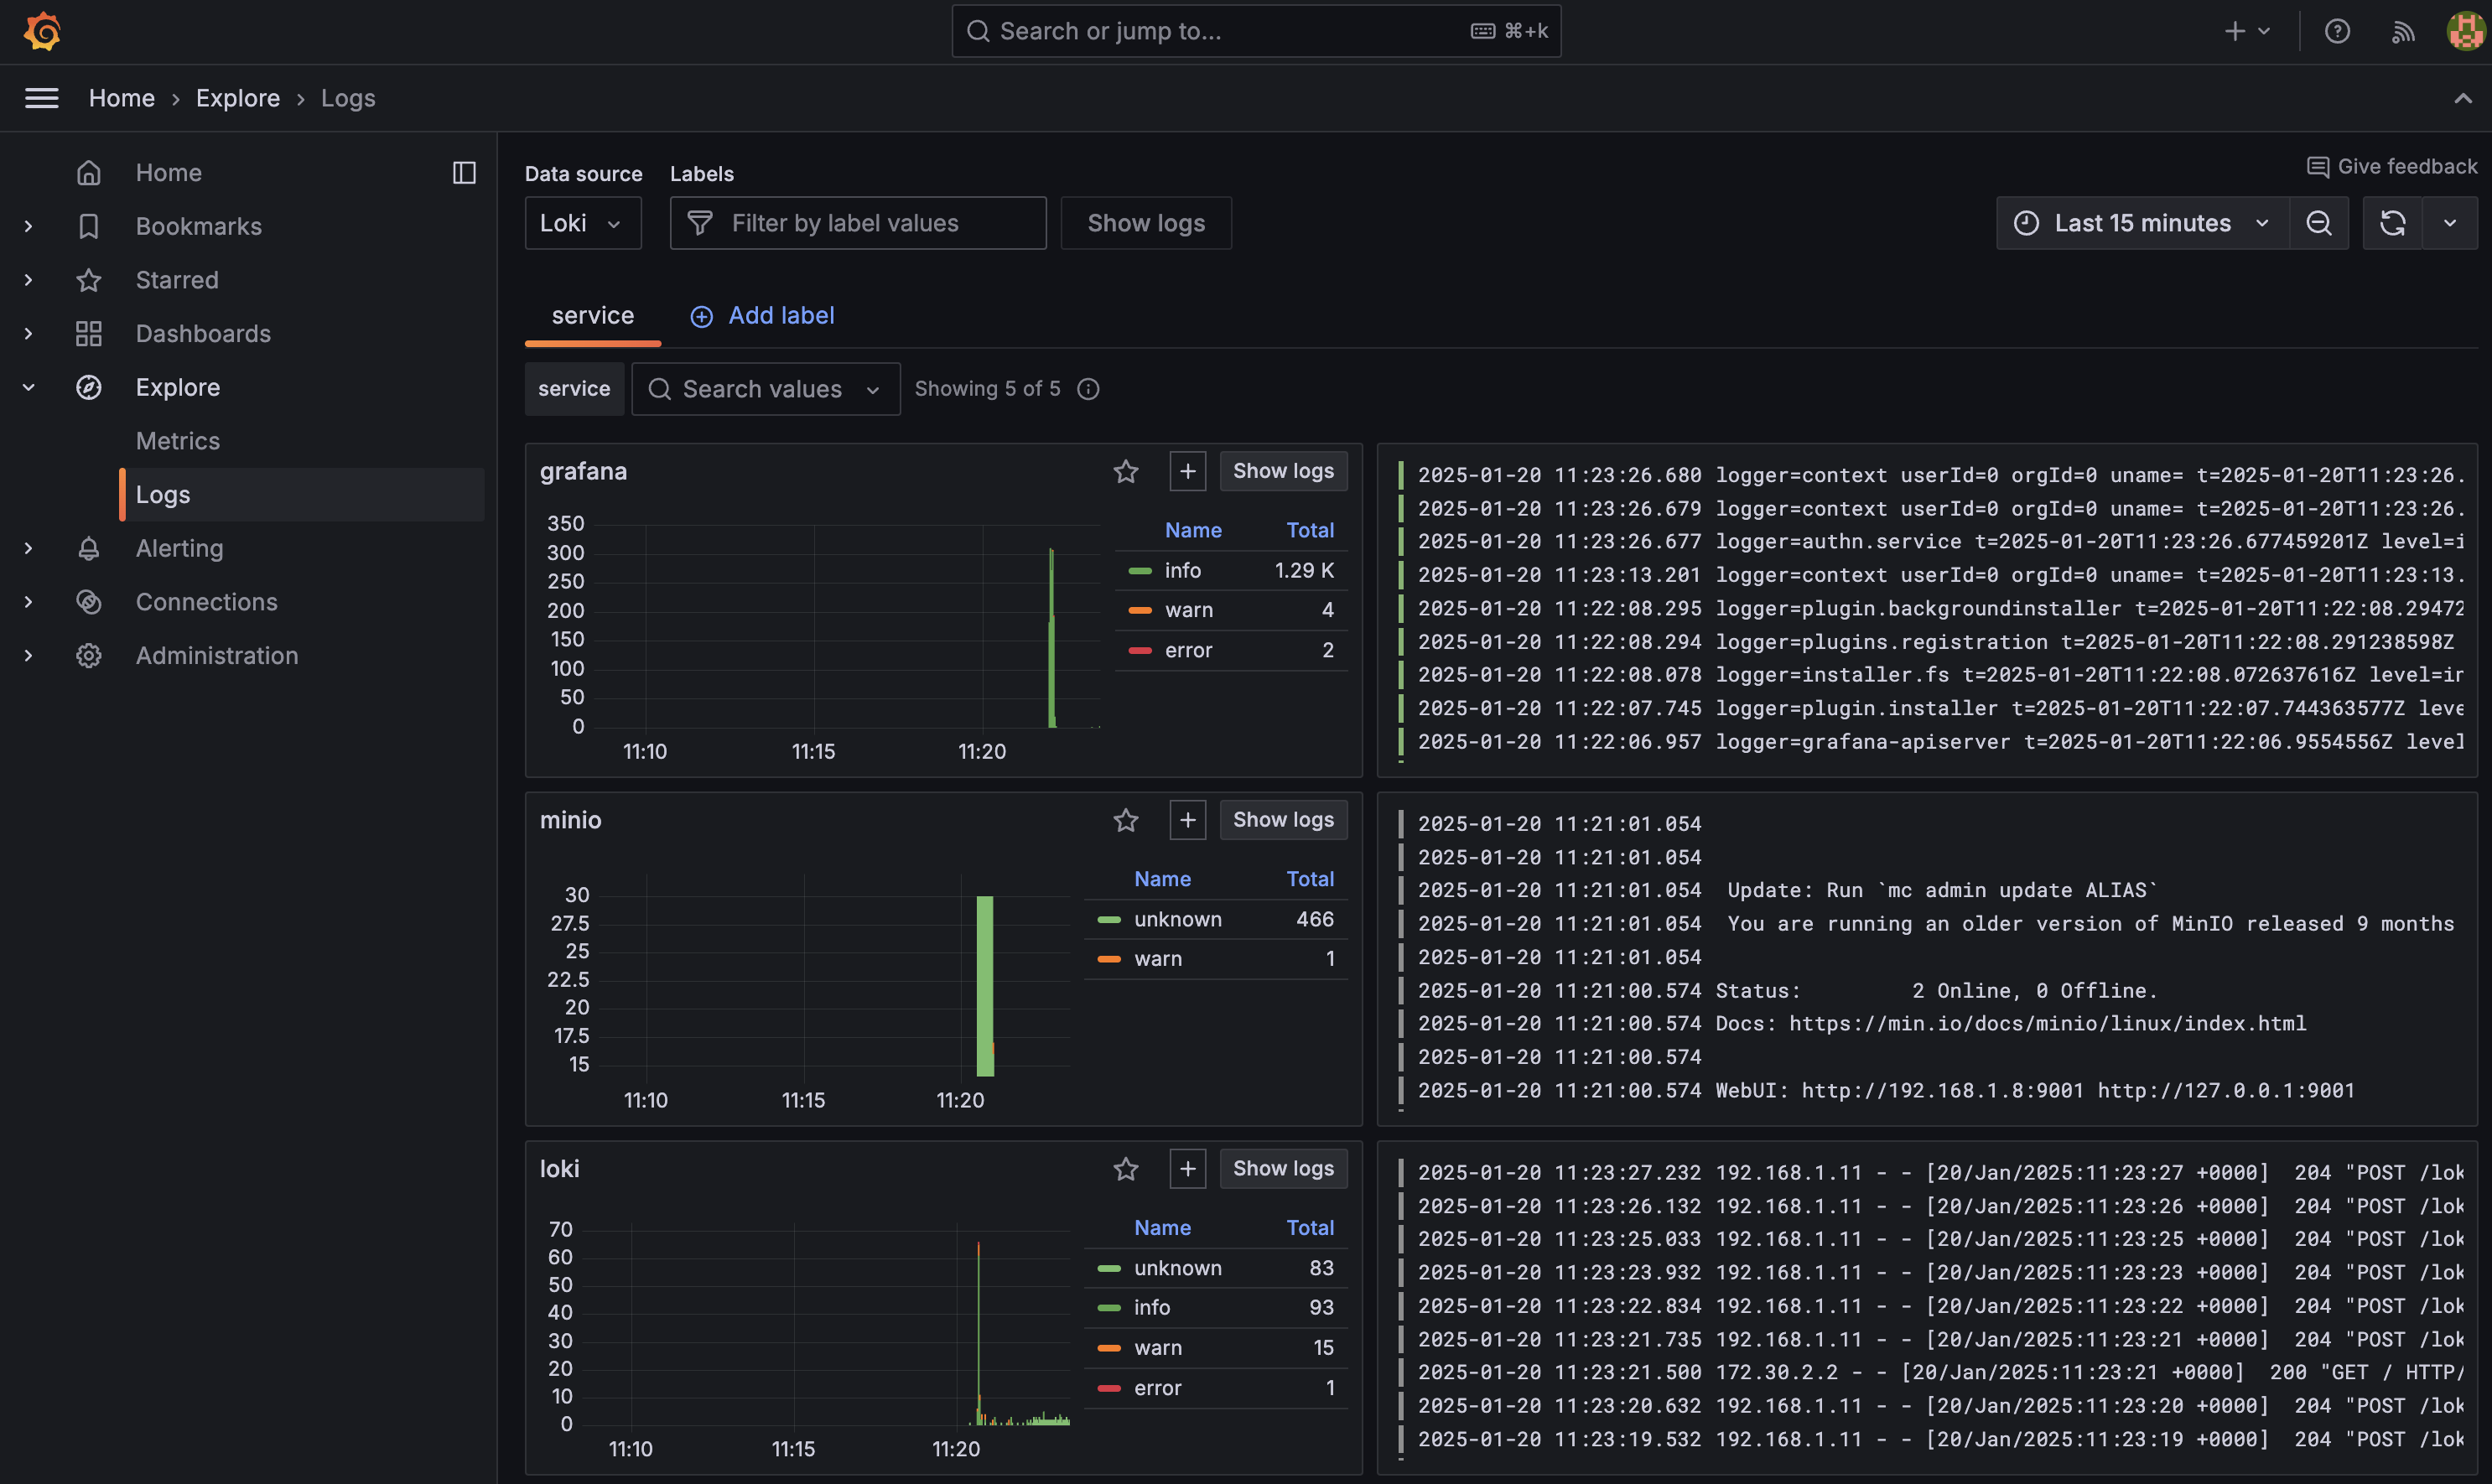
You can now access Grafana by navigating to http://localhost:3000 in your browser. The default credentials are admin and adminadminadmin.
One of the first places you should visit is Explore Logs which lets you automatically visualize and explore your logs without having to write queries: http://localhost:3000/a/grafana-lokiexplore-app

(Optional) View the Alloy UI
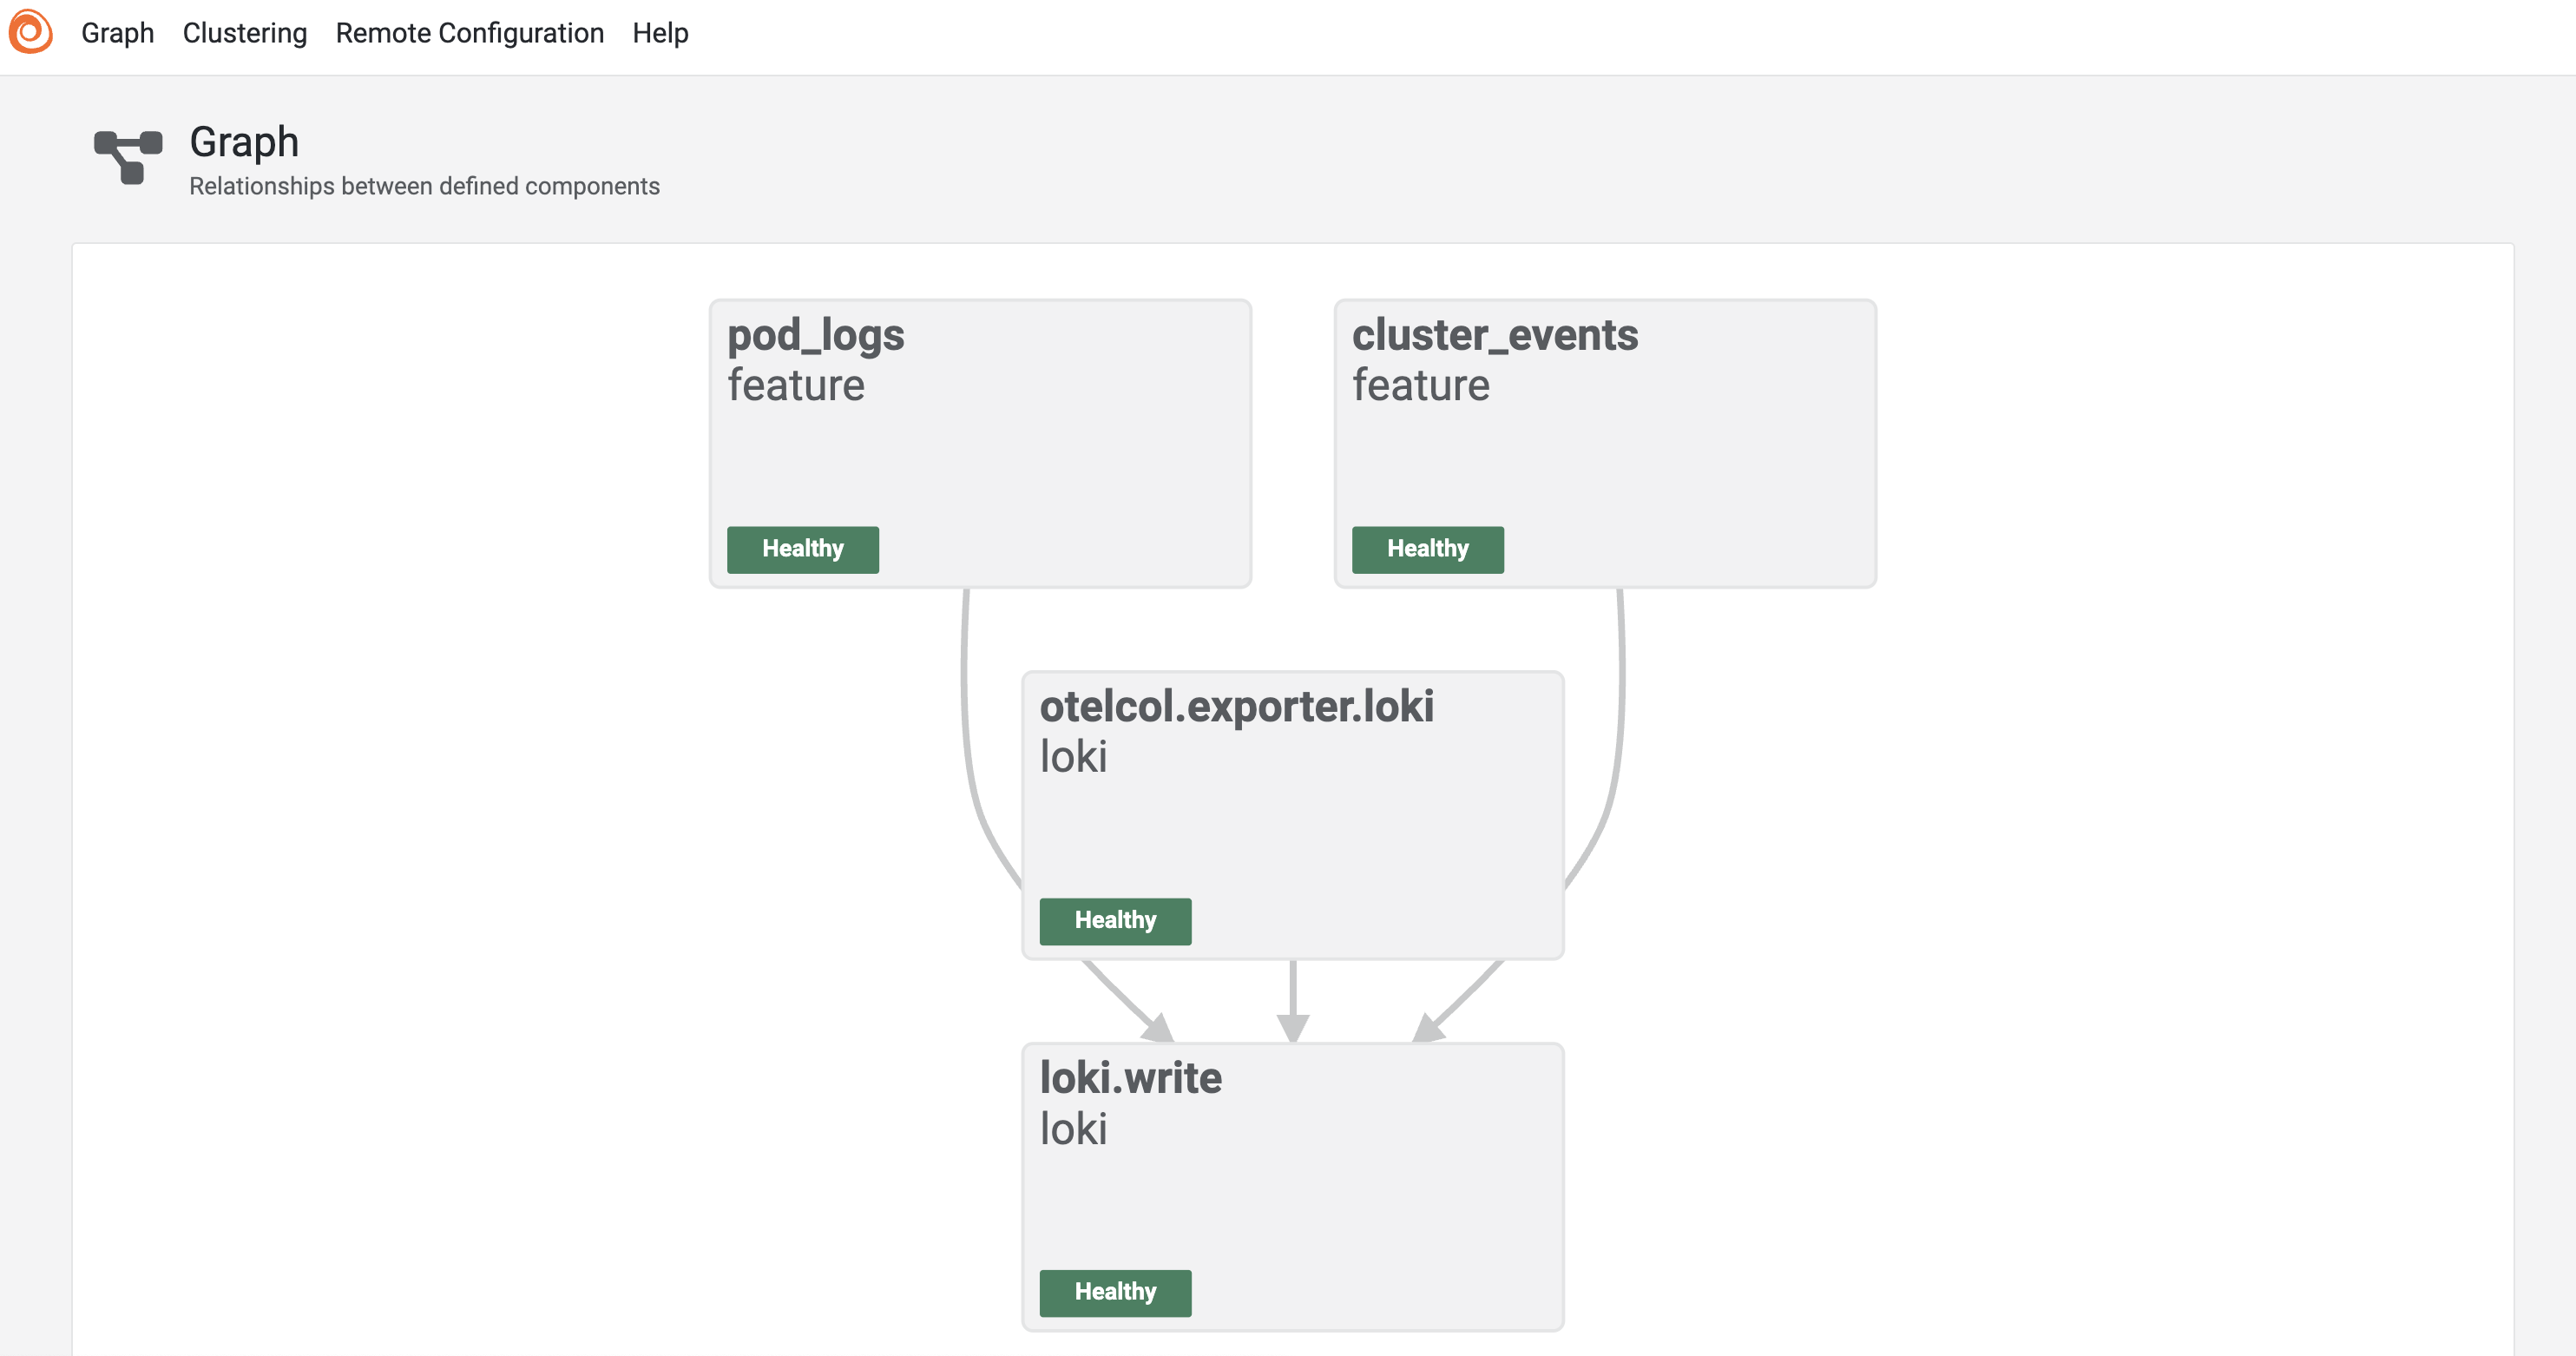
The Kubernetes Monitoring Helm chart deploys Grafana Alloy to collect and forward telemetry data from the Kubernetes cluster. The Helm chart is designed to abstract you away from creating an Alloy configuration file. However if you would like to understand the pipeline you can view the Alloy UI. To access the Alloy UI, you will need to port-forward the Alloy service to your local machine. To do this, run the following command:
export POD_NAME=$(kubectl get pods --namespace meta -l "app.kubernetes.io/name=alloy-logs,app.kubernetes.io/instance=k8s" -o jsonpath="{.items[0].metadata.name}") && \
kubectl --namespace meta port-forward $POD_NAME 12345 --address 0.0.0.0
Tip
This will make your terminal unusable until you stop the port-forwarding process. To stop the process, press
Ctrl + C.
This command will port-forward the Alloy service to your local machine on port 12345. You can access the Alloy UI by navigating to http://localhost:12345 in your browser.

Adding a sample application to prod
Finally, lets deploy a sample application to the prod namespace that will generate some logs. To deploy the sample application run the following command:
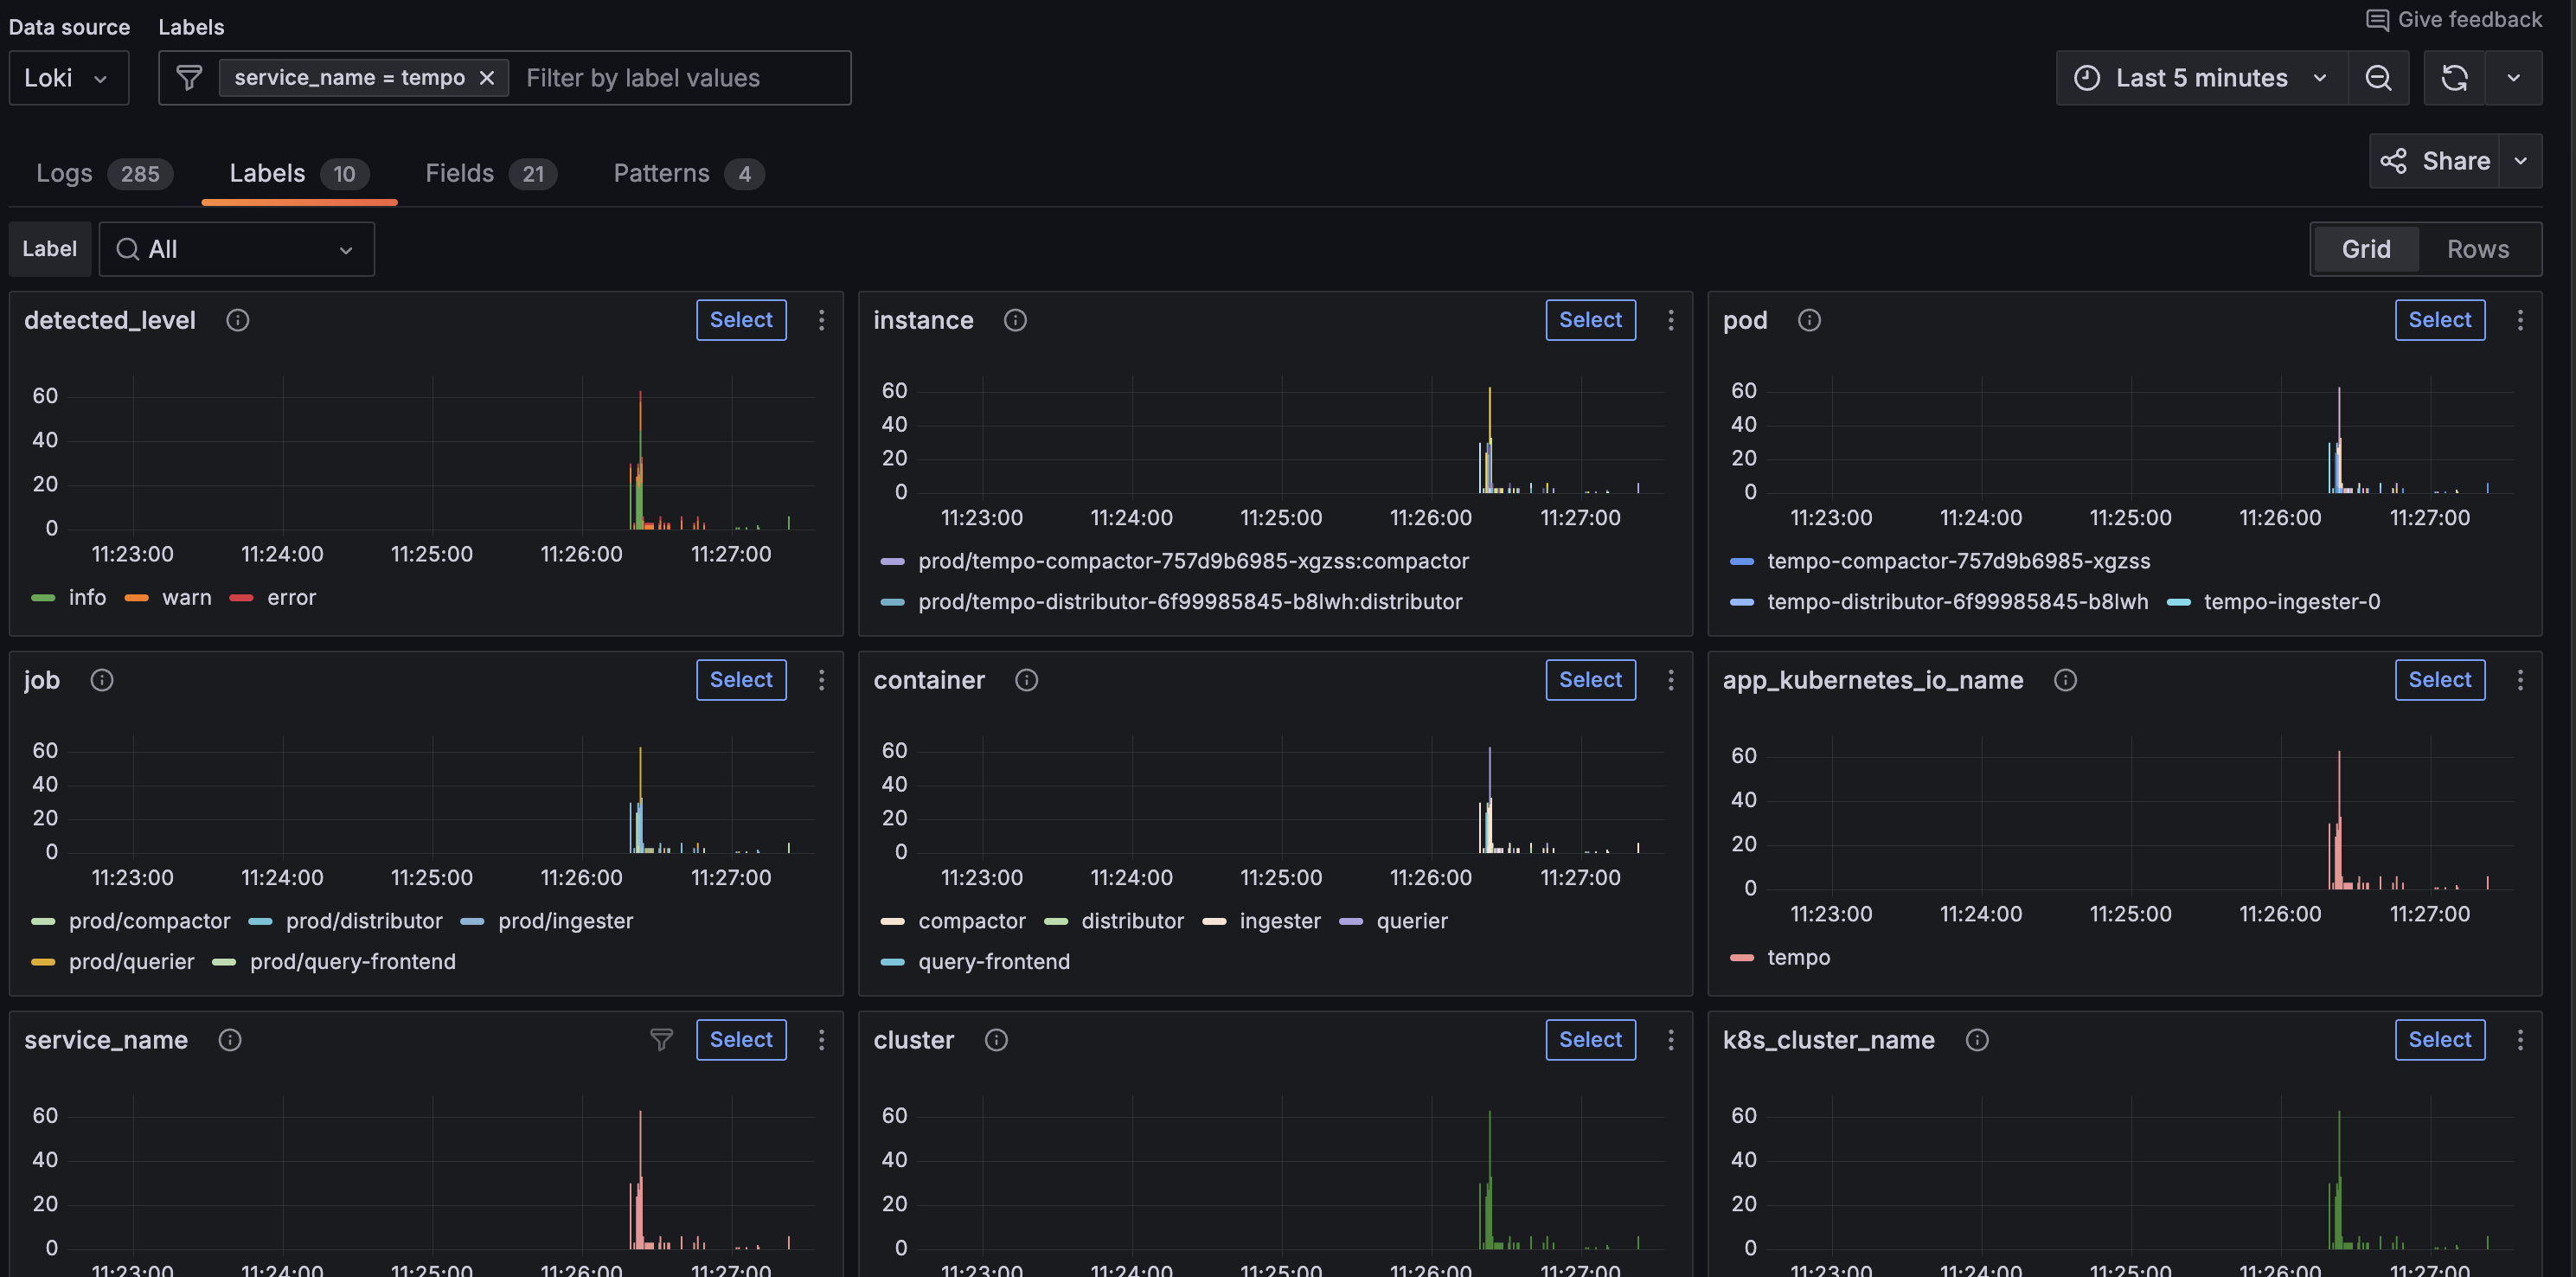
helm install tempo grafana/tempo-distributed -n prodThis will deploy a default version of Grafana Tempo to the prod namespace. Tempo is a distributed tracing backend that is used to store and query traces. Normally Tempo would sit alongside Loki and Grafana in the meta namespace, but for the purpose of this tutorial, we will pretend this is the primary application generating logs.
Once deployed lets expose Grafana once more:
export POD_NAME=$(kubectl get pods --namespace meta -l "app.kubernetes.io/name=grafana,app.kubernetes.io/instance=grafana" -o jsonpath="{.items[0].metadata.name}") && \
kubectl --namespace meta port-forward $POD_NAME 3000 --address 0.0.0.0
and navigate to http://localhost:3000/a/grafana-lokiexplore-app to view Grafana Tempo logs.

Conclusion
In this tutorial, you learned how to deploy Loki, Grafana, and the Kubernetes Monitoring Helm chart to collect and store logs from a Kubernetes cluster. We have deployed a minimal test version of each of these Helm charts to demonstrate how quickly you can get started with Loki. It is now worth exploring each of these Helm charts in more detail to understand how to scale them to meet your production needs:


