Important: This documentation is about an older version. It's relevant only to the release noted, many of the features and functions have been updated or replaced. Please view the current version.
What’s new in Grafana v9.5
Welcome to Grafana 9.5! We’re excited to share some major updates to Grafana’s navigation, tons of usability improvements to Alerting, and some promising experiments to help you query your Prometheus metrics. Also, read on to learn about our continued migration from API keys to service accounts, as well as deprecation of plugins that use Angular and a field in the InfluxDB data source.
For more detail about all the changes in this release, refer to the changelog. For the specific steps we recommend when you upgrade to v9.5, check out our Upgrade Guide.
Grafana’s new navigation is generally available
Generally available in all editions of Grafana.
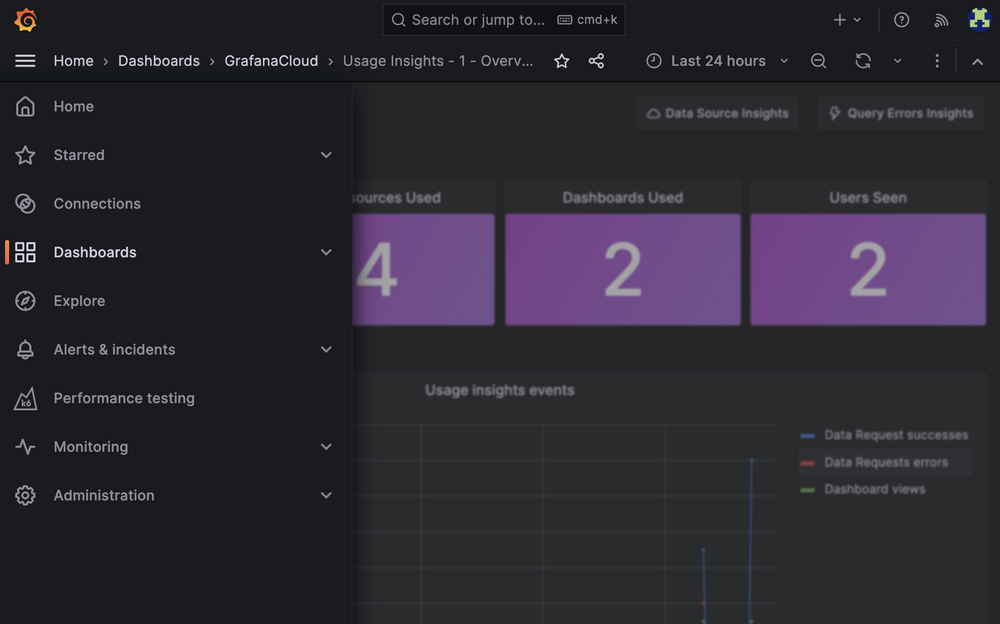
The navigation in Grafana has been updated with a new design and an improved structure to make it easier for you to access the data you need. With this update, you can quickly navigate between pages, giving you full visibility into the health of your systems.
As Grafana evolved from a visualization platform to a comprehensive observability solution, we added numerous tools to support users throughout the software development life cycle. These tools focus on preventing incidents, monitoring applications or infrastructure, and aiding incident response. However, the added functionality must be easily discoverable and navigable to be truly helpful. These key updates to Grafana’s navigation experience help address this:
- A redesigned navigation menu that groups related tools together for easy access.
- A command palette you can use to take actions in Grafana, like creating a dashboard or navigating to an app or page.
- Updated layouts featuring breadcrumbs and a sidebar, allowing you to quickly jump between pages.
- A new header that appears on all pages in Grafana, which includes a search function.
Join the discussion on GitHub and share your feedback.
Dashboards and visualizations
Redesigned empty dashboard state
Generally available in all editions of Grafana.
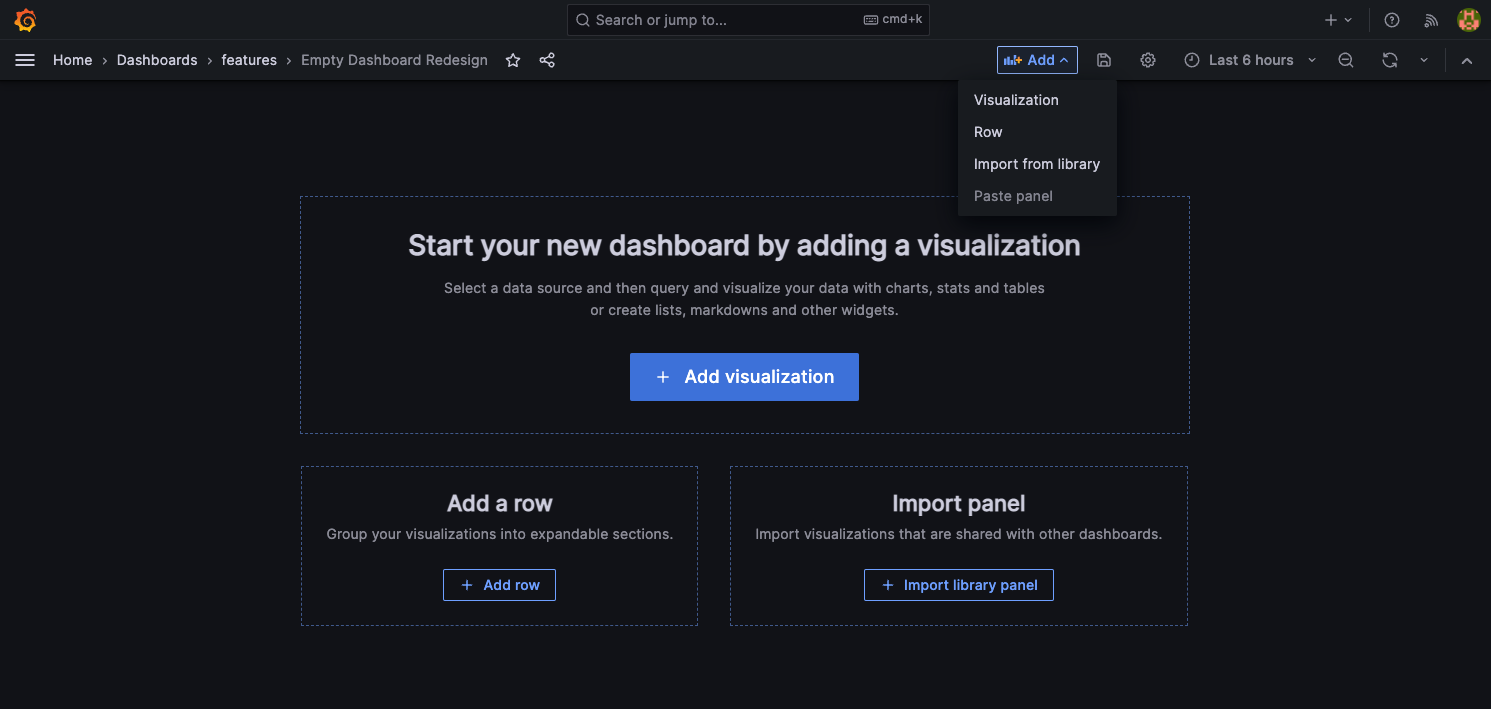
Dashboards have been updated so that it’s easier to begin building from scratch. The options displayed when you add a new dashboard—adding a visualization, a row, or importing panels—each include brief explanations of what those steps will do, so you can begin building with confidence.
Also, a text Add dropdown with these options has replaced the previous “+” icon at the top of the dashboard. This makes it clearer that this element allows you not only to add new panels, but to take all the actions associated with building a new dashboard.
Redesigned dashboard panel is generally available
Generally available in all editions of Grafana.
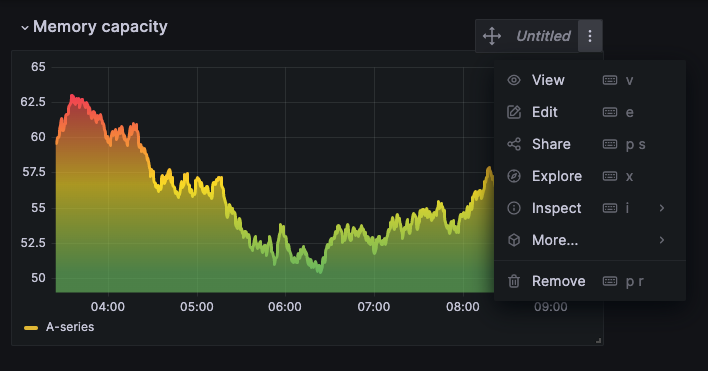
Dashboard panels contain a lot of information, some of which is difficult to discover or access from the dashboard. With our redesigned panels, we’ve improved accessibility and made it easier to understand the status of a panel by adding and moving key elements.
We’ve improved panels without titles, made panel descriptions and errors more succinct, and linked key actions from the header of the panel. All of these are laid out from left to right in a row, so there are no overlapping, unusable components.
Grafana’s new panel design is available only for React-based panels. No Angular-based panels, like the legacy Graph and Worldmap panels, are redesigned. As a reminder, Angular is deprecated in Grafana and will be removed in a future release. See our deprecation docs for more information.
Prometheus performance and usability improvements
Prometheus metric encyclopedia
Experimental in all editions of Grafana.
When you have thousands (or millions) of Prometheus metrics, it can be hard to find the exact one you’re looking for. Enable feature toggle prometheusMetricEncyclopedia to replace the basic metric select dropdown in the Prometheus query builder with a paginated and searchable metric encyclopedia.
Here’s what you can do with the metric encyclopedia:
- Fuzzy search for metrics by name, type, and description
- Filter metrics by Prometheus types (gauge, counter, histogram, summary)
- Display metrics in a paginated list, sort the results, and choose a number of results per page, so that you don’t wait a long time for search results
- View metric details, like type and description
- [Expert feature] Search metric names by regex using the backend only
Prometheus browser cache
Experimental in all editions of Grafana.
New feature toggle prometheusResourceBrowserCache provides the ability to cache Prometheus editor API calls in the Prometheus data source configuration.
This improves Prometheus query editor performance, with the biggest performance improvements seen by users with high cardinality Prometheus instances.
Removal of API key creation from the UI
With this update we are going one step further in deprecating API keys in favor of service accounts. We’ve removed the button for creating new API keys through Grafana’s user interface, and now only allow the creation of API keys using our HTTP API. We recommend that you migrate your existing API keys to service accounts, and opt for new service accounts instead of new API keys. This change is part of our long-term strategy for sunsetting API keys.
Learn more about the deprecation strategy for API keys and how to manage them in our Sunsetting API keys GitHub issue.
Resolve Grafana issues faster with support bundles
Generally available in all editions of Grafana.
Support bundles provide a simple way to collect information about your Grafana instance through Grafana’s user interface. In a few clicks, you can create a support bundle containing data about migrations, plugins, settings, and more. Once you’ve created a support bundle, you can either examine it yourself, or share it with your colleagues or Grafana engineers to aid in troubleshooting of your Grafana instance.
Learn more about support bundles and how to configure them in our support bundle documentation.

Alerting
All Alerting improvements are generally available in all editions of Grafana.
Search for alert rules from multiple data sources
Search for and display alert rules for multiple data sources at the same time.
Fuzzy search on the Alert rule list view
Search for namespaces or folders, evaluation groups, and alert rule names on the Alert rules list view with immediate results, and regardless of typos.
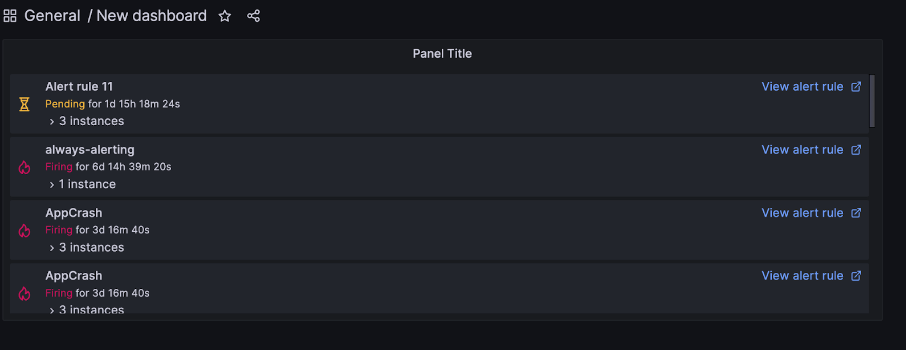
Access an alert rule from a dashboard or a panel
Navigate to an alert rule directly from a dashboard or a panel to easily access the alert rule details.
Access a dashboard or panel from an alert rule
Navigate from an alert rule straight to a dashboard or a panel associated with the alert rule to visualize your alerting data.
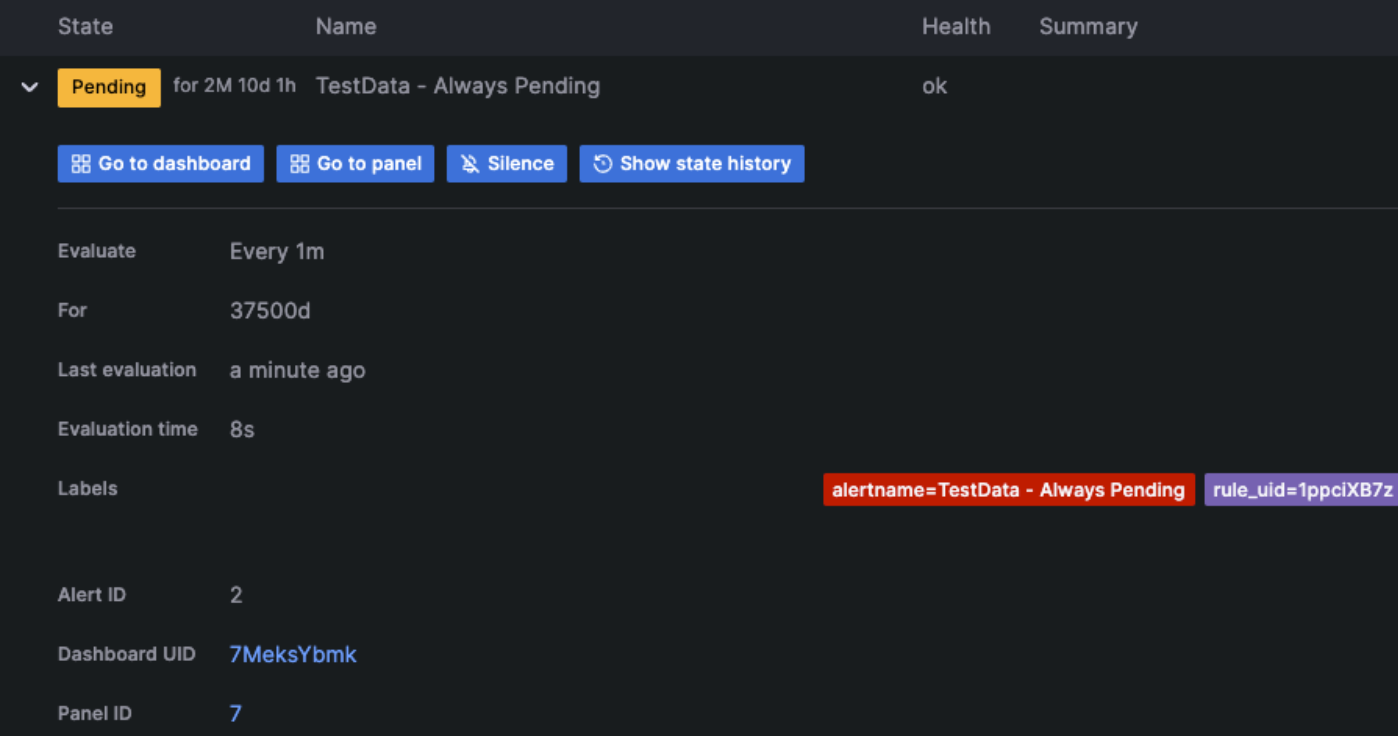
Preview queries for recording rules
Visualize queries when creating or editing recording rules, so you can see the results of your query before saving your recording rule.
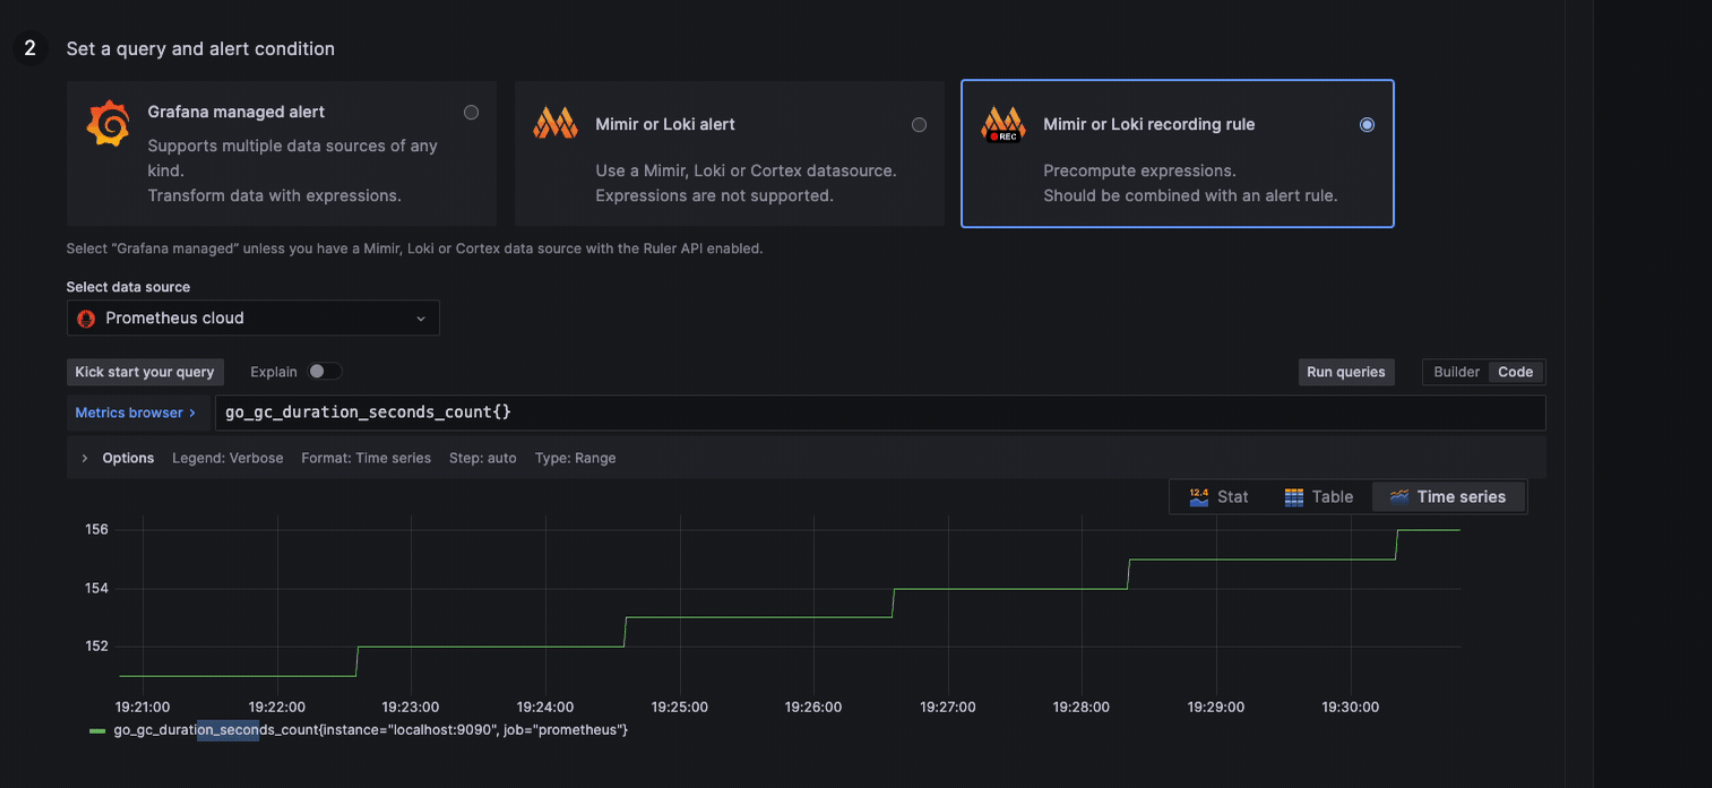
Updated alert behavior when an evaluation returns no data
Alert rules that are configured to fire when an evaluation returns no data now only fire when the entire duration of the evaluation period has finished. This means that rather than immediately firing when the alert rule condition is breached, the alert rule waits until the time set in the For field has finished and then fires, reducing alert noise and allowing for temporary data availability issues.
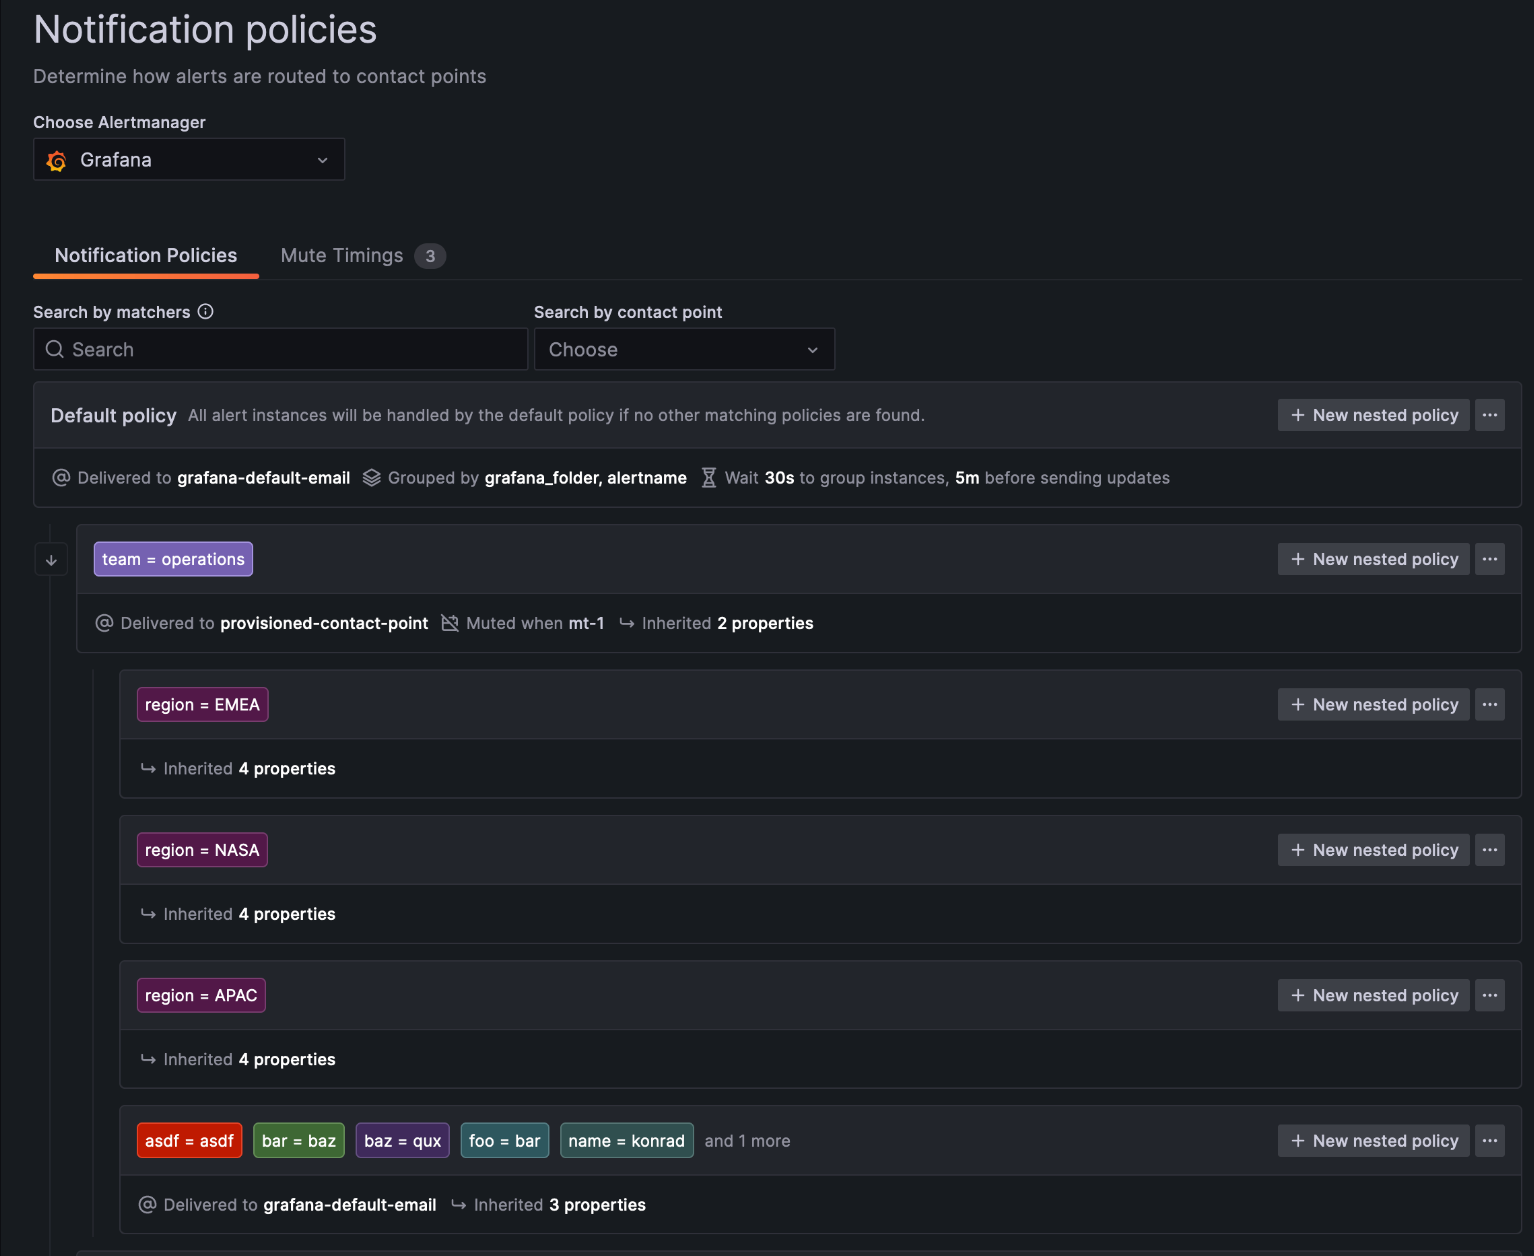
Improved Notification policies view
Updates to the Notification policies view make it easier to use and manage in the following ways:
- View default policy and nested policies at a glance
- New tab for mute timings
- View alert instances for each policy
- View contact points and which integrations are configured for each policy
- View inherited properties on nested policies
- Search for label matchers and for contact points to see which notifications are going where
Guidance for configuring your Alertmanager
Get additional help while configuring your Alertmanager. If you enter an invalid Alertmanager configuration, an error message displays, and you can choose from a previous working configuration to restart it.
InfluxDB plugin database field deprecation
The database field in the provisioning file has been deprecated.
This information will be stored in the jsonData field using the dbName property.
The database field will be removed in the future to make InfluxDB consistent with other data sources.
For more information and examples please refer to the InfluxDB Provisioning docs.
Auth: Lock organization roles synced from auth providers
Generally available in all editions of Grafana.
Grafana v9.4 provided the ability to configure synchronization of organization roles for each OAuth provider. With synchronization on, the organization role was applied to the user from the OAuth provider upon signing in. However, after the user signed in, you could still change the user’s organization role during the session.
With this release, we are reinforcing organization role syncing behavior by introducing a new feature toggle called onlyExternalOrgRoleSync. Once enabled, users signing in to Grafana cannot change organization roles that have been synchronized from an external authentication provider, like Active Directory or Google OAuth. This can help ensure the right users maintain the right level of access at all times.
This feature should be used if you want to enforce strict role synchronization from your auth provider to the organization roles.
To use this feature, enable the onlyExternalOrgRoleSync feature toggle. If you’re using Grafana Cloud and would like to enable this feature, please contact customer support. We’ll also be automatically enabling this feature for Grafana Cloud instances over the upcoming weeks.
You can also prevent the synchronization of organization roles from a given authentication provider. Learn more in our skip org role sync documentation.
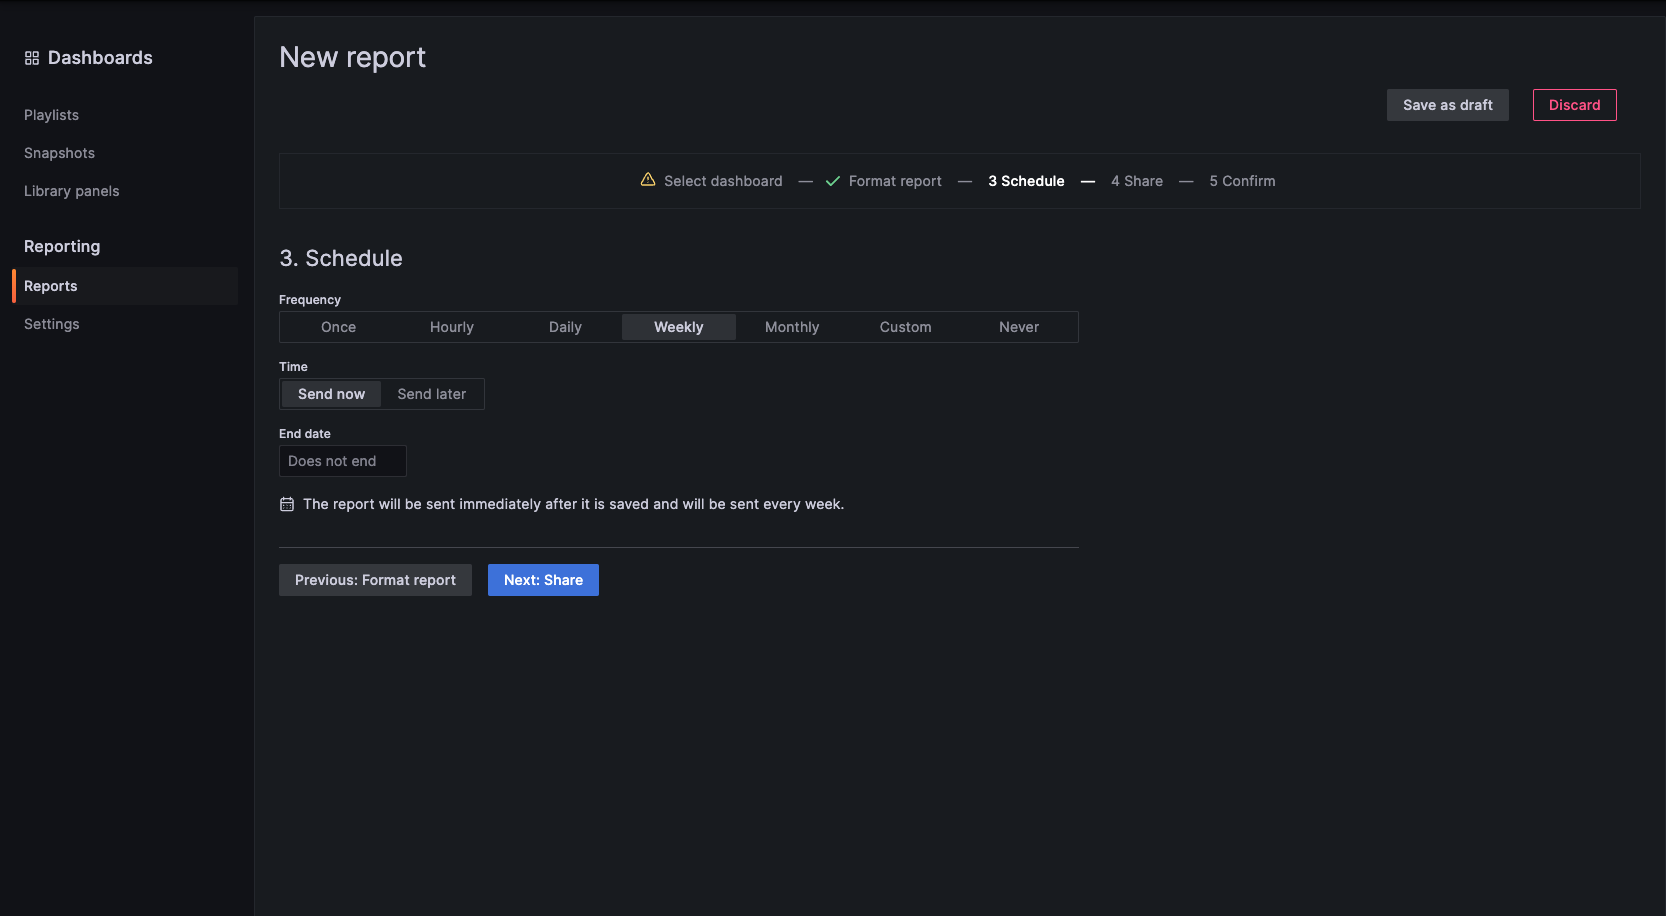
Reporting UI adapted to match the new navigation style
Generally available in Grafana Enterprise, Cloud Pro, and Cloud Advanced.
We updated the reporting UI to better fit the new navigation style, adding a horizontal slider and moving the Preview and Send buttons to the Action section in the page. We also fixed the alignment of the different sections.
Experimental support for using JWTs as auth method
Experimental in Grafana Open Source and Enterprise.
This feature adds support for using JWT tokens to store rendering keys instead of relying on “remote caching”. It covers most rendering use cases, though some still rely on the remote cache as a store. You can enable this by enabling the feature flag renderAuthJWT in the custom.ini configuration file.
Note for plugin developers
One of the major changes coming in Grafana 10 will be our upgrade to React 18 and use of the new React client rendering API. There are many significant benefits we gain from this: access to new React features like transitions and concurrent rendering, as well as other general performance and security improvements. These changes have now been delivered to the core grafana repo with PR 64428.
As with any major upgrade, there’s a potential for this to impact the way your plugin works. In particular, there could be unintended side effects caused by the changes around improving consistency with useEffect timings and automatic batching of state updates.
Recommended actions:
- Review the React 18 upgrade docs
- Test your plugins against one of the latest grafana-dev docker images (for example, this one)
- Add a comment to the forum discussion if your plugin is impacted in any way. Either to socialise the changes needed for your plugin or to reach out and ask for help yourself.


