Important: This documentation is about an older version. It's relevant only to the release noted, many of the features and functions have been updated or replaced. Please view the current version.
Loki data source
Grafana ships with built-in support for Loki, an open-source log aggregation system by Grafana Labs. This topic explains configuring and querying specific to the Loki data source.
For instructions on how to add a data source to Grafana, refer to the administration documentation. Only users with the organization administrator role can add data sources. Administrators can also configure the data source via YAML with Grafana’s provisioning system.
Once you’ve added the Loki data source, you can configure it so that your Grafana instance’s users can create queries in its query editor when they build dashboards, use Explore, and annotate visualizations.
Configure the data source
To configure basic settings for the data source, complete the following steps:
Click Connections in the left-side menu.
Under Your connections, click Data sources.
Enter
Lokiin the search bar.Select Loki.
The Settings tab of the data source is displayed.
Set the data source’s basic configuration options:
Name Description Name Sets the name you use to refer to the data source in panels and queries. Default Sets the data source that’s pre-selected for new panels. URL Sets the HTTP protocol, IP, and port of your Loki instance, such as http://localhost:3100.Allowed cookies Defines which cookies are forwarded to the data source. Grafana Proxy deletes all other cookies. Maximum lines Sets the upper limit for the number of log lines returned by Loki. Defaults to 1,000. Lower this limit if your browser is sluggish when displaying logs in Explore.
Note: To troubleshoot configuration and other issues, check the log file located at
/var/log/grafana/grafana.logon Unix systems, or in<grafana_install_dir>/data/logon other platforms and manual installations.
Configure derived fields
The Derived Fields configuration helps you:
- Add fields parsed from the log message
- Add a link that uses the value of the field
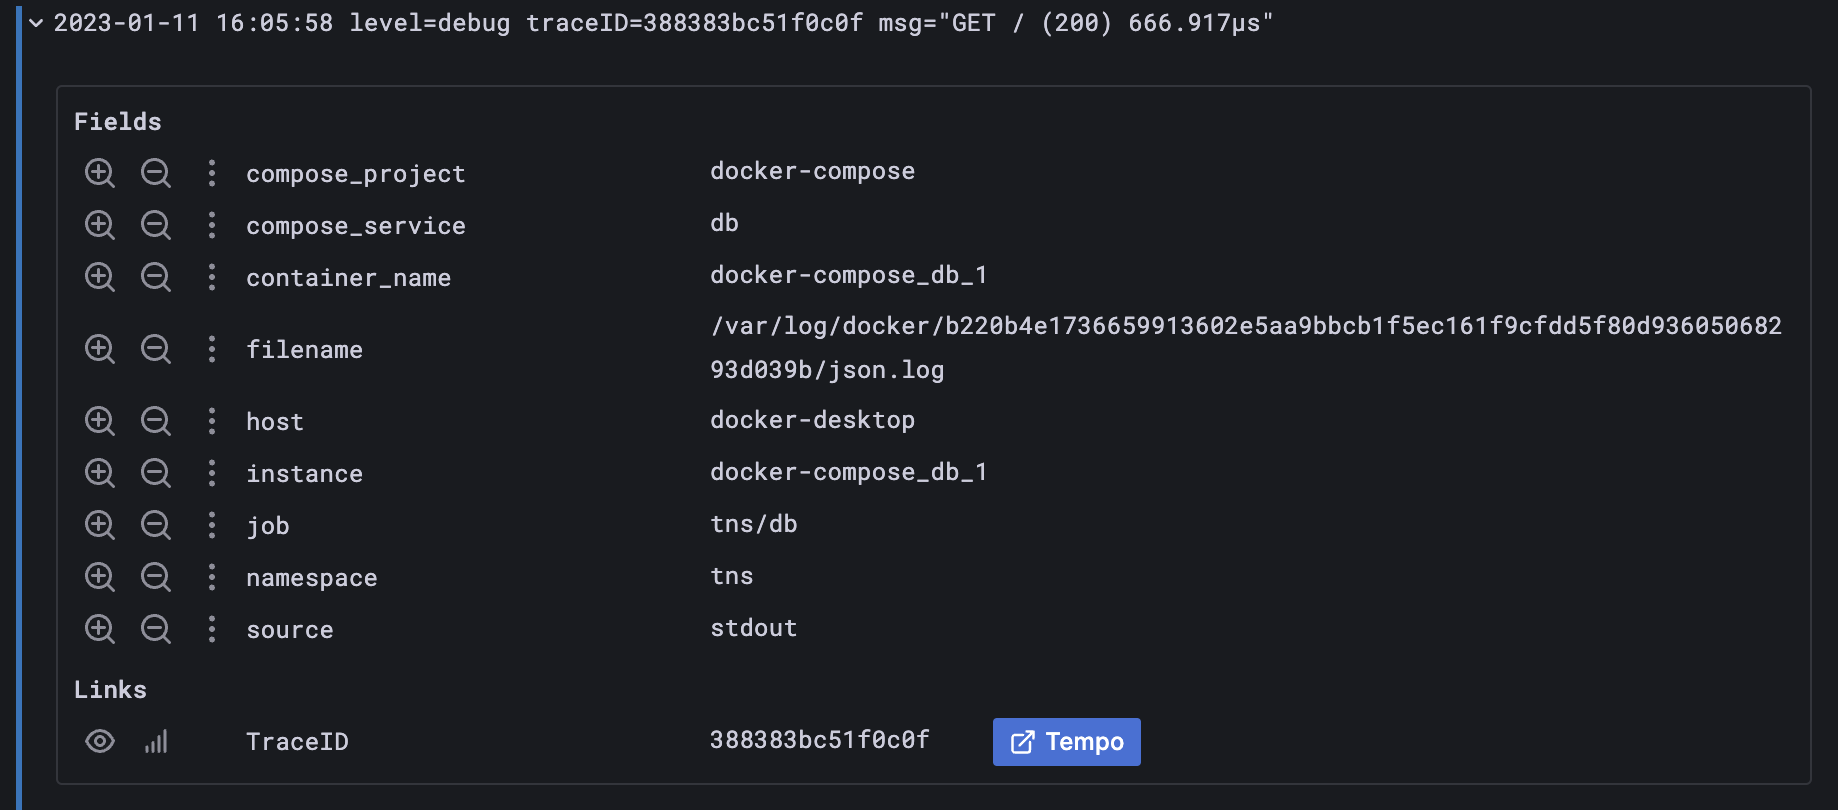
For example, you can link to your tracing backend directly from your logs, or link to a user profile page if the log line contains a corresponding userId. These links appear in the log details.
Note: If you use Grafana Cloud, you can request modifications to this feature by opening a support ticket in the Cloud Portal.
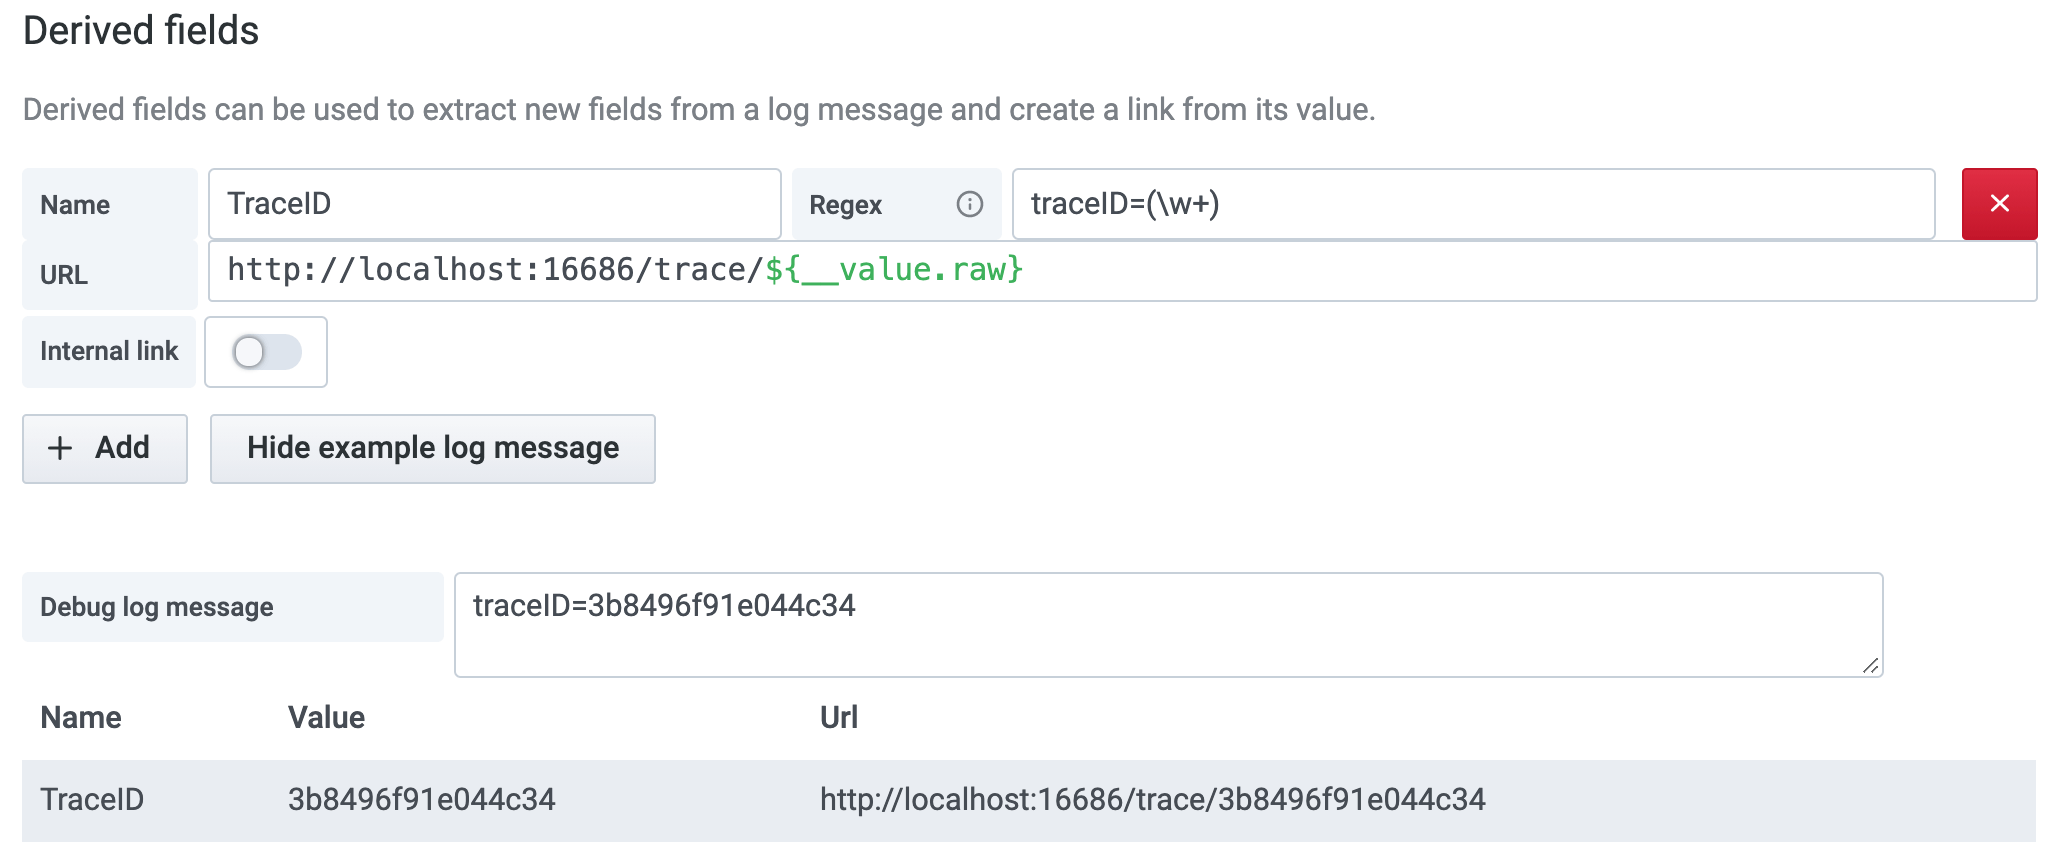
Each derived field consists of:
| Field name | Description |
|---|---|
| Name | Sets the field name. Displayed as a label in the log details. |
| Regex | Defines a regular expression to evaluate on the log message and capture part of it as the value of the new field. Can contain only one capture group. |
| URL/query | Sets the full link URL if the link is external, or a query for the target data source if the link is internal. You can interpolate the value from the field with the ${__value.raw} macro. |
| URL Label | (Optional) Sets a custom display label for the link. This setting overrides the link label, which defaults to the full external URL or name of the linked internal data source. |
| Internal link | Defines whether the link is internal or external. For internal links, you can select the target data source from a selector. This supports only tracing data sources. |
Troubleshoot interpolation
You can use a debug section to see what your fields extract and how the URL is interpolated. Select Show example log message to display a text area where you can enter a log message.

The new field with the link shown in log details:

Provision the data source
You can define and configure the data source in YAML files as part of Grafana’s provisioning system. For more information about provisioning, and for available configuration options, refer to Provisioning Grafana.
Provisioning examples
apiVersion: 1

datasources:
  - name: Loki
    type: loki
    access: proxy
    url: http://localhost:3100
    jsonData:
      maxLines: 1000
Using basic authorization and a derived field:
You must escape the dollar ($) character in YAML values because it can be used to interpolate environment variables:
apiVersion: 1

datasources:
  - name: Loki
    type: loki
    access: proxy
    url: http://localhost:3100
    basicAuth: true
    basicAuthUser: my_user
    jsonData:
      maxLines: 1000
      derivedFields:
        # Field with internal link pointing to data source in Grafana.
        # Right now, Grafana supports only Jaeger and Zipkin data sources as link targets.
        # datasourceUid value can be anything, but it should be unique across all defined data source uids.
        - datasourceUid: my_jaeger_uid
          matcherRegex: "traceID=(\\w+)"
          name: TraceID
          # url will be interpreted as query for the datasource
          url: '$${__value.raw}'

        # Field with external link.
        - matcherRegex: "traceID=(\\w+)"
          name: TraceID
          url: 'http://localhost:16686/trace/$${__value.raw}'
    secureJsonData:
      basicAuthPassword: test_password
Using a Jaeger data source:
In this example, the Jaeger data source’s uid value should match the Loki data source’s datasourceUid value.
datasources:
    - name: Jaeger
      type: jaeger
      url: http://jaeger-tracing-query:16686/
      access: proxy
      # UID should match the datasourceUid in derivedFields.
      uid: my_jaeger_uid
Query the data source
The Loki data source’s query editor helps you create log and metric queries that use Loki’s query language, LogQL.
For details, refer to the query editor documentation.
Use template variables
Instead of hard-coding details such as server, application, and sensor names in metric queries, you can use variables. Grafana lists these variables in dropdown select boxes at the top of the dashboard to help you change the data displayed in your dashboard. Grafana refers to such variables as template variables.
For details, see the template variables documentation.


