Important: This documentation is about an older version. It's relevant only to the release noted, many of the features and functions have been updated or replaced. Please view the current version.
Elasticsearch query editor

This topic explains querying specific to the Elasticsearch data source. For general documentation on querying data sources in Grafana, see Query and transform data.
Select and edit metrics
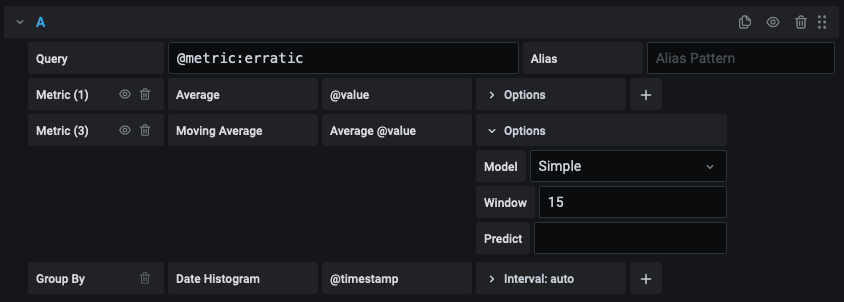
You can select multiple metrics and group by multiple terms or filters when using the Elasticsearch query editor.
Use the plus and minus icons to the right to add and remove metrics or group by clauses. To expand the row to view and edit any available metric or group-by options, click the option text.
Use template variables
You can also augment queries by using template variables.
Name a time series
You can control the name for time series via the Alias input field.
| Pattern | Replacement value |
|---|---|
{{term fieldname}} | Value of a term group-by |
{{metric}} | Metric name, such as Average, Min, Max |
{{field}} | Metric field name |
Control pipeline metrics visibility
Some metric aggregations, such as Moving Average and Derivative, are called Pipeline aggregations. Elasticsearch pipeline metrics must be based on another metric.
Use the eye icon next to the metric to prevent metrics from appearing in the graph. This is useful for metrics you only have in the query for use in a pipeline metric.

Create a query
Write the query using a custom JSON string, with the field mapped as a keyword in the Elasticsearch index mapping.
If the query is multi-field with both a text and keyword type, use "field":"fieldname.keyword" (sometimes fieldname.raw) to specify the keyword field in your query.
| Query | Description |
|---|---|
{"find": "fields", "type": "keyword"} | Returns a list of field names with the index type keyword. |
{"find": "terms", "field": "hostname.keyword", "size": 1000} | Returns a list of values for a keyword using term aggregation. Query will use current dashboard time range as time range query. |
{"find": "terms", "field": "hostname", "query": '<Lucene query>'} | Returns a list of values for a keyword field using term aggregation and a specified Lucene query filter. Query will use current dashboard time range as time range for query. |
Queries of terms have a 500-result limit by default.
To set a custom limit, set the size property in your query.


